Magnetic resonance imaging (MRI) is highly effective for the morphologic and functional evaluation of myocardial diseases. It is used much less frequently than echocardiography, however, for the diagnosis and monitoring of cardiomyopathies. In comparison with echocardiography, the three-dimensional (3D) data set available with MRI provides a more precise and reproducible method for qualifying ventricular volumes, mass, and function. ECG-referenced multidetector CT (MDCT) and electron-beam CT also provide 3D data and consequently should have similar capabilities. CT is not used much in the evaluation of nonischemic myocardial diseases.
Considerable new information has been produced in the past few years showing the value of MRI in various myocardial diseases. It has become clear that this technique provides insight into ventricular morphology and function and myocardial tissue characterization. Indeed tissue characterization with delayed contrast enhancement provides insight into the etiology of a number of myocardial diseases.
TECHNIQUES
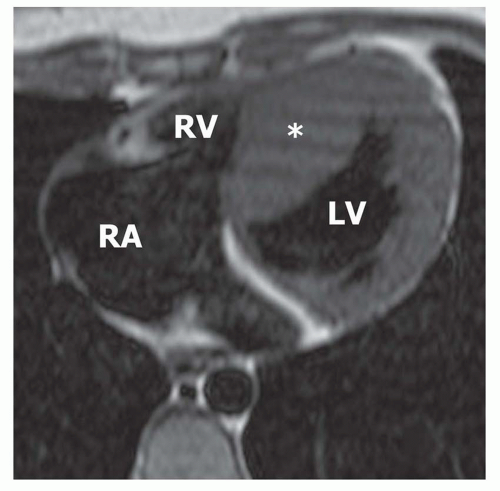
The ECG-gated spin-echo (SE) acquisitions in the axial and coronal planes are customarily used to demonstrate the morphology of the ventricles and pericardium. Sharp demarcation of the endocardium is achieved on single- or multiple-slice breath-hold turbo SE images with preparatory double-inversion recovery pulses applied to vitiate the signal of the blood pool (Fig. 33-1). Contrast-enhanced T1-weighted gradient-echo (GRE) inversion recovery images may be applied to demonstrate regional or focal differential (hyper-) enhancement at sites of inflammation, ischemic injury, or fibrosis associated with some myocardial diseases (Fig. 33-2). New T2-weighted sequences can demonstrate myocardial edema.
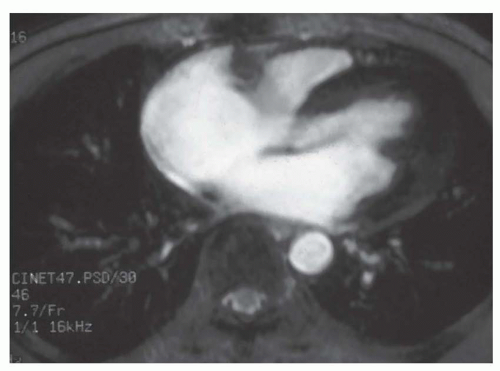
Cine MR images are acquired for the purpose of quantifying ventricular volumes, mass, and global function. Cine MR images are now usually done with some form of balanced steady state free precession sequence. A set of these images at multiple levels encompassing the heart provides a volumetric data set for the direct measurement of the end-diastolic, end-systolic, and stroke volumes, mass, and ejection fraction of both the left ventricle and right ventricles. The blood pool is bright on cine MRI. The balanced steady-state free precession techniques represented by true fast imaging with steady precession (FISP), fast imaging employing steady-state acquisition (FIESTA), and balanced fast field echo (bFFE) sequences provide a homogeneous bright signal of the blood pool throughout the cardiac cycle and relatively high temporal resolution in a short acquisition period (Fig. 33-3). Cine MRI sequences are usually acquired in the cardiac short axis plane encompassing both ventricles from base to apex and in one or more long-axis planes for the quantification of ventricular volumes and function (Fig. 33-4). On cine MR images, valvular regurgitation associated with cardiomyopathies or subvalvular stenosis accompanying some forms of hypertrophy cardiomyopathy may be recognized by a signal void (high-velocity jet flow; Fig. 33-5). High velocity flow can also cause a circumscribed jet of high signal when the velocity is below a certain threshold.
FIG. 33.1. Asymmetric hypertrophic cardiomyopathy. T1-weighted spin-echo image in the axial plane shows thickening of the ventricular septum (asterisk) with a normal thickness of the left ventricular (LV) lateral wall. RV, right ventricle; RA, right atrium.
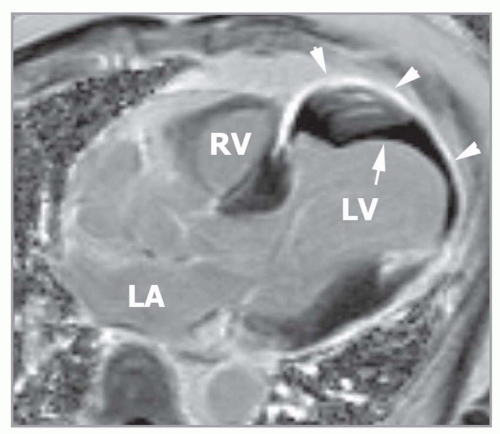
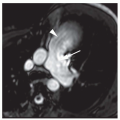
FIG. 33.2. Delayed-enhancement image in the horizontal long axis plane demonstrates patchy areas of delayed enhancement within the hypertrophied ventricular septum (arrows).
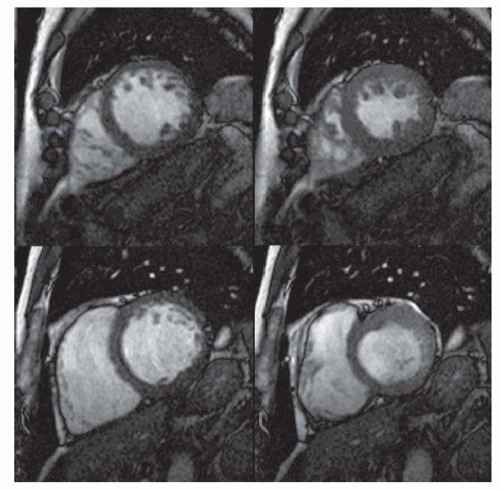
FIG. 33.3. End-diastolic cine MR images in the short axis plane at the left ventricular basilar (A), midventricular (B), and apical levels (C) demonstrate severe hypertrophy of the ventricular septum (VS). LV, left ventricle.
Velocity-encoded (VEC; phase contrast) cine MRI can be used to measure blood flow into the aorta or pulmonary artery to quantify the left ventricular (LV) or right ventricular (RV) stroke volume, respectively. It has also been used for direct measurement of the volume of valvular regurgitation, which may accompany some cardiomyopathies. Velocity encoded (phase contrast) cine MR in LV outflow tract (LVOT) plane can be used to estimate gradient across LVOT in obstructive hypertrophic cardiomyopathy (Fig. 33-6).
Delayed contrast-enhanced MR (DE-MR) involves the application of an inversion recovery GRE sequence at a delay time after administration of a gadolinium chelate (0.1 to 0.2 mmol/kg). The delay time is 10 to 15 minutes after injection and the inversion time is set to null the signal of normal myocardium. The usual inversion time is in the range of 225 to 300 ms. Abnormal myocardium appears bright in contrast to normal myocardium (Fig. 33-2). The abnormal bright region can be due to edema, necrosis, fibrosis, or various infiltrates which expand the extracellular space of the myocardium.
FIG. 33.4. Top and center: Series of cine MR (balanced FFE) images in the cardiac short axis plane from apex (top left) to base (bottom right). Bottom: Images in the horizontal long axis (left), vertical long axis (middle), and left ventricular outflow planes (right).
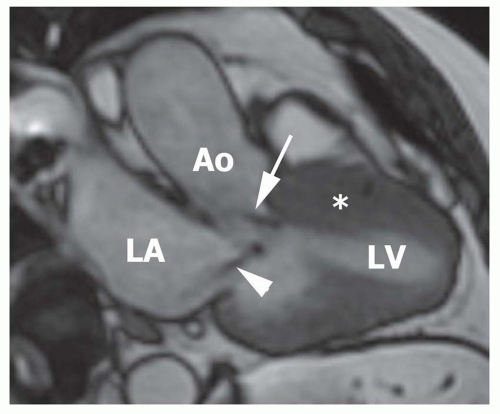
FIG. 33.5. Systolic cine MR image in the left ventricular outflow tract plane shows subaortic stenosis due to a thick ventricular septum (asterisk) in a patient with hypertrophic cardiomyopathy. Note the flow jet (arrow) starting at the level of the subaortic stenosis and extending to the ascending aorta (Ao). There is also a flow jet (arrowhead) consistent with associated mitral regurgitation. LV, left ventricle; LA, left atrium.
CLASSIFICATION OF CARDIOMYOPATHIES
According to the consensus of the World Health Organization and the International Society and Federation for Cardiology, cardiomyopathies are defined as diseases of the myocardium associated with cardiac dysfunction. Based on pathophysiologic features, they have been divided into four main categories: dilated, hypertrophic, restrictive, and arrhythmogenic RV cardiomyopathy (Table 33-1). In addition, diseases of the myocardium that are associated with specific systemic disorders are termed specific cardiomyopathies. Cardiomyopathies caused by pathologic substances or cells infiltrating the myocardium are called infiltrative cardiomyopathies such as amyloid and sarcoid myocardial disease (cardiomyopathy). Infiltration and fibrosis of the endocardium and subendocardium is very rare in temperate climates and is called endomyocardial infiltrative cardiomyopathy. These rare forms are now classified as restrictive cardiomyopathies.
FIG. 33.6. Magnitude (A) and phase (B) images of velocity encoded cine sequence in the left ventricular outflow tract. Note the flow jet (arrow) starting at the subaortic region, consistent with subaortic stenosis. LV, left ventricle; LA, left atrium; Ao, aorta.
TABLE 33.1 Classification of Cardiomyopathies
Clinico-anatomical Classification
Dilated cardiomyopathy
Hypertrophic cardiomyopathy
Restrictive cardiomyopathy
Arrhythmogenic right ventricular vardiomyopathy (dysplasia)
Pathological Classification
Infiltrative
Dilated Cardiomyopathy
This entity is characterized by dilation and diminished contraction of the left or both ventricles. End-systolic and end-diastolic volumes are increased, whereas stroke volume and ejection fraction are decreased. Mild to moderate mitral regurgitation and tricuspid regurgitation are frequently associated with the ventricular enlargement. The wall thickness of the left ventricle is usually within the normal range, so that an overall increases in LV mass results. There are many causes of dilated cardiomyopathy (Table 33-2). However, most cases have no identifiable cause (idiopathic). The most common cause of dilated cardiomyopathy is myocardial ischemia secondary to coronary artery disease in which the degree of myocardial dysfunction is frequently not explained by the obvious extent of myocardial infraction. Hypertension, viral diseases, alcoholism, diabetes, obesity, several toxins, and hereditary factors also lead to dilated cardiomyopathy. The most common clinical feature of dilated cardiomyopathy is LV failure. Mural thrombus may form in the dilated left ventricle.
Hypertrophic Cardiomyopathy
A variety of distribution patterns of inappropriate myocardial hypertrophy develop in the absence of an obvious hemodynamic stress (increased afterload), such as aortic stenosis or systemic hypertension (Table 33-3). The disease is genetically transmitted in about half of the cases and follows an autosomal dominant inheritance pattern with variable penetrance. Possible manifestations are symmetric involvement of the entire left ventricle or both ventricles or asymmetric hypertrophy of the upper septum, midportion of the ventricular septum, or apex. Nonobstructive and obstructive hypertrophic cardiomyopathy can be distinguished by the associated hemodynamic alterations. Asymmetric septal hypertrophic cardiomyopathy can cause obstruction of the LV outflow tract. The hallmark is dynamic subvalvular aortic stenosis. During diastole, the LV outflow tract appears normal or slightly narrowed because of the presence of upper septal hypertrophy. Increasing stenosis develops during systole as the anterior leaflet of the mitral valve moves in an anterior direction toward the septum, thereby narrowing the outflow tract. Although uncommon in the Western world, apical hypertrophy is prevalent in Japan. This type of hypertrophic cardiomyopathy does not cause obstruction of the outflow tract. Midventricular type involves hypertrophy of the middle of the LV with mid cavity obliteration in systolic causing high wall tension in the isolated LV apex. LV apical dyskinesis or aneurysm is frequent. Symmetric hypertrophic cardiomyopathy is also recognized and may be a particularly severe form. Involvement of the right ventricle is a feature of the disease in infants and children.
TABLE 33.2 Some Etiologies of Dilated Cardiomyopathy
TABLE 33.3 Phenotypes of Hypertrophic Cardiomyopathy
Asymmetric septal obstructive nonobstructive
Concentric
Apical
Midventricular
Right ventricular
Restrictive without hypertrophy
Restrictive Cardiomyopathy
This entity is characterized by hampered ventricular filling secondary to myocardial diastolic stiffness. Flow into the ventricles is rapid during early diastole; it then plateaus, and little filling takes place in late diastole. End-diastolic pressure is elevated in both ventricles, whereas systolic function is normal or only slightly reduced. Endomyocardial fibrosis and Loeffler endocarditis are now classified as types of restrictive cardiomyopathy. Loeffler endocarditis is associated with hypereosinophilia. Degranulation of endomyocardial eosinophils is suspected to be responsible for focal necrosis and subsequent fibrosis and for the formation of mural thrombus. Increased stiffness of the ventricular walls and reduction of the cavity by organized thrombus contribute to the restrictive filling pattern. Endomyocardial fibrosis, a different entity with a peak geographic distribution in equatorial Africa, is not associated with hypereosinophilia. In this disease, fibrosis of the apex and subvalvular regions leads to restrictive cardiomyopathy. Glycogen storage diseases, radiation fibrosis, and certain infiltrative diseases, such as amyloidosis and sarcoidosis, can also cause restrictive cardiomyopathy. Many cases of restrictive cardiomyopathy are idiopathic.
TABLE 33.4 Types of Infiltrative Diseases of Myocardium and Endocardium
Amyloidosis
Sarcoidosis
Loeffler’s eosinophilic endocardial fibroplasia
Endomyocardial fibrosis
Hemochromatosis
Glycogen storage diseases
Mucopolysaccharidoses
Anderson-Fabry’s disease
Whipple’s disease
Gaucher’s disease
Sphingolipidoses
Specific cardiomyopathies are myocardial diseases that are associated with a specific cardiac or systemic disease. Hemochromatosis, sarcoidosis, amyloidosis, and hypertensive or metabolic cardiomyopathy are examples of specific cardiomyopathies. Dilated cardiomyopathy may be the result of inflammation (myocarditis).
Several classifications also consider infiltrative cardiomyopathy as an additional category (Table 33-4). The definition of infiltrative cardiomyopathy refers solely to the histopathologic mechanism of infiltration of myocardial tissue, and the diseases in this group may cause either restrictive or dilated cardiomyopathy. Hemochromatosis is an example of an infiltrative cardiomyopathy in which the cardiomyopathy is of the dilated type, whereas amyloidosis usually causes a restrictive pattern.
FIG. 33.7. Cine MR images at two levels at end diastole (left) and end systole (right) in a patient with dilated cardiomyopathy.
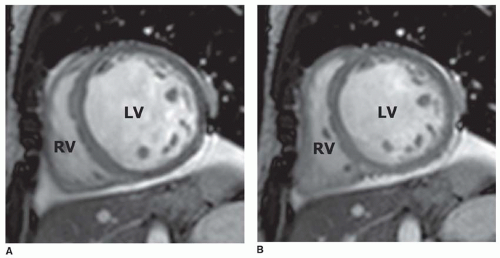
FIG. 33.8. Short axis cine MR images in the end-diastolic (A) and end-systolic (B) frames demonstrate a severely enlarged left ventricle (LV) with poor systolic function. RV, right ventricle.
IMAGING FEATURES
Dilated Cardiomyopathy
The morphologic characteristics of dilated cardiomyopathy are clearly depicted on ECG-gated SE MRI or cine MRI (Figs. 33-7 and 33-8) (Table 33.5). Morphologic changes include enlargement of the left ventricle and sometimes the right ventricle and atria. The thickness of the LV wall usually remains normal. The MRI features in dilated cardiomyopathy are frequently nonspecific, so that the various underlying causes cannot be distinguished. However, it is usually possible to distinguish between ischemic and nonischemic forms of dilated cardiomyopathy. In most cases of nonischemic dilated cardiomyopathy, the wall thickness of the left ventricle is uniform; no regional wall thinning is recognized. If the cardiac dilation is caused by prior myocardial infarction and ischemia, usually one or more regional areas of severe wall thinning with or without ventricular aneurysm are seen. MRI may demonstrate localized ventricular dilation after occlusion of a major coronary artery rather than global dilation; the latter is characteristic of dilated cardiomyopathy. Delayed contrast-enhanced MRI may be used to demonstrate regional hyperenhancement in a subendocardial or transmural distribution at the site of prior myocardial infarction to distinguish patients with ischemic cardiomyopathy (Fig. 33-9). Regional delayed hyperenhancement is not a usual feature of idiopathic dilated cardiomyopathy (Fig. 33-9). A minority of patients (almost 30%) with idiopathic dilated cardiomyopathy show delayed contrast enhancement. The hyperenhancement is not subendocardial but rather in a midwall distribution especially in the septum. These may be cases of myocarditis presenting in the chronic phase as dilated cardiomyopathy.
TABLE 33.5 Imaging Features of Dilated Cardiomyopathy
Increased LV end diastolic volume
Increase LV end systolic volume
Decreased LV stroke volume
Decreased LVEF
Normal LV wall thickness
± Decreased RVEF
FIG. 33.9. Delayed-enhancement image in two different patients. (A) shows no delayed-enhancement in an axial plane image of a patient with idiopathic dilated cardiomyopathy (same patients as in Fig. 33.8). (B) shows short-axis image with transmural delayed-enhancement in the inferolateral wall, consistent with prior myocardial infarction in a patient with ischemic dilated cardiomyopathy. LV, left ventricle; RV, right ventricle.
Ventricular mass, ventricular thickness, and ventricular volumes can be quantified with cine MRI to determine the severity of dilated cardiomyopathy. Cine MRI measurements of LV volumes, mass, and ejection fraction in dilated cardiomyopathy have been shown to be highly reproducible between studies. The 3D data set with MRI is especially useful for monitoring LV dimension and function over time. Because of its high degree of accuracy and reproducibility, MRI can be used to monitor the effect of treatment in individual patients and in clinical studies to assess the efficacy of new therapeutic interventions. For example, significant decreases in LV systolic volume, wall stress, and mass and increase in ejection fraction have been shown in dilated cardiomyopathy after angiotensin-converting enzyme inhibitor treatment and other therapies.
Although the right ventricle is usually less dilated and its systolic function is less severely depressed, RV diastolic abnormalities, such as an increased time to peak filling rate, have been detected using cine MRI and VEC (phase contrast) cine MRI. The profile of diastolic inflow velocity measured in the region of the tricuspid valve is flattened in comparison with that in healthy volunteers. It is suspected that the altered morphology and function of the left ventricle causes functional changes in RV filling.
FIG. 33.10. Cine MR image in a patient with hemochromatosis. Note the low signal of the myocardium caused by iron deposition.
The signal intensity on SE and GRE images has not been found to be consistently altered in dilated cardiomyopathy, except in cardiomyopathy associated with hemochromatosis (Fig. 33-10). Shortening of relaxation rates has been shown on SE, T2*, and GRE images of myocardium overloaded with iron.
Mural LV thrombus can be readily identified on cine MR images and on DE-MR (delayed gadolinium-enhanced inversion recovery GRE) images. The most frequent site of thrombus is the LV apex (Fig. 33-11).
FIG. 33.11. Delayed enhancement image in the horizontal long axis plane shows transmural hyperenhancement (arrowheads) and left ventricular thrombus (arrow) in a patient with ischemic cardiomyopathy consistent with prior myocardial infarction. LA, left atrium; LA, left ventricle; RV, right ventricle.
TABLE 33.6 Imaging Features of Hypertrophic Cardiomyopathy
Normal LV end diastolic volume
Normal or reduced LV end systolic volume
Normal or increased LVEF
Increased LV wall thickness (> 12 mm)
Asymmetric or symmetric increased LV wall thickness
Septal to posterolateral wall thickness ratio >1.5
Increased RV wall thickness (especially children)
Delayed gadolinium hyperenhancement in septum or junction of septum-anterior wall
Mimics restrictive cardiomyopathy rarely
Myocardial crypts—genotypes without hypertrophy
Hypertrophic Cardiomyopathy
The initial diagnosis of hypertrophic cardiomyopathy is nearly always established by echocardiography (Table 33.6). The typical diagnostic feature on any imaging modality is a ratio of the end-diastolic thickness of the septum to the posterolateral wall greater than 1.5. Because not all patients have asymmetric hypertrophy, an additional criterion is concentric hypertrophy (end-diastolic wall thickness greater than 1.2 cm) in the absence of a cause for hypertrophy, such as hypertension, aortic stenosis, or extreme isometric exercise. MRI enables a precise delineation of the location and extent of hypertrophic myocardium in persons with hypertrophic cardiomyopathy (see Figs. 33-1,33-2 and 33-3, 33-5, and 33-12,33-13,33-14,33-15 and 33-16). One of the major clinical roles of MRI is to evaluate unusual forms of hypertrophy that are difficult to assess with echocardiography (Figs. 33-17 and 33-18). Another indication for MRI is sequential monitoring of the LV mass and assessment of prognosis using delayed MRI, the extent of delayed enhancement is related to morbidity and mortality.
Only gold members can continue reading. Log In or Register to continue