Fig. 12.1
DECT with Dual source (Siemens). Two x-ray tube detectors are placed in the same rotation gantry at an angular compensation of 90–94° (first and second generation) with one tube functioning at 80 or 100 kV and the other working at 140 kV. One of the detectors covers the entire field of view (FOV) with a diameter of 50 cm while the second one has a smaller FOV (26 or 33 cm) according to the scanner generation (first or second respectively)
Two x-ray tube detectors are mounted onto the same rotation gantry at an angular offset of 90–94° (first and second generation) with one tube working at 80 or 100 kV and the other running at 140 kV. Table 12.1 summarizes the technical settings.
Table 12.1
Technical parameters of DECT with dual source CT Siemens
First generation | Second generation | |
|---|---|---|
Slices | 32 × 2 × 0.6 mm | 64 × 2 × 0,6 mm |
Gantry rotation | 330 msec | 280 msec |
Temporal resolution | 83 msec | 75 msec |
Tube A | 140 mAs, 140 kvp (aditional filter) | 140 mAs, 140 kvp |
Tube B | 165 mAs, 100 Kvp | 165 mAs, 100 Kvp |
Pitch | 0.2- 0.43 | 0.2- 0.43 |
FOV Tube A/Tube B | 50 cm/26 cm | 50 cm/33 cm |
Window width full dose | 35–75 % Phases high heart rates and variability 65–75 % phase low heart rate and variability | |
Detector-Oriented
There are two options:
B1) kV switching
B2) Dual layer detector
kV Switching
A single tube capable of switching rapidly between the low and high tube potential.
This approach trusts on the ability of the detector to differentiate low-energy from high-energy X-ray photons in a single X-ray beam. The tube potential switching occurs as rapidly as every 0.5 ms. Each pair of 80 and 140 kV projections are essentially acquired from the same view angle. To avoid spectral contamination between consecutive 80 and 140 kV projections, the scanner uses a scintillating material (gemstone) that has an ultrafast primary falloff time (0.03 ms) and low afterglow (delayed fluorescence) (Fig. 12.2).
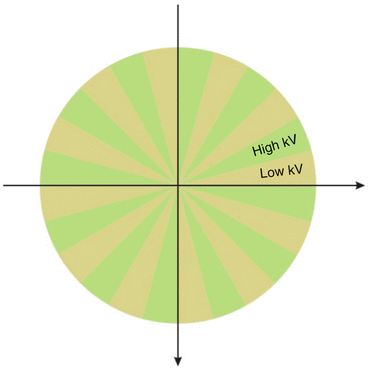

Fig. 12.2
DECT with kVp switching (general electric healthcare). A single x-ray tube skilled in switching rapidly between the low [78] and high (140 kV) tube potentials. Each pair of 80 and 140 kV projections are fundamentally acquired from the same view angle
There is minimal view angle mismatch between the successive high and low tube potential projections so material decomposition can be performed in the projection space which would lead to a more exact BH correction. Table 12.2 summarizes the technical configuration.
Table 12.2
Technical parameters DECT with KVp switching
Single source KVP switching | |
|---|---|
Slices | 64 × 2 × 0.625 mm |
Gantry rotation | 350 msec |
Temporal resolution | 135 msec |
Tube settings | 275–640 mAs, 140/80 kvp |
FOV | 50 cm |
Padding | <60 bpm: center 75 % phase (padding 100 msec) 60–78 bpm: center 60 % phase (padding 200 msec) >78 bpm : center 45 % phase ( padding 100 ms) |
Type of scanning | Prospective |
Detector-Oriented with Dual-Layer Detector
A single-source dual-layer detector system (Philips Medical Systems) more closely resembles the ideal energy-resolving photon counting system (Fig. 12.3).
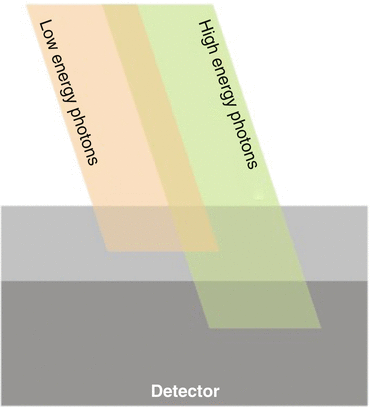

Fig. 12.3
Dual layer dual energy approach (Philips medical systems). The x-ray detector consists of two different scintillating materials attached together. This strategy would allow higher energy x-ray photons to pass through the top layer without suffering significant interface, whereas the lower energy photons are mostly attenuated in the top layer. The two signals, one from the top and one from the bottom of this sandwich detector, would correspond to x-rays in two different energy ranges
The x-ray detector consists of two different scintillating materials bonded together. This design would allow higher energy X-ray photons to pass through the top layer without suffering significant interaction, whereas the lower energy photons are mostly attenuated in the top layer.
The two signals, one from the top and one from the bottom of this sandwich detector, would correspond to x-rays in two different energy ranges. Table 12.3 epitomizes the technical settings.
Table 12.3
Accuracy of DECT for myocardial perfusion
Authors | Number patients | Gold standard modality | S | Sp | PPV | NPV | Ac | |
Manken et al. Inter J Cardiovasc Imaging 2008 [74] | 15 | Stress rest RMI with LE | 74 % | 97 % | na | na | na | |
Hennman et al. Am J Cardiol 2008 [76] | 69 | Stress rest SPECT | 75 % | 98 % | 68 % | 99 % | na | |
Ruzscics et al. EurRadiol 2008 [53] | 35 | Stress rest SPECT | 91 % | 92 % | 81 % | 96 % | 91 % | |
Invasive angiography | 79 % | 92 % | 76 % | 93 % | 89 % | |||
Composed | 84 % | 93 % | 75 % | 96 % | 91 % | |||
Rubinstein et al. Heart 2009 [75] | 122 | Stress rest SPECT | 75 % | 98 % | 68 % | 99 % | na | |
Bauer et al. AJR 2010 [78] | 36 | Stress rest RMI with LE | 77 % | 97 % | 85 % | 96 % | 94 % | |
Ko et al. AJR 2012 [67] | 45 | Invasive angiography | CTA | 91.8 % | 67.7 % | 73.6 % | 87.5 % | NA |
CTA+CTP | 93.2 % | 85.5 % | 85.3 % | 91.4 % | NA | |||
Kido et al. Springer plus 2014 [68] | 25 | Invasive angiography | CTA | 83.3 % | 74.4 % | 66.7 % | 87.8 % | 77.8 % |
CTA+CTP | 66.7 % | 92.3 % | 84.2 % | 81.8 % | 82.5 % | |||
Authors | Numberpatients | Gold standard modality | S | Sp | LR+ | L- | AUC | |
De Cecco et al. [71] | 29 | SPECT invasive angiog. [24] | CTA | 95 % | 50 % | − | − | 0.72 % |
CTP | 95 % | 50 % | − | − | 0.72 % | |||
CTA + CTP | 90 % | 67 % | − | − | 0.78 % | |||
Carrascosa et al. [70] | 25 | SPECT | CTA | 66.7 % | 72.4 % | 2.4 % | 0.5 % | 0.7 % |
CTP | 73.7 % | 94.7 % | 13.8 % | 0.3 % | 0.84 % | |||
CTA + CTP | 56 % | 97 % | 18.7 % | 0.4 % | 0.77 % | |||
The main advantage of this design is that at each view the high- and low-energy projections are exactly registered with respect to each other.
However, one potential problem is that the high- and low-energy projections are spectrally less separated from each other compared with the rapid tube potential switching or dual-source system, which could lead to suboptimal material decomposition and BH correction for quantitative MP imaging.
Scanning Techniques
Scanning techniques will depend on the platform that is being used.
The workflow to perform an anatomical and functional evaluation by DECT is similar to SECT.
There are two alternatives to be done:
Stress- Rest
Rest- Stress
The selection will depend according to the patient’s pretest probability of CAD.
Stress- Rest is preferred for patients with moderate to high probability of CAD or with high calcium score. In this approach the priority is given for ischemia detection.
Rest-Stress is chosen in patients with low probability of CAD or low or negative calcium score. In this alternative the importance is to rule out CAD.
For stress scans a pharmacologic agent is applied including adenosine, dipiridamol or regadenoson. Adenosine has to be infused for 2–5 min at a rate of 140 ugr/min/kg, regadenoson requires a single injection of 0,4 mg in a single bolus, and dipiridamol uses 0.56 mg/kg in slow bolus infusion (3–5 min).
Contrast Media Injection Protocol
In general, a triphasic protocol is selected. Ideally an 18 gouge access is chosen and placed in the right antecubital vein. It is connected to a dual-syringe injector.
The delay time can be determined by a test bolus using 20 ml of non-ionic contrast and 30 ml of saline solution in a dual phase injection. The preferred injection rate is 5–6 ml/s, if possible.
Automatic bolus tracking is another option. It requires placing a region of interest (ROI) in the ascending aorta with a predefined threshold of 130 UH. When the contrast reaches that level the scan is initiated automatically.
The triple phase injection consists of a first phase of undiluted contrast (60 ml), a second phase of mixed contrast and saline solution (60 ml: 30 %/70 %) and a third phase of pure saline solution (30 ml).
Dual Source
Scans are performed at stress and rest with retrospective electrocardiographic gating with tube current modulation.
According to the patients’ heart rate and variability the dose window needs to be adjusted. Only in selected phases the tube output will be set at 100 %, while among the non-selected phases the tube current will be decreased to 20 % approximately.
If the patient has high and irregular heart rate a wide full dose pulse windows needs to be used (e.g., 35–75 %) but if the patient has a low and regular rate a narrow full dose windows is sufficient (e.g., 65–75 %).
For the stress scan systolic as well as diastolic phases are required for the analysis so the window will be adapted according to the patient’s heart rate.
For the rest scan in general the heart frequency is low, although if the patient still has a heart rate higher than 65 bpm, beta-blockers can be administered, so as to achieve a stable and low rate. In this manner an arrow window needs to be used.
Single Source with KVP Switching
DECT in this platform only works in a prospective manner. For that reason both stress and rest have to be done in axial mode.
Both scans have similar parameters differencing only in the extent of padding required for the acquisition. As in stress we need to obtain systolic as well as diastolic phases, the padding needs to be wider (Eg. 200 ms) and the center of acquisition should be at approximately 60 %.
Types of Analysis and Post-Processing
Images can be evaluated in two different ways:
Monochromatic Analysis
Images obtained are initially called “mixed images” that means that are obtained by linear weighting of the CT value for the two spectra. These images are equivalent to the standard CT ones and correspond to an intermediate energy.


W: dual energy composition,
X: CT value in the mixed image,
X low and X high: CT values of the low and high kV image, respective
Once acquired, images can be decomposed in different energy levels. The spectrum ranges from 40 to 140 keV.
Each level will allow visualizing the myocardium with higher and lower iodine concentration.
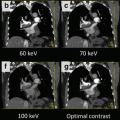
Low energy levels show higher contrast enhancement in the myocardium as well as in the coronary vessels but are associated with increase in noise. In this level also beam hardening artifact can be present. On the contrary, higher energy levels have lower myocardium and intravessel contrast with lower image noise and beam hardening artifact is cancelled (Fig. 12.4).
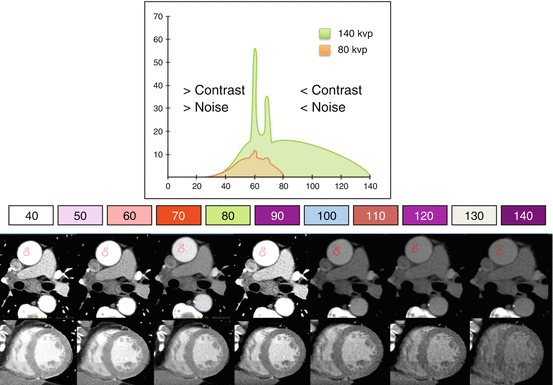

Fig. 12.4
Monochromatic evaluation (Energetic spectrum). The graph shows the two tube powers at 80 Kv and 140 Kv. They generate a spectrum that ranges from 40 to 140 kVp. Lower energy levels present more intraluminal contrast but more noise; and high energy levels show less intraluminal contrast and reduced noise. Images in the aorta and left ventricle short axis demonstrate what happens at different energy levels with the contrast and the noise
Images at 140 keV will be similar to non–contrast images. They are known as “virtual non contrast images”. For myocardial perfusion these levels are not useful. However, they are advantageous for the quantification of calcium score from a dual energy scan with contrast load. Traditional contrast calcium score acquisition before the CCTA study can be therefore avoided.
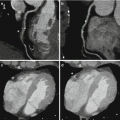
In monochromatic grades, images can be analyzed without beam hardening artifact. In general, the best levels for the assessment of myocardial perfusion are those between 70 keV or greater (Fig. 12.5).
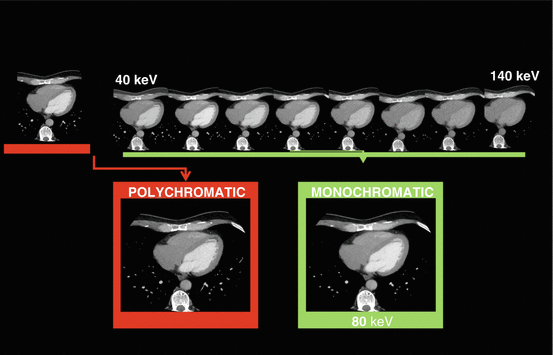

Fig. 12.5
From polychromatic to monochromatic evaluation to reduce beam hardening artifact. The polychromatic image is showing a perfusion defect in the apex (arrow). Monochromatic evaluation in different energetic levels shows normal perfusion at medium and high energy level
BHA is a limitation of Single Energy CTP, which can demonstrate difficulties to confirm or rule out perfusion defects in cases with moderate CAS with associated perfusion defects in the corresponding coronary territory. In those situations it is difficult to determine if such perfusion defect is a true positive or false negative finding. DECT may play an interesting role in these scenarios.
DECT permits to identify any perfusion defect and evaluate its behavior among the different energetic levels. The evaluation can be qualitative or quantitative. Grey scale and color scale are available forth analysis.
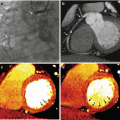
In cases with a true perfusion defect, it will persist in all energetic levels. However, if there is a BHA, the pseudo-hypoperfusion will be present only in low energetic levels (40 keV), it is going to attenuate in higher levels (from 40 to 70 keV) and will disappear in levels above 100 (Figs. 12.6 and 12.7) [63].
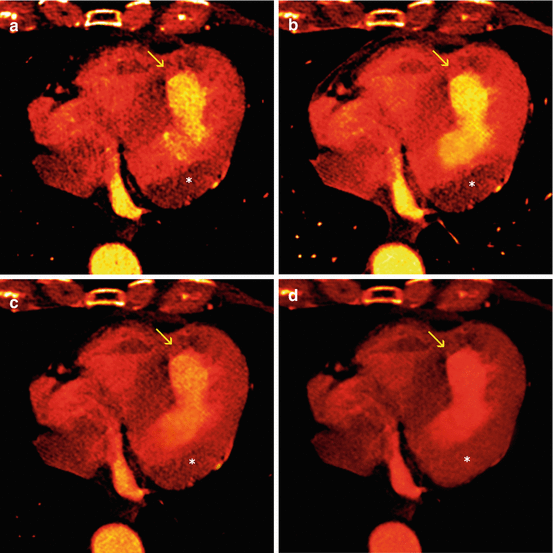
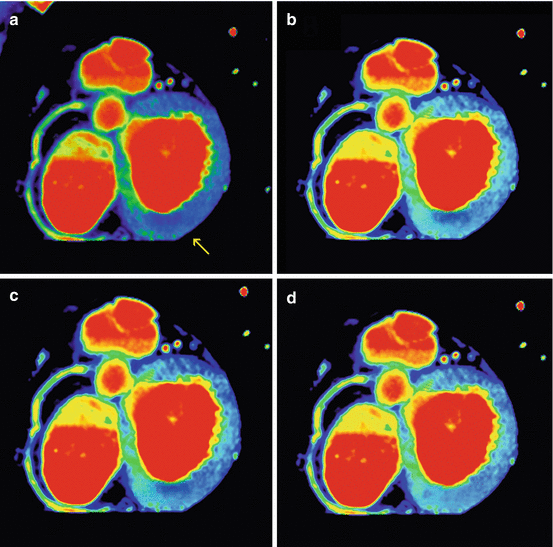

Fig. 12.6
True hypo-perfusion defect versus Beam hardening artifact. (a) Axial color scale polychromatic image is showing an hypo-perfusion in the apical and antero-septal wall (arrow). There is also an hypo-perfusion in the lateral wall in the basal plane*. (b–d) Monochromatic images at different levels (40 keV, 60 keV and 80 keV) demonstrate that the apical and antero-septal defect persists confirming a true perfusion deficit (arrow) whereas the hypo-perfusion in the basal lateral wall is present at low energy levels 40 keV, attenuates in 60 keV and disappears at high level of 80 keV (beam hardening artifact)*

Fig. 12.7
Reduction of BHA in monochromatic evaluation. (a) Color polychromatic short axis in the basal plane showing a perfusion defect in the infero-lateral wall (arrow). (b–d) Color monochromatic short axis in the basal plane at 40 keV, 60 keV and 80 keV. The defect is present at 40 keV, attenuates at 60 keV and disappear at 80 keV confirming that the hypo-perfusion identified in the polychromatic image was a beam hardening artifact
In the stress scan, systolic and diastolic phases are required for the analysis, as motion artifacts can limit the accuracy.
Images are reprocessed in short axis views and complemented in long axis in order to perform the 17 segmental analysis of the American Heart Association (AHA).
DECT short axis images are best evaluated with slice thickness of 4–5 mm instead of thicker 8 mm-slices that are suggested for SECT.
Once the best energy level is determined a quantitative analysis can be complemented in a similar manner to SECT. Measurements in HU can be done in each of the 17 segments in the subendocardial layer as well as in the subepicardial layer and obtain the transmural index plus mean HU value in normal vs. abnormal segments.
Material Decomposition
This type of analysis is based in the main principle of DECT.
DECT enables a better assessment of the different tissues and materials that can be found in the body without artifacts such as beam hardening.
Material decomposition is based on different attenuation coefficients, which depend on the energy levels of the X-ray beam.
It also gives information about effective atomic number and mass density maps, in the form of basic materials such as water or iodine.
Using material decomposition is possible to select two different materials in an arbitrary manner being able to suppress one and select the other one.
Also it is possible to quantify the amount of each material per mm3 of tissue. The amount can be given in ug, ng or mg per mm3 of tissue.
For myocardial perfusion a useful combination is iodine/water.
This type of analysis permits to measure the amount of iodine per mm3 of the myocardium and determine if there is a normal or an abnormal perfusion. Iodine distribution in the myocardium can be a surrogate of myocardial blood pool.
Figures 12.8 and 12.9 are examples of material decomposition in normal and pathologic iodine maps of the myocardium respectively.
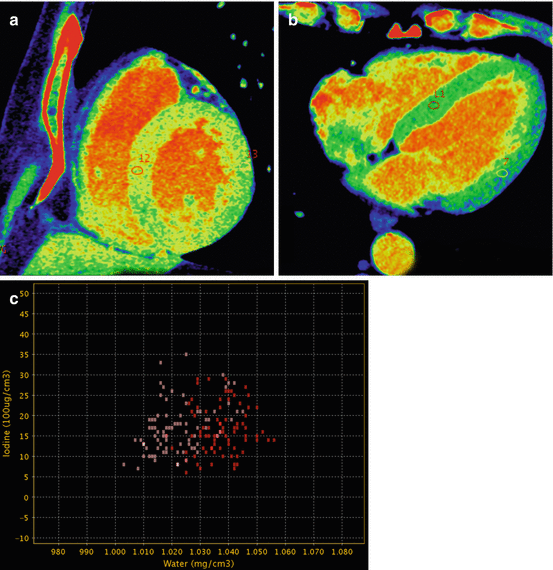
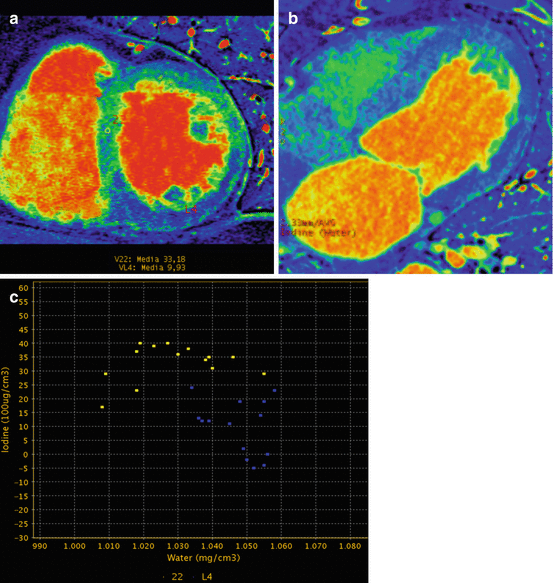

Fig. 12.8
Normal iodine map. (a) Color short axis view in mid-ventricular plane showing normal perfusion with homogeneous iodine distribution. Two Region of Interest (ROI) are placed in the septal and lateral wall with similar iodine concentration. (b) Four chamber with similar findings (c) Dispersion GSI diagram. The ROIs placed in septal and lateral wall measure similar amount of iodine

Fig. 12.9
Pathologic iodine map. (a) Color short axis view in midventricular plane showing an inferior hypo-perfusion defect with reduced iodine concentration. A ROI is showing the iodine concentration in that area. A second ROI is placed in the normal septal wall. (b) Four chamber view displaying the hypo-perfusion in the lateral and apical region with normal septal wall. (c) Dispersion GSI diagram illustrating the difference in iodine concentration in the normal and pathologic regions
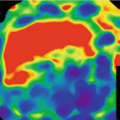
Material decomposition can be shown in gray scale or in color scale. There are several options for color coding of the iodine map such as hot iron, Page phase, rainbow, dark gold·D, French and others (Fig. 12.10).
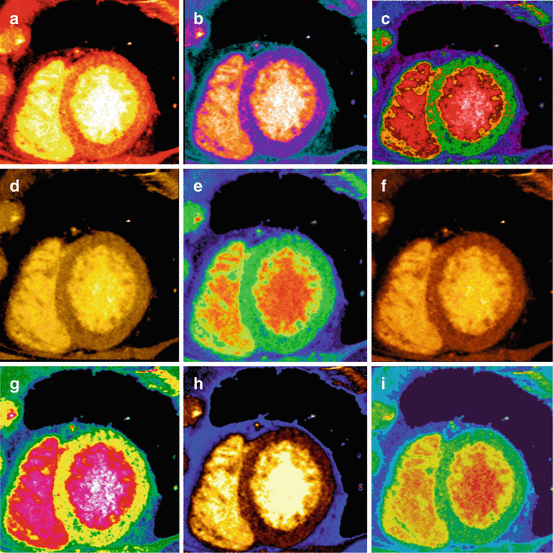

Fig. 12.10
Different color maps for perfusion evaluation. There are different alternatives to analyze in color the images for monochromatic evaluation as well as for iodine maps. Color images can help in the identification of perfusion defects which in some cases can be difficult to detect in grey scale. Some examples are: (a) Hot Iron; (b) GE; (c) Page Phase; (d) Gold 3D, (e) Rainbow; (f) Dark gold 3D.; (g) French; (h) Perfusion; (i) Spectrum
Several authors such as Schwarz et al. [54]. prefer “Micro-Delta-Hot-Metal” color-coding, because they believe it most closely resembles the SPECT images from myocardial perfusion studies.
Scientific Evidence
There are several papers showing the results of DECT in myocardial perfusion.
Some of them are focused in reversible defects and others on fixed defects. They have been done in limited number of patients and with different reference standard modalities such as SPECT, cardiac MRI and ICA. Results of DECT are summarized in Table 12.4.
Table 12.4
Radiation doses of DECT for myocardial perfusion
Authors | Number patients | Gold standard modality | Scanner | Radiation dose |
|---|---|---|---|---|
Meinel et al. Radiology [66] | 55 | SPECT | DSCT 2nd gen | Rest: 5.6 mSv |
Stress: 7.1 mSv | ||||
LE: 4.7 mSv | ||||
Ko et al. AJR 2012 [67] | 45 | Invasive angiography | DSCT | Stress: 10.8 ± 2.5 mSv |
Rest: 5.7 ± 0.5 mSv | ||||
Kido et al. Springer plus 2014 [68] | 21 | Invasive angiography | DSCT 1st gen | Stress-rest: 7.7 ± 2.8 mSv |
Schwarz et al. Eur Rad 2008 [57] | 35 | Invasive angiography | DSCT 1st gen | Stress-rest 15.23 ± 2.7 mSv |
De Cecco et al. AJR 2014 [71] | 29 | SPECT invasive angiography | DSCT 2nd gen | Rest: 5.8 mSv |
Stress: 6.6 mSv | ||||
LE: 4.5 mSv | ||||
Total: 16.9 mSv | ||||
Carrascosa et al. Acad Radiol 2015 [69] | 25 | SPECT | GSI with kVp switch | Rest: 3.2 ± 0.4 mSv |
Stress: 4.3 ± 1.1 mSv | ||||
Total: 7.5 ± 1.2 mSv |
DECT for Ischemia Detection
DECT has shown good results to identify reversible perfusion defects, since by means of material decomposition and/or monochromatic evaluation a more precise information can be obtained.
One of the first studies was performed by Ruzscis et al. [52], including 36 patients with equivocal or discordant SPECT. DECT studies were carried out with first generation DSCT. There were 157 hypoperfused segments on SPECT, 89 were fixed. DECT correctly identified 96 % of fixed and 88 % of ischemic myocardial perfusion defects. Overall sensitivity and specificity for any defect was 92 % and 93 % respectively.
Another paper published by Wang et al. [64] done in 34 patients with known CAD or pathologic SPECT evaluated the usefulness of rest DECT versus ICA as gold standard modality. Thirty one out of 34 patients achieved adequate image quality. DECT had a sensitivity of 68 % and specificity of 93 % for the detection of any myocardial perfusion defect. Combined anatomic and functional evaluation showed small improvements in diagnostic accuracy (from 86 % to 88 %).
In the paper of Weininger et al. [51] “Adenosine-stress dynamic real-time myocardial perfusion CT and adenosine-stress first-pass dual-energy myocardial perfusion CT for the assessment of acute chest pain”, the authors evaluated dynamic CT and DECT for myocardial perfusion assessment in patients with acute chest pain. The population studied were 20 consecutive patients (15 men, 5 women; mean age 65 ± 8 years) who presented with acute chest pain and who had a clinically indicated stress/rest SPECT and cardiac MRI. Patients were divided into two groups: group A (n = 10 patients) underwent adenosine-stress dynamic real-time myocardial perfusion CT and group B (n = 10 patients) adenosine-stress first-pass dual-energy myocardial perfusion CT using the same CT scanner in dual-energy mode. Two independent observers analyzed all CT perfusion studies in a qualitative manner. CT findings were compared with MRI and SPECT.
Stay updated, free articles. Join our Telegram channel

Full access? Get Clinical Tree


