Myocardial Perfusion Imaging: CT Applications


Myocardial Perfusion Imaging: CT Applications


Brian S. H. Ko, BSc, MBBS, PhD, FRACP

James D. Cameron, MBBS, MD

Dennis T. L. Wong, BSc, MBBS, PhD, FRACP,

Sujith K. Seneviratne, MBBS, FRACP


▪ Introduction

Coronary artery disease (CAD) remains a leading cause of morbidity and mortality worldwide.1 The natural history of CAD is characterized by the silent accumulation of atherosclerotic plaque in the wall of coronary arteries, progression into obstructive disease as excess plaque accumulates beyond maladaptive positive remodeling, the development of stress-induced ischemia as a result of luminal encroachment, and ultimate plaque rupture resulting in unstable angina, myocardial infarction, and sudden cardiac death.2

Over the past decade, multiple studies have demonstrated that coronary CT angiography (CCTA) is a robust noninvasive method for detection of atherosclerotic plaque and obstructive CAD (defined as the presence of >50% stenosis on invasive angiography) with a high sensitivity and negative predictive value in patients with suspected CAD.3,4,5 and 6 Accordingly, since 2010, CCTA has been recommended by the American College of Cardiology as an appropriate upfront investigation for symptomatic patients with low and intermediate risk of CAD.7,8 The use of CCTA in this population is currently a class IIa recommendation according to European Society of Cardiology and American College of Cardiology guidelines.9,10

While CCTA accurately detects anatomical disease, in its current form, it is limited in predicting lesion-specific ischemia.11,12 When compared with invasive fractional flow reserve (FFR), which is the current gold standard for determination of vessel- and lesionspecific ischemia, CCTA has been found to have a high sensitivity and negative predictive value for ischemia, yet the specificity and positive predictive value are significantly limited (Table 21.1). This is a notable limitation as myocardial ischemia represents an important factor that determines clinical outcomes21 and benefits from revascularization.22,23,24 and 25 For this reason, patients with identified significant stenoses on CCTA often require further functional assessment, which entails additional testing, radiation exposure, cost, and inconvenience.

Current assessment for myocardial ischemia is typically performed with noninvasive stress imaging including stress echocardiography, single photon emission computed tomography (SPECT), or magnetic resonance imaging (MRI) myocardial perfusion imaging (MPI). It should be noted that with the exception of MRI MPI, which is commonly available only in quaternary referral centers,19,26 stress echocardiography and SPECT MPI have been demonstrated to have poor discrimination of vessel-specific ischemia.27,28 and 29 Using invasive FFR as reference standard for vessel-specific ischemia, SPECT MPI identifies ischemia territory correctly less than 50% of the time, with underestimation and overestimation in 36% and 22% of cases, respectively.27 Such data have evoked concerns for the ability of stress testing to effectively isolate coronary lesions that benefit from revascularization (Table 21.2).

Over the past 5 to 10 years, an important focus of CT research is the development of novel techniques to evaluate each step in the pathophysiology of CAD including the assessment of the hemodynamic significance of coronary artery lesions and associated myocardial ischemia (Fig. 21-1). These are aimed at enabling cardiac CT to act as a one-stop shop modality to assess the anatomical and physiologic sequelae of CAD. The novel CT techniques, which will be discussed in this book chapter, include CT stress myocardial perfusion imaging (CTP) to evaluate for the presence of myocardial ischemia, the use of noninvasive CT fractional flow reserve (FFR CT), and the study of transluminal attenuation gradient (TAG) across coronary lesions to assess the hemodynamic significance of coronary lesions.


▪ CT Myocardial Perfusion Imaging


Fundamentals of CT Myocardial Perfusion Imaging

MPI on CT is facilitated by the use of iodinated contrast, which possesses the unique ability to attenuate x-rays proportional to its concentration. Imaging is acquired as contrast transits from the arteries into the myocardium and can be performed at rest and during vasodilator stress such as adenosine,15,16,33 regadenoson,34,35 or dipyridamole.36 In the absence of artifacts, hypoattenuated areas in the myocardium on CT represent areas of reduced perfusion. George et al.37 were among the first to describe the use of the technique using a canine model of LAD ischemia, which demonstrated the significant difference in contrast attenuation between ischemic tissue and remote nonischemic tissue (Fig. 21-2).


Static and Dynamic Imaging

Two basic techniques can be applied for stress CTP: static imaging and dynamic imaging (Fig. 21-3). Static stress CTP is analogous to static SPECT MPI, and dynamic stress CT MPI is analogous to dynamic MRI MPI. Both static and dynamic CTP are performed during the first pass of contrast agent bolus passage through the myocardium. Differences in enhancement between normal and ischemic myocardium are maximal during the upslope of myocardial bolus passage, and the ability to distinguish enhancement differences is increased. During the downslope, the differences become less and disappear (Fig. 21-3). The timing of scan acquisition is hence paramount.


TABLE 21.1 Per-Vessel Diagnostic Performance of Multidetector CT in Prediction of Hemodynamically Significant Stenoses Compared with Invasive Fractional Flow Reserve


Author


Year


Pt no


Prevalence (Per Vessel %)


Sensitivity (%)


Specificity (%)


PPV (%)


NPV (%)


Meijboom et al.12


2008


79


18


94


48


49


93


Sarno et al.13


2009


81


31


79


64


46


88


Koo et al.14


2011


103


37


91


40


47


89


Bamberg et al.15


2011


33


30


100


51


47


100


B. Ko et al.16


2012


42


51


93


60


68


90


B. Ko et al.17


2012


40


33


95


68


77


93


Wong et al.18


2013


53


38


94


66


64


94


Bettencourt et al.19


2013


101


24


95


67


48


97


Norgaard et al.20


2014


254


21


83


60


33


92


TABLE 21.2 Per Vessel Diagnostic Accuracy of Noninvasive Stress Imaging Compared with Invasive Fractional Flow Reserve


Author


Year


Population


Patient Number


Sens/Spec (%)


PPV/NPV (%)


SPECT MPI


Hacker et al.29


2005


Intermediate stenoses


50


80/76


92/53


Ragosta et al.30


2007


Multivessel disease


36


59/85


86/57


Forster et al.31


2009


Multivessel disease†


72


62/90


62/90


Melikian et al.27


2010


Angiographic multivessel disease


67


61/69


47/80


Stress echocardiography


Rieber et al.32


2004


Intermediate lesions


48


67/77


Not reported


Jung et al.28


2008


Intermediate lesions


70


56/67


48/74


MRI-MPI


Watkins et al.26


2009


Chest pain evaluation


103


91/94


91/94


Bettencourt et al.19


2013


Suspected coronary disease


101


79/93


79/93


Figure 21-1. The “one-stop” anatomical and functional coronary assessment using cardiac CT.


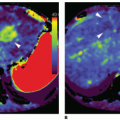
Figure 21-2. Perfusion defects (arrows) demonstrated using a canine model of LAD ischemia. (Adapted from George RT, Silva C, Cordeiro MA, et al. Multidetector computed tomography myocardial perfusion imaging during adenosine stress. J Am Coll Cardiol 2006;48:153-160, with permission from Elsevier.)


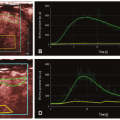
Figure 21-3. Dynamic and static CTP. This graph shows typical time-attenuation curve (TAC) acquired by dynamic CT MPI and two static images of the same midventricular slice, corresponding to different time points of CT MPI scan. The orange curve (I) in the graph represents the TAC in normal tissue, the purple curve (II) that of ischemic myocardium. The green curve (III) is the TAC of the ascending aorta. Differences in enhancement between normal and ischemic myocardium are maximal during upslope of myocardial bolus passage. Image (A) was taken at the time point indicated by line A in the graph during contrast upslope. Image (B) was taken 6 s later as indicated by line B during early contrast downslope. The variation between the images emphasizes that timing of CT image acquisition is paramount for MPI assessment. (Adapted from Ho KT, Chua KC, Klotz E, et al. Stress and rest dynamic myocardial perfusion imaging by evaluation of complete time-attenuation curves with dual-source CT. JACC Cardiovasc Imaging 2010;3:811-820, with permission from Elsevier.)


In static or “snapshot” CTP imaging, only a single image stack is acquired similar to CCTA acquisition. Static imaging requires exact scan timing at a single time point during the upslope or maximum of the contrast agent bolus passage. Scan acquisition can be performed using helical or step-and-shoot techniques using narrow detector (≤64-detector row CT) or prospective ECG gating using wide-detector CT (256/320-detector row CT). Myocardial blood flow (MBF) can be assessed qualitatively and semiquantitatively. Animal studies have shown strong nonlinear correlation between static CTP and microsphere MBF.37 Subsequent human studies demonstrated that perfusion as assessed and quantified by transmural perfusion ratio (TPR) was inversely and linearly related to percent diameter stenosis with a correlation of r = 0.63.33 Furthermore, abnormal TPR has been found to be significantly associated with ischemia demonstrated on invasive FFR.17

In dynamic CTP imaging, multiple stacks are acquired at multiple time points during the upslope of contrast passage through the myocardial tissue. From the series of images obtained, a time-contrast attenuation curve (TAC) can be derived (Fig. 21-3). The unique advantage of dynamic imaging is the ability to derive MBF and myocardial blood volume from TACs using various mathematical models including a modelbased deconvolution method, upslope, and Patlak plot methods using available dedicated computer analysis software.15,38,39 In one of the initial reports, George et al., using 64-detector CT in a canine model of moderate-to-severe LAD artery stenosis, demonstrated that CT-derived MBF using model-based deconvolution analysis and two upslope methods strongly correlated with microsphere-derived MBF (R2 = 0.91, p < 0.0001) with a mean difference of 0.45 mL/g/min.40


Figure 21-4. Advances in CT scanner technology. The advances, which have been most advantageous for perfusion imaging, include improvements in temporal resolution, increased longitudinal coverage, and decreased scan time.

Dynamic CTP when compared with static CTP requires a higher radiation exposure39 and the use of advanced CT scanners. The technique has been thus far only been evaluated in secondgeneration dual-source CT (DSCT) scanners using shuttle mode imaging during which the CT table rapidly alternates between two positions and as a result provides a limited coverage of the left ventricle of 73 mm.38 Wide-detector CT scanners may have a unique potential to overcome this by offering full coverage of the left ventricle without less than one heartbeat, though feasibility studies have not been performed as yet.


Perfusion Imaging Has Been Facilitated by Advances in CT Technology

Technologic advances over the past decade have equipped modernday cardiac CT scanners with a larger number of detector rows, faster gantry rotation speed, dual x-ray source, and extended longitudinal coverage of the heart. While there is currently no one scanner that offers all of the above-mentioned technology, these advances have enabled contemporary imaging to occur with superior temporal and spatial resolution and to require shorter scan and breath hold times with reduced radiation exposure (Fig. 21-4). These advances have been particularly advantageous for perfusion imaging (Table 21.3).


Wide-Detector CT

Traditional narrow detector (64-detector row) scanners typically offer 3 to 4 cm of longitudinal coverage, and hence, the assessment of the entire volume of the myocardium can only
be completed after multiple gantry rotations over three to four heartbeats. Myocardial contrast attenuation hence varies between the superior and inferior aspects of the heart due to the lack of temporal uniformity when image acquisition spans multiple cardiac cycles.


TABLE 21.3 CT Scanners Used in Myocardial Perfusion Imaging—Strengths and Limitations


Scanner/Mode of Acquisition


Strengths


Limitations


Narrow detector CT


64 detector helical CT


Readily available


Prolonged scan time/breath hold requirement


Nonuniform temporal contrast enhancement in myocardium


Slab misregistration artifacts


High radiation dose


Wide-detector CT


320-detector CT using prospective ECG gating


Short scan time


Temporal contrast distribution in entire myocardium


No slab misregistration artifacts


Low radiation dose


Low temporal resolution


Dual source CT (DSCT)


First-generation DSCT using retrospective ECG gating


High temporal resolution


Prolonged scan time


Nonuniform temporal contrast enhancement in myocardium


Second-generation DSCT using prospective dynamic shuttle mode


High temporal resolution


Real-time imaging similar to MR perfusion


Limited z-axis coverage (73 cm) precluding assessment of some myocardial segments


High radiation dose hence may not allow for complementary CCTA evaluation.


Second-generation DSCT using prospective high-pitch spiral mode


High temporal resolution


Short scan time


Temporal contrast distribution in entire heart volume


No slab misregistration artifacts


Low radiation dose


Dual-energy CT using first- or second-generation DSCT


Offers additional information above contrast attenuation


Low temporal resolution


Adapted and revised from Ko BS, Cameron JD, Defrance T, et al. CT stress myocardial perfusion imaging using multidetector CT—A review. J Cardiovasc Comput Tomogr 2011;5:345-356, with permission from Elsevier.


Wide-detector scanners (256- and 320-detector row CT) offer extended longitudinal coverage of 12 to 16 cm and hence the convenience of imaging the whole heart in one gantry rotation. This requires a shortened scan acquisition time of less than a heartbeat (0.35 milliseconds) and a short patient breath-hold time of 1 to 2 seconds without the need for table movement. The shortened scan time required is an asset in myocardial perfusion imaging (CTP) as there is only a narrow time period during the early portion of first-pass circulation when the iodinated contrast is predominantly intravascular and when the extravascular iodine concentration exceeds the intravascular iodine concentration.41 In addition to this, because the entire volume is imaged at the same time, there is temporal contrast distribution across the entire volume of myocardium, which is ideal for myocardial perfusion assessment.42


Dual-Source CT

During vasodilator stress imaging, heart rates typically increase by 15 to 20 beats above the baseline heart rate at rest.16,43 For this reason, improvements in temporal resolution are most welcome in stress CT perfusion imaging and may assist in the minimization of motion artifacts encountered during image acquisition in patient with higher heart rates. Single x-ray source CT scanners offer a temporal resolution between 135 and 175 milliseconds. Accordingly, images are optimized when acquired at heart rates of less than 65 to 70 bpm. DSCT scanners contain a single gantry with two x-ray tubes at an angle of 90 degrees and two corresponding x-ray detectors. This modification offers significant improvements in temporal resolution (75 to 83 milliseconds), which can more effectively freeze cardiac motion.44 The latest generation of DSCT also offers the ability to image in shuttle and high-pitch spiral mode. During shuttle mode, images are acquired in two alternating table positions with the table shuttling back and forth to cover a 73-mm anatomic volume.15,38 Alternatively, prospective ECG-synchronized highpitch spiral mode allows acquisition of the entire myocardium
within an ultrafast scan time of 0.25 to 0.27 seconds during one end-diastolic phase due to the fast table movement, which will also ensure temporal contrast enhancement throughout the entire myocardium.45

DSCT scanners have the added ability to operate in dual energy mode (DECT), in which one x-ray tube emits a high-energy spectra and the other, a low-energy spectra during a single scan. DECT exploits the principle that tissues in the body and intravascular iodinated contrast have unique spectral characteristics when irradiated with x-rays of different energy levels. Upon processing separate image reconstructions of the high- and low-energy data, the iodine content within the myocardium is determined based upon the unique x-ray absorption characteristics of iodine at different kV levels.46 This provides color-coded iodine concentration myocardial maps, which offers additional information beyond the usual attenuation values and facilitates more specific tissue delineation that can be used for the detection of myocardial ischemia. DECT can be performed at a cost of increasing temporal resolution to 165 milliseconds.


Image Acquisition


CCTA/CTP Protocol


Patient Preparation

Before the scan, patients are advised to avoid caffeine, which is a nonselective competitive adenosine receptor antagonist. Intravenous access is obtained in both antecubital veins for the administration of contrast and vasodilator stress agent (Fig. 21-5). Given the importance of heart rate control to minimize motion artifacts, oral and/or intravenous beta-blockers are administered to aim for a heart rate of less than 60 bpm prior to CT acquisition. While beta-blockers have been described to mask ischemia in exercise MPI, such an effect has not been observed on coronary flow reserve,47 vasodilator stress SPECT MPI,48 or in CTP.16


Image Acquisition

Combined CCTA/CTP imaging requires two separate CT scan acquisitions during rest and vasodilator stress. During the procedure, the patient is closely monitored for heart rate, blood pressure, and ECG for ischemia. Both scans are performed using 50 to 75 mL of iodinated contrast (depending on patient size) aiming to achieve an iodine concentration of ≥320 mg I/mL.43 The stress scan is performed during hyperemia, typically attained after 3 to 5 minutes of intravenous adenosine administration at 140 µg/kg/min. Realtime bolus tracking is encouraged, and CTP image acquisition is timed to occur in the late upslope, peak, or very early downslope of the contrast bolus. In our institution, this is timed to occur once the target threshold of 300 HU is achieved in the descending aorta, with full volumetric imaging occurring one to two heartbeats later.16,33 In 64-row detector scanners, there is a longer delay between bolus tracking threshold detection and the onset of cardiac imaging, and triggering is recommended at a threshold of 100 to 180 HU.43


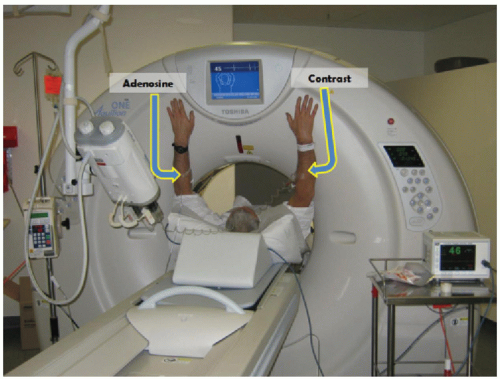
Figure 21-5. Image acquisition during coronary CT angiography/CT stress myocardial perfusion imaging (CCTA/CTP). Intravenous access is obtained in both antecubital veins for the administration of adenosine and iodinated contrast. The average time taken for the combined rest CCTA + stress CTP protocol on the CT table is 43 min. (From Ko BS, Cameron JD, Leung M, et al. Combined CT coronary angiography and stress myocardial perfusion imaging for hemodynamically significant stenoses in patients with suspected coronary artery disease: a comparison with fractional flow reserve. JACC Cardiovasc Imaging 2012;5:1097-1111.)

Depending on scanner type, images can be acquired using retrospective ECG gating or prospective ECG triggering with multicycle acquisition and reconstruction. Prospective ECGgated image acquisition should ideally be timed to occur during mid- to late diastole. George et al.33,49 noted that the best motionfree images were noted in mid- to end diastole in 79% of cases, which on average occurred during 86% of the R-R interval. In our institution, imaging is performed using the second-generation 320-detector row CT, with a tube voltage of 100 to 120 kV (depending on weight), tube current adjusted to weight, and a gantry rotation time of 270 ms (temporal resolution = 135 milliseconds). Prospective ECG gating targeting 70% to 90% of the R-R interval is used. Single heartbeat scans are acquired if the heart rate is ≤65 bpm. If the heart rate is greater than 65 bpm, a twobeat acquisition can be performed or alternatively a single-beat acquisition can be performed upon widening the window from 30% to 80% of the R-R interval.

The protocol can be performed with a rest/stress or a stress/rest protocol. The advantages and disadvantages of each imaging sequence are summarized in Table 21.4. When the time interval between the two scans is short, the contrast used during the first acquisition may still be present in the myocardium at the time of the second acquisition, which may decrease the sensitivity for detection of infracted and ischemic myocardium if the rest and
stress scans, respectively, were performed as the second scan. The advantage of the stress followed by rest protocol is that the ability for the stress scan to detect ischemia is optimized. It will also allow the administration of nitrates for the subsequent rest scan, which may have otherwise been contraindicated if the rest scan was performed up front. On the contrary, initial rest-phase imaging more closely resembles clinical practice, where patients will only proceed to have CTP performed if a coronary stenosis of at least moderate severity is identified on resting CCTA. In our institution, we most often use a rest/stress sequence (Fig. 21-6).95 Contrast contamination can be avoided in our experience by leaving an interval of at least 20 minutes between the two scans to allow wash-out of contrast from the myocardium.17,50


TABLE 21.4 CCTA/CTP imaging sequence


Advantages


Disadvantages


Stress→ Rest


Better sensitivity during stress perfusion nitroglycerin (GTN) can be given for CTA.


Contrast contamination of rest CTA (detect infarct)


Rest→ Stress


Able to stop protocol after CTA of min DSC Better sensitivity of rest scan (detect infarct)


Late contrast enhancement during stress acquisition


Adapted from Techasith T, Cury RC. Stress myocardial CT perfusion: an update and future perspective. JACC Cardiovasc Imaging 2011;4:905-916, with permission from Elsevier.


Image Interpretation


Systematic Approach for Image Interpretation

The use of a systematic approach for CCTA/CTP interpretation is vital in determining the diagnostic performance of the technique. A stepwise interpretation algorithm for CCTA/CTP interpretation has been described and outlined in Figure 21-7. The five main steps include (a) coronary CCTA interpretation, (b) CTP image reconstruction, (c) image quality assessment, (d) assessment of rest and stress CTP, and (e) correlation of coronary anatomy with perfusion defects.


Figure 21-6. CCTA/CTP imaging protocol using 320-detector CT. (Adapted from Ko BS, Cameron JD, Defrance T, et al. CT stress myocardial perfusion imaging using multidetector CT—A review. J Cardiovasc Comput Tomogr 2011;5:345-356, with permission from Elsevier.)


Step 1: Coronary CTA Interpretation

Although blinded interpretations of coronary CTA and myocardial CTP are often devised in research studies, the clinical use of myocardial CTP should involve a combined reading of coronary CTA and myocardial CTP. Images of the coronary CTA should be interpreted first. Once a potential physiologically significant stenosis is identified (in general, a stenosis ≥50% severity), the role of myocardial CTP should be to (a) assess the functional significance of a stenosis (Fig. 21-8), (b) provide information about the presence of scar versus reversible perfusion abnormalities, and (c) assess the burden of myocardial ischemia.


Steps 2 and 3: CTP Image Reconstruction and Image Quality Assessment

CTP images are reconstructed from multiple phases at 3% intervals, and the cardiac phase with the least motion and artifacts is chosen for final interpretation as they can often mimic or hide perfusion abnormalities. The common causes of artifacts include motion, beam-hardening, cone-beam reconstruction, misalignment, and poor signal-to-noise ratio.


Figure 21-7. Stepwise interpretation algorithm for CT-based anatomic/functional assessment. This starts with evaluation of the coronary CCTA (Step 1) followed by myocardial CTP image reconstruction (Step 2) and evaluation of CTP image quality (Step 3). Serial rest and stress images are then analyzed and compared for perfusion defects and other abnormalities associated with ischemia and infarction (Step 4). Finally, these analyses are correlated with anatomic localization of coronary stenoses on CCTA (Step 5). (Adapted from Mehra VC, Valdiviezo C, Arbab-Zadeh A, et al. A stepwise approach to the visual interpretation of CT-based myocardial perfusion. J Cardiovasc Comput Tomogr 2011;5:357-369, with permission from Elsevier.)


Figure 21-8. CCTA interpretation followed by CT perfusion assessment. The paradigm of CT-based cardiac risk assessment involves the use of CT angiography followed by CT perfusion if significant atherosclerosis is seen. As shown here, a moderate proximal LAD stenosis (A) is associated with an anterior and apical wall perfusion abnormality (arrows) just distal to the stenosis seen on stress myocardial CTP (C). These perfusion defects are reversible because they are absent on rest myocardial CTP (B). (Adapted from Mehra VC, Valdiviezo C, Arbab-Zadeh A, et al. A stepwise approach to the visual interpretation of CT-based myocardial perfusion. J Cardiovasc Comput Tomogr 2011;5:357-369, with permission.)


Figure 21-9. Example of images acquired during excessive cardiac motion. Cardiac motion during image acquisition can lead to ghosting of endocardial and epicardial edges and streaking (arrows). Presence of these features can make detection of perfusion abnormalities difficult and should mandate a search for alternative phases without motion. (Adapted from Mehra VC, Valdiviezo C, Arbab-Zadeh A, et al. A stepwise approach to the visual interpretation of CT-based myocardial perfusion. J Cardiovasc Comput Tomogr 2011;5:357-369, with permission.)


Motion Artifacts

Cardiac and respiratory motion during image acquisition can result in ghosting of endocardial and epicardial edges and streaking, and the presence of these features should mandate a search for alternative phases without motion (Figs. 21-9 and 21-10).96 In our practice, the optimal phase chosen for interpretation is the one with the sharpest delineation of myocardial trabeculae.


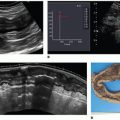
Figure 21-10. False-positive perfusion defect due to motion artifact in a patient who underwent adenosine perfusion scanning with a heart rate of 90 bpm. A: CT perfusion imaging showed apparent perfusion defects in the anterolateral and inferior walls (black arrows). B: Invasive coronary angiography (ICA) image of the LAD artery and large diagonal branch (which supplied the anterolateral wall) demonstrated no hemodynamically significant stenoses (fractional flow reserve [FFR] 0.92 in diagonal branch). C: ICA image of the right coronary artery also revealed no significant stenosis to account for apparent inferior ischemia. (Adapted from Nasis A, Seneviratne S, DeFrance T. Advances in contrast-enhanced cardiovascular CT for the evaluation of myocardial perfusion. Curr Cardiovasc Imaging Rep 2010;3:372-381, with permission.)


Beam-Hardening Artifacts

Beam hardening occurs when x-rays pass through a radiodense or contrast-filled structure with high attenuation leading to absorption of low-energy photons, which results in a hypoattenuated shadowing artifact. The artifacts can occur in the context of bone (ribs, spine, sternum) or contrast-enhanced LV cavity or descending aorta. The areas most likely to be affected are the basal inferior wall secondary to the contrast-filled descending aorta and the anterior wall, which may be affected by the LV cavity and overlying ribs (Fig. 21-11). The artifacts are typically triangular and transmural and bear a hypoenhanced appearance emanating from a structure with high attenuation and for this reason do not necessarily follow the distribution of a coronary vascular bed. To minimize artifacts, CTP images are ideally reconstructed with a kernel that incorporates beam-hardening correction algorithms (FC03 in 320-detector CT).51


Cone-Beam Artifacts

Cone-beam artifacts typically occur in wide-detector CT acquisitions and arise from the fact that the scanner isocenter and projections from the x-ray source on to the multiple detectors do not lie in the same plane. The cone angle for a 320-detector CT is 15.2 degrees compared with 1.53 degrees for a 64-detector CT. The artifact presents as low and high attenuation bands in the image that most often affects the inferior wall and can mask or mimic hypoperfusion. The bands typically extend beyond the cardiac silhouette across the entire field of view (Fig. 21-2). Reconstruction algorithms that involve organ-specific reconstruction, such as combinationweighted reconstruction algorithm, can be effective at eliminating these artifacts.52


Misalignment Artifacts

Misalignment artifacts occur in images acquired using narrow detector CT scanners, when the entire volume of the heart is acquired over several heartbeats, using helical or step and shoot protocol. Accordingly, this may result in differences in contrast attenuation in the arterial bed and myocardium between the caudal and cranial portion of the z-axis, which may increase the difficulty in identifying perfusion defects.


Figure 21-11. Beam-hardening artifact correction algorithm. Beamhardening artifacts appear as areas of hypoattenuation most commonly in the basal inferior wall (arrow). A: This wall is particularly vulnerable to this artifact because of its location being between the contrast-rich left ventricular cavity and descending aorta. B: Reconstruction kernels that implement beam-hardening correction algorithm are effective in overcoming this artifact (arrow). (Adapted from Mehra VC, Valdiviezo C, Arbab-Zadeh A, et al. A stepwise approach to the visual interpretation of CT-based myocardial perfusion. J Cardiovasc Comput Tomogr 2011;5:357-369, with permission.)


Poor Signal-to-Noise Ratio

High noise and poor signal levels may degrade the entire image. To avoid high image noise, tube and current voltages are typically chosen based on weight or body mass index.

Maintenance of adequate signal-to-noise ratio depends on the timely triggering of the scan to avoid premature or delayed triggering. Images are best timed to occur in the late upslope, peak, or very early downslope of the contrast bolus. Premature triggering can lead to high amounts of contrast remaining in the right ventricle and inadequate contrast in the left heart and coronary circulation, which can lead to inadequate LV myocardial enhancement and significant beam hardening artifacts in the septal walls because of right ventricular contrast. Delayed triggering can lead to inadequate contrast in the cardiac chambers and coronary circulation, leading to poor myocardial enhancement and loss of the presence of perfusion deficits secondary to diffusion.40


Step 4: Assessment of Resting and Stress Myocardial Perfusion


Assessment of Rest Myocardial Perfusion on CT

Areas of prior infarction and scar can be first identified on the rest images. Studies have demonstrated that CT has a high sensitivity for identification of scar.53,54 and 55 Rest images should be examined for stigmata of prior myocardial infarction, which may include the presence of subendocardial and transmural hypoattenuation, myocardial thinning, myocardial fat56,57 and myocardial calcification, aneurysmal dilation, and mural thrombus.43

Only gold members can continue reading. Log In or Register to continue

Stay updated, free articles. Join our Telegram channel

Jul 8, 2020 | Posted by in ULTRASONOGRAPHY | Comments Off on Myocardial Perfusion Imaging: CT Applications

Full access? Get Clinical Tree

Get Clinical Tree app for offline access