Perfusion CT Imaging in Oncology


Perfusion CT Imaging in Oncology


Davide Prezzi, FRCR

Vicky Goh, MD, FRCR


▪ Introduction

Dynamic contrast-enhanced CT imaging techniques (perfusion CT) enable clinicians to evaluate the functional blood supply to a tumor. From the subsequent changes in tumor and vascular enhancement following intravenous administration of an iodinated contrast agent, qualitative and quantitative parameters may be assessed that may quantify regional perfusion, blood volume, and microcirculatory changes. These tumor parameters provide prognostic or predictive information to the clinician and enable downstream treatment effects on the vasculature to be assessed. This technique was first described in the 1970s, but its clinical use has increased in recent years due to a combination of factors: technologic advances in acquisition and postprocessing methods facilitating its clinical implementation and a perceived clinical need, related to the use of therapeutic interventions in oncology. This chapter discusses the principles of perfusion CT techniques and their clinical application in oncology.


▪ Principles of Perfusion CT


Contrast Agent Kinetics

Assessment of the functional vasculature of a tissue or organ of interest by dynamic contrast-enhanced computed tomography (CT), also known as perfusion CT, is based on the evaluation of intravenous contrast agent kinetics. In clinical practice low molecular weight (<1 kDa) iodinated contrast agents are used, which have negligible serum protein binding. Their distribution in the body is similar to that of extracellular fluid. Following a bolus intravenous injection, the contrast agent distributes rapidly within the vascular system (Fig. 32-1). As the contrast agent transits through a vascular bed, it passes from the intravascular to the extravascular extracellular compartment, with the exception of the brain, retina, and testis. The rate at which this occurs is determined by a number of factors including the rate of tissue delivery, vessel surface area, and the permeability of these vessels, which will differ between pathologic and normal tissue. There is subsequent return of contrast agent from the extravascular-extracellular compartment back into the intravascular compartment; its excretion is usually via the kidneys. Typically, there is insignificant passage of contrast agent into the intracellular compartment (<1%).

The differences in contrast agent kinetics between pathologic and normal tissues or organs can be exploited to provide specific information on the functional vasculature. By assessing the dynamic changes in vessel and tissue or organ enhancement over time following intravenous administration of an iodinated contrast agent, both qualitative and quantitative parameters that inform on the function of the vasculature may be assessed (Fig. 32-2). Qualitative parameters refer to descriptors of the enhancement-time curves. These include curve shape, time to peak enhancement, peak enhancement, or area under the enhancement-time curve (Fig. 32-3). These parameters will be influenced by technical and patient factors including contrast agent dose, contrast agent rate of administration, and cardiac output. Quantitative parameters are derived from kinetic modeling of the enhancement-time curves and are more physiology based. These include regional blood flow, blood volume, and extraction fraction or permeability surface area product (Table 32.1).

In tumors, these parameters may be obtained in a relatively robust manner (day-to-day reproducibility: coefficient of variation <25%) and may provide relevant clinical information to the clinician and enable treatment effects on the tumor vasculature to be assessed.1 Regional blood flow, blood volume, and vascular leakage parameters within the tumor are interrelated and may vary with the underlying tumor environment. For example, (i) areas of high blood flow, blood volume, and leakage may reflect well-perfused areas with presence of shunting and areas of angiogenesis; (ii) areas of low blood flow, blood volume, and low leakage may represent areas of poor vascularization +/- necrosis; and (iii) areas of low blood flow, blood volume, and high leakage may represent poor perfusion regions with angiogenesis.


Biologic Correlates of Tumor Vascular Parameters

Tumor vascular parameters provide information regarding the delivery of oxygen and nutrients to the tumor, its functional “vascular density,” and the rate of leakage from the capillaries or neovessels. These parameters may provide a surrogate measure of tumor angiogenesis and perfusion-related hypoxia.


Morphologic Characteristics of the Tumor Vasculature

The development of a viable tumor blood supply is essential to support tumor growth and proliferation.2 This may occur through sprouting from preexisting vessels, de novo vascular formation through recruitment of circulating endothelial progenitor cells,
and vessel cooption. The tumor microenvironment including hypoxia, glucose deprivation, and low pH plays an important role in the initiation of tumor angiogenesis via the activation of oncogenes and/or inactivation of tumor suppressor genes.3


Figure 32-1. Distribution of contrast agent within the vascular bed of the organ of interest after intravenous administration.

In terms of morphology, the tumor vasculature appears functionally distinct and spatially heterogeneous. The vasculature lacks the usual hierarchical branching pattern and in general demonstrates greater vessel density at the tumor periphery. The vessels themselves are thin and tortuous, characterized by a relatively high endothelial cell proliferation rate, incomplete endothelium, relative absence of smooth muscle or pericyte investiture, and hyperpermeability resulting in high interstitial fluid pressure.


Immunohistochemistry Correlates of Perfusion CT Parameters

Microvessel density (MVD) and vascular endothelial growth factor (VEGF) are commonly used immunohistologic measures of angiogenesis. In a number of cancers including lung, renal, gastrointestinal, and pancreatic cancer, associations have been found between MVD and/or VEGF and various perfusion CT parameters. Most of the evidence relates to lung cancer. Typically, these correlations have been moderate: histologic analysis has been varied, based on different numbers of “hotspot” counts or from random areas of the whole tumor. There have also been negative studies, in part reflecting the heterogeneity of analyses and immunohistologic biomarkers used.4


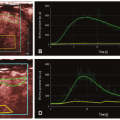
Figure 32-2. Qualitative assessment of enhancement-time curves. Type 1: Steady incremental enhancement; this pattern is usually seen in benign lesions. Type 2: Signal plateaus after a fast initial increase; this pattern may be seen in inflammatory lesions and some malignant tumors, for example, on treatment. Type 3: Fast initial enhancement followed by early washout; this pattern is typical of malignant tumors, due to increased microvessel density, hyperpermeability of the vasculature and arteriovenous shunting.


Figure 32-3. Enhancement-time curves for artery and tumor. The second arterial peak corresponds to the return of contrast agent from the extravascular-extracellular into the intravascular compartment.

With respect to the lung, peak CT enhancement in patients with solitary pulmonary nodules has been correlated significantly with both MVD and VEGF, irrespective of the benign or malignant nature of the nodules.5 In patients with operable non-small cell lung cancer CT peak enhancement, blood flow, blood volume or permeability surface area product have been shown to have a moderate correlation with MVD: Li et al. found that the CT regional blood flow correlated with CD34 expression (r = 0.715; p ≤ 0.001) assessed in six tumor regions: central (three regions) and peripheral (three regions).6 Ma et al. have shown that CT peak enhancement and regional blood flow correlate with CD34 expression assessed in five hotspots in VEGF-positive but not VEGF-negative tumors.7 Similarly, Sauter et al. have found a moderate correlation between extraction fraction and blood flow and CD34,8 while Spira et al. have reported a positive association between MVD and blood flow and volume.9 Peak enhancement, blood flow, and relative blood volume have also been shown to be significantly higher in VEGFpositive compared to VEGF-negative tumors.7,10

There have also been several pathologic correlative studies in abdominally sited cancers. In renal cell cancer an initial study in 24 patients showed a moderate correlation (r = 0.60) between peak enhancement and hotspot MVD (CD34).11 More recently, a further small study (n = 10) where patients with renal cell cancer underwent volumetric perfusion CT prior to surgery has confirmed that regional blood flow and blood volume correlated significantly with MVD (CD34; r = 0.600 to 0.829); however, extraction fraction (measured as the transfer constant, Ktrans) only demonstrated moderate correlations with MVD in nonnecrotic areas (r = 0.550).12

Moderate correlations (r = 0.42) between regional blood volume and hotspot MVD (CD34) have been found in gastric adenocarcinoma.13 Similarly in colorectal cancer, moderate correlations between regional blood volume and permeability surface area product and nonhotspot MVD (CD34) have been shown.14 In pancreatic adenocarcinoma, moderate correlations (r = 0.49) have also been found between MVD and peak enhancement in the arterial phase.15

Perfusion CT parameters may also inform on the presence of perfusion-related hypoxia. In lung cancer, blood volume measurements have been found to be negatively correlated to an exogenous marker of hypoxia (pimonidazole: r = -0.48).16
However, one of the challenges of clinicopathologic correlative studies is the comparison of in vivo with ex vivo findings. Tacelli et al. have showed that the areas of low regional tumor blood volume but high permeability have higher CD34 expression (assessed in three hotspots in the nonnecrotic tumor portion) than areas of high regional tumor blood volume and high permeability: 72.1 versus 47.9, p = 0.038.17 They postulated this difference could be related to the effect of the tumor microenvironment.17


TABLE 32.1 Definition of Vascular Parameters


Vascular Parameter


Definition


Regional blood flow (BF)


Flow rate of whole blood through the vasculature of a defined tissue volume or mass


Regional blood volume (BV)


Volume of flowing whole blood within the functioning vasculature of a defined tissue volume or mass


Mean transit time (MTT)


Average time for blood to travel between the arterial inflow and the venous outflow, measured in seconds


Extraction fraction (EF)


Fraction of the whole blood contrast agent that is transferred to the extravascular extracellular space during a single passage of the contrast agent


Permeability surface area product (PS)


Product of permeability and total surface area of capillary endothelium in a unit volume or mass of tissue (mL/min/100 mL) and reflects the total diffusional flux across the capillaries into the extravascular extracellular space


▪ Technical Aspects


Patient Preparation

Prior to the examination, patients should be well hydrated and have a normal renal function. For studies involving abdominal organs such as the liver, pancreas, and bowel, recent food intake may affect organ perfusion, and fasting prior to CT may be appropriate. If an oral contrast agent is required, water or a negative oral contrast agent is preferred to positive contrast agents. An antiperistaltic drug (e.g., glucagon or hyoscine-N-butylbromide) is advisable for studies of the bowel.

Keeping the patient well informed concerning the CT acquisition will improve the quality of the study. Clear instructions should be given, for example, regarding the need to stay still, breathing instructions for any breath-held studies, cessation of swallowing during the acquisition for head and neck studies, and warnings of the potential effects induced by the intravenously administered contrast agent including a hot flush.


Figure 32-4. Schema showing typical perfusion CT acquisition for tumor evaluation and suggested contrast agent injection rate.


Contrast Agent Administration

The dose and manner in which contrast agents are administered may influence parameter quantification. Kinetic modeling benefits from a bolus injection of contrast agent, at an injection rate of at least 4 mL/s via a large bore intravenous cannula, usually sited in the antecubital fossa. Injection rates beyond 10 mL/s appear to confer no additional benefit for quantification. The total injected iodine dose should be within the range of 12 to 18 g. It is important that the iodine concentration administered is not less than 300 mg/mL. Conversely, if iodine concentrations are greater than 350 mg/mL the contrast agent must be warmed to body temperature prior to injection, as the higher viscosity will slow the actual injection rate. The volume of contrast agent will depend on the iodine concentration used.1


CT Data Acquisition

With current state-of-the-art technology, an entire organ may be encompassed with a high spatial resolution and a high temporal acquisition sampling rate. To ensure accurate quantification, a sampling rate of 2 seconds or less should be used (Fig. 32-4).
For the initial perfusion phase, an acquisition duration of 45 seconds is adequate; for the interstitial phase at least five additional time points are recommended, the sampling rate ranging from 5 to 15 seconds depending on the kinetic model applied.1 As the concentration of iodine within blood vessels and tissues is proportional to the resultant increase in attenuation, temporal changes in attenuation can be analyzed using standard kinetic models without prior conversion to iodine concentration.


Motion Correction and Image Registration

For target areas located in motion susceptible sites, breath-holding during the first pass study will reduce motion artifact and voxel displacement. For longer-duration studies, motion correction/image registration may compensate for motion artifact, and this is incorporated into commercial software platforms, for example, based on a nonrigid deformable registration technique.18


Quantification of Vascular Parameters

The vascular parameters that can be quantified include regional blood flow, blood volume, and extraction fraction or permeability surface area product (Table 32.1). Different mathematical models may be applied to derive these. Commonly used tracer kinetic modeling includes “Maximum initial slope”, “Patlak” and “Distributed parameter analysis” (Table 32.2). In practice, quantification using commercial platforms requires a region of interest to be placed within an input artery (to generate an arterial input function [AIF]) and for the lesion(s) of interest. From the arterial and tissue enhancement-time curves that are displayed by the software, quantitative parametric maps are generated for each pixel (or voxel) representing a parameter value (Fig. 32-5). While volume-ofinterest analysis, encompassing the whole tumor, may be the least susceptible to observer error and experience, and provide a global evaluation of perfusion and angiogenesis, this may not best reflect the heterogeneity within a tumor, particularly if this demonstrates areas of necrosis, calcification or hemorrhage, as these are “averaged” in the process.19


What Is an Appropriate Target Lesion?

In practice, it is important to choose an appropriate target lesion(s). Ideally, this should be greater than 2 cm and not in close proximity to large vessels (e.g., superior vena cava or aorta), heart or diaphragm in order to reduce artifacts. For lesions located in motion susceptible sites, breath-holding techniques (+/- initial hyperventilation), and/or the use of motion correction/image registration will reduce motion artifacts. For target lesions located within the bowel, the use of a standard antiperistaltic (Buscopan or Glucagon) will reduce the motion related to peristalsis. It is also important to select an appropriate artery to derive the AIF. The vessel chosen must be of sufficient size to prevent partial volume averaging occurring secondarily due to pulsation or movement artifact (including peristalsis) or laminar flow within the vessel. If this is the case this will influence and change the arterial time-attenuation curve. It is assumed that the arterial time-attenuation curve of the artery in the field of view is identical to the vessel supplying the tumor. This is only valid if there is no significant stenosis of the artery or other major feeding vessels.


TABLE 32.2 Summary of the Commonly Applied Kinetic Models
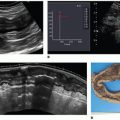


Kinetic Model


Compartments


Assumptions


Quantitative Parameter


Johnson-Wilson distributed parameter


Dual


Constrained input function


Regional blood flow, blood volume, permeability surface area product


Patlak


Dual


One-way transfer Well-mixed compartments


Extraction fraction, blood volume


Maximum slope


Single


No venous outflow


Regional blood flow


Clinical Applications

In oncologic practice, its main role remains the evaluation of the effectiveness of drugs that target the tumor vasculature, particularly in the context of clinical trials.23 However, by exploiting the differences in perfusion parameters between tumor and normal tissues, and reflecting perfusion and angiogenesis, perfusion CT may also assist lesion characterization, delineation of tumor extent, tumor phenotyping, and prognostication.


Response Assessment

Quantitative parameters derived from perfusion CT may be used to monitor the effects of a variety of treatments. These include chemotherapy with standard and novel agents (antiangiogenic drugs, vascular disrupting agents, and immunotherapy), radiotherapy, and interventional oncologic procedures such as embolization of the tumor vascular supply or radiofrequency ablation. Early evidence has shown that a common long-term effect of treatment is a reduction in perfusion CT parameters following treatment completion, although in the short-term there may be a variable vascular effect related to the therapeutic mechanism of action (Table 32.3).

With standard chemotherapy, which affects actively replicating cells via DNA damage or interruption of DNA repair, this effect is thought to reflect the loss of angiogenic cytokine support following cell death.52 With antiangiogenic therapies, differing vascular effects
may be seen depending on the mechanism of action of the drug under investigation and timing of the scan. An initial effect may be a decrease in vascular permeability and reduction in interstitial fluid pressure, with normalization of function of the vasculature resulting in a transient increase in tumor blood flow.53 In the longer term, with subsequent pruning of the vasculature, a reduction in regional blood flow, blood volume, and vascular permeability may be elicited (Fig. 32-6). With vascular disrupting agents, which target the proliferating immature vasculature +/- the mature vasculature a rapid shutdown in tumor vascularization may occur that is usually transient and reversible within 24 to 48 hours. This may be followed by a rebound revascularization.54 With radiotherapy, the acute effects are related to an initial inflammatory effect; the permeability is related to microvascular damage, which can lead to tumor shrinkage.55 With interventional procedures perfusion CT parameters may provide evidence of effective treatment or the need for further procedural attempts for optimal therapeutic effect.56

Only gold members can continue reading. Log In or Register to continue

Stay updated, free articles. Join our Telegram channel

Jul 8, 2020 | Posted by in ULTRASONOGRAPHY | Comments Off on Perfusion CT Imaging in Oncology

Full access? Get Clinical Tree

Get Clinical Tree app for offline access