Cardiac MRI perfusion, also known as stress CMR perfusion, is a clinical test performed on patients with chest pain who are known or suspected to have coronary artery disease to determine the myocardial perfusion status and the significance of coronary artery obstruction.
Guidelines increasingly require the proof of ischemia before revascularization.
CMR perfusion is increasingly used in imaging cardiology to test for inducible myocardial ischemia and has been well validated against other imaging modalities.
CMR first-pass perfusion provides high spatial resolution images of myocardial ischemia, allowing regional myocardial perfusion assessment and separate visualization of subendo- and subepicardial layers.
The absence of ionizing radiation and the noninvasive nature of the method make it the optimal clinical tool for repetitive evaluations of the patients during follow-up.
CMR first-pass perfusion is more sensitive than is dobutamine stress test in the detection of ischemia, as it is aimed toward the imaging of blood flow, which is first reduced in the progression of the ischemic cascade.
It is becoming increasingly established as a marker of prognosis in patients with coronary artery disease.
It is a noninvasive test, is generally regarded as a safe procedure, and is usually well tolerated by patients.
▪ Introduction
Myocardial perfusion imaging by first-pass contrast-enhanced cardiovascular magnetic resonance was introduced in 1990, when Atkinson et al. first used inversion recovery gradient-echo imaging after injection of a bolus of gadolinium-based contrast (Gd-DTPA) to observe contrast agent transit through the cardiac chambers and myocardium.1 Myocardial perfusion CMR was examined in animal experiments during pharmacologic vasodilation and showed a good correlation with microspheres for the assessment of blood flow.2,3 and 4 Early data from small studies showed that CMR can be a useful tool for the noninvasive assessment of myocardial perfusion reserve (MPR) and allows an accurate detection of significant myocardial ischemia when compared with x-ray coronary angiogram.5,6 The technique has ongoing rapid development along with experimental validation and clinical evaluation. Recently, it has been validated in different large single and multicenter clinical trials against nuclear myocardial perfusion imaging.7,8 and 9 Technical developments have also occurred in terms of gradient systems, field strength, radiofrequency coil arrays, pulse sequence design, contrast agents, and perfusion analysis methods.
With the advent and widespread availability of faster MRI scanners with very high spatial resolution (approximately 1 × 1 mm), CMR has become an established method for myocardial perfusion imaging. Compared with SPECT and PET, CMR perfusion offers the advantages of a noninvasive and radiation-free assessment, as well as higher spatial and temporal resolution images. In this chapter, we review the different CMR techniques used in myocardial perfusion imaging.
▪ Myocardial Perfusion Pathophysiology
Myocardial blood flow (MBF) is controlled, during rest and stress, by an autoregulation mechanism mainly through the vascular resistance of precapillary arterioles (<100 µm in diameter) and prearterioles (diameter is between 100 and 500 µm). This autoregulatory mechanism is able to maintain a stable blood flow even with change of the perfusion pressure under normal myocardial oxygen demand. However, there are many factors such as arterial hypertension, increased myocardial workload, increased heart rate (HR), and raised left ventricular (LV) wall stress that increment myocardial oxygen demand and thus lead to increased resting blood flow. Exercise is an example of a situation where myocardial oxygen demand increases due to increased cardiac workload induced by the tachycardia, increased contractility, and blood pressure (BP). The precapillary vascular resistance decreases, allowing the MBF to increase in proportion and in response to the increased myocardial oxygen demand.
In normal subjects, resting blood flow is in the range of 0.8 to 1.2 mL/g/min. MBF can increase up to threefolds with peak exercise. The term coronary flow reserve (CFR) indicates the capability to increase blood flow of the myocardium in response to maximal exercise. Flow reserve is the ratio of the MBF at peak stress, or maximal vasodilatation, to the flow at rest. In normal adults, the flow reserve ratio is usually 1.5 or higher.
MBF impairment is not uniform across the LV myocardial wall thickness. When arteriolar perfusion pressure is decreased, perfusion is reduced earlier in the subendocardial than in the subepicardial layers. The subendocardium is even more susceptible to reduced perfusion if there is a shortening of the diastolic relaxation phase, as with stress-related tachycardia or in case of diastolic dysfunction.
Flow-Mediated Vasodilatation
Release of vasodilators, such as nitric oxide, endothelium-derived relaxation factor, and prostacyclin, by the endothelial cells causes flow-mediated vasodilatation. Thus, the MBF increases to meet an increase in myocardial oxygen demand. Adenosine is a potent vasodilator of arterioles by stimulating the A2 adenosine receptors on arteriolar smooth muscle. It is formed in the myocytes by the degradation of adenine nucleotides via ATP utilization. Hence, adenosine infusion can produce a near-maximal vasodilatation of the myocardial microcirculation. The existence of significant flowlimiting coronary stenosis reduces the ability of coronary circulation to increase MBF to meet the increased workload.
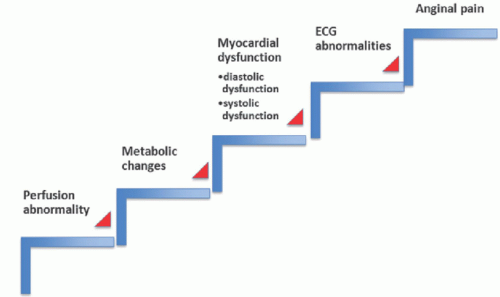
Maximal vasodilatation induced with adenosine can precipitate a reduction in MBF in the area supplied by a stenosed coronary artery with shunting of blood to the areas supplied by normal coronary arteries. Therefore, MBF decreases at peak stress or maximal vasodilatation in the affected segment. Resting blood flow is usually maintained at a normal level, even in segments supplied by stenotic arteries, due to the low resting myocardial oxygen demand, which can be met by the autoregulatory mechanism unless there is a severe flow-limiting stenosis. Therefore, an early decline of peak stress flow and CFR is often the first clue of early coronary artery disease. In other words, myocardial hypoperfusion is the first detectable event in the ischemic cascade (Fig. 19.1). Thus, perfusion evaluation is in principle the most sensitive test for ischemia, and flow quantification is a critical tool for characterization of patients at risk. In the absence of significant coronary artery disease, a reduction in CFR can reflect coronary microvascular dysfunction, which is often associated with systemic diseases like diabetes and hypertension. The main idea of CMR perfusion imaging is that the first myocardial passage of a contrast agent is visualized instantly every heartbeat. A vasodilator (e.g., adenosine, regadenoson, or dipyridamole) agent is used to induce myocardial hyperemia. With maximum hyperemia, wash-in of the contrast from the subepicardial layer to the subendocardial layer of the myocardium can be visualized and delineated with high sensitivity because of the high spatial resolution provided by CMR (Fig. 19.2). Detection of segments with hypoperfusion, where there is a delay and reduction in contrast wash-in means myocardial perfusion defect due to insufficient blood supply, as a result of coronary artery obstruction or microvascular dysfunction, to this segment. Currently, there are two main clinical indications of myocardial perfusion CMR, which are (a) detection of ischemia in patients who have chest pain and intermediate risk for coronary artery disease and (b) functional assessment of the significance of a stenosis in one or more of the coronary arteries that has been previously identified either by standard x-ray or by CT coronary angiography to determine the culprit lesions and guide revascularization either by angioplasty or by coronary bypass surgery.
▪ How to Perform a Dynamic Contrast-Enhanced First-Pass Myocardial Perfusion
Requirements
MRI safe infusion pump, MRI safe noninvasive brachial BP, pulse oximetry, and single-lead ECG (vectrocardiogram or VCG), one advanced life support (ALS)-trained physician on site, basic life support-trained radiographer(s), regular MRI evacuation training, three members of staff at the scanner in total (one ALS trained, all trained in scanner evacuation).
Monitoring and Safety
For stress testing, careful monitoring of patients in CMR setting is vital. A physician experienced in cardiac resuscitation (holding a valid ALS certificate) should be present for all examinations. To ensure prompt recognition of adverse symptoms, the patient must be able to continuously communicate with the operators (e.g., via intercom) to report symptoms. Monitoring includes continuous BP, HR, and rhythm monitoring (single-lead ECG) (Table 19.1). It is easiest if BP monitoring is performed manually because automated inflated cuff may obstruct the delivery of the contrast into the vein with extravasation. Therefore, if automated BP monitoring is turned on, this must be switched off prior to starting imaging and contrast delivery. Vasodilator agent is delivered via infusion pump as a continuous infusion (i.e., adenosine or dipyridamole) or as a single bolus (i.e., regadenoson). The vasodilator agent should be connected to the side with no BP cuff. Contrast tubing is connected to the side with BP cuff. It is important that staff are familiar with the pump settings and the adjoining tubing, to be able to prepare, prime, and deliver the agent as well as to stop the agent timely. Emergency resuscitation policy must be in place including defibrillator and drugs for emergency treatment including aminophylline. In the emergency trolley, a full set of emergency drugs (including drugs such as epinephrine, beta-blockers, atropine, bronchodilators, and antiarrhythmic drugs) should be available.
Figure 19-1. Ischemic cascade; myocardial hypoperfusion is the first detectable abnormality, followed by metabolic changes, then wall motion abnormality, then ECG changes, and finally chest pain.
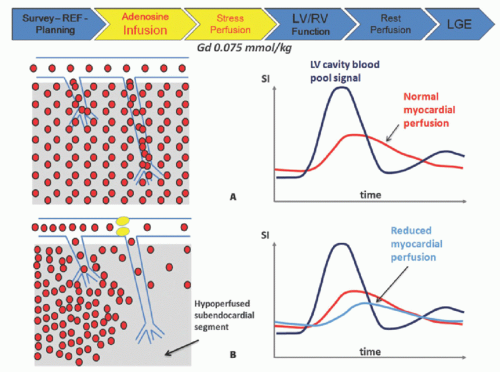
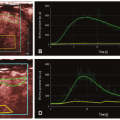
Figure 19-2. The extracellular contrast agent reaches the myocardium and passes in the extracellular space with an amount and rate that is proportional to blood flow. In normal conditions (A), a certain amount of contrast agent diffuses into the interstitium, giving a strong myocardial signal (Myo) occurring later than the increment of signal in the left ventricle (LV); when regional coronary blood flow is impaired (B), the amount and rate of wash-in of the contrast agent is reduced (upslope) and peak signal intensity is lower.
▪ Vasodilator Stress Agents
Adenosine (Most Commonly Used Vasodilator)
Concentration: Different concentrations are available (such as 1, 3, or 7 mg/mL) depending on the vendor and country.
Administration: Intravenous infusion
Dose: 140 to 210 µg/kg/min
Duration: Maximum of 6 minutes (see below for full protocol)
TABLE 19.1 Required Monitoring during Perfusion CMR
Heart rate and rhythm
Continuously
Blood pressure
Every minute
Symptoms
Continuously
Mode of Action: Adenosine is an endogenous nucleotide, causing vasodilation of most vascular beds, except for hepatic and renal arterioles. It exerts its pharmacologic effect through the activation of purine A1 and A2 cell surface adenosine receptors. Upon administration, a four to five fold hyperemia is seen in normal myocardial segments but not in regions subtended by obstructed coronary arteries. The differential perfusion changes are used to diagnose ischemic heart disease in the presence of significant coronary artery disease.
Dose: A single injection of 400 µg (5 mL) with no dose adjustment for body weight.
Duration: Rapid IV injection over 10 seconds using a 22-gauge or larger catheter or needle. Administer a 5 ML saline flush immediately after the injection of regadenoson. Administer the myocardial perfusion imaging contrast agent 10 to 20 seconds after the saline flush. The contrast may be injected directly into the same line as regadenoson (i.e., only one cannula can be inserted).
Mode of Action: Regadenoson is a selective A2 adenosine receptor agonist causing coronary vasodilator with a potential lower side effect profile than adenosine but with longer half-life.
Dipyridamole
Administration: Intravenous infusion
Dose: 0.56 mg/kg (142 µg/kg/min)
Duration: Over 4 minutes
Mode of Action: Dipyridamole is an indirect coronary artery vasodilator that increases the tissue levels of adenosine by preventing the intracellular reuptake and deamination of adenosine. Dipyridamole-induced hyperemia lasts for more than 15 minutes. Contraindications are similar to adenosine and more frequently requires aminophylline administration in adverse events.
As adenosine is the most commonly used vasodilator medication, the subsequent discussion focuses on this agent.
Asthma or severe chronic obstructive pulmonary disease requiring oral treatment or regular inhalers
High-grade atrioventricular block (greater than AV block grade II Mobitz I)
Sinus node dysfunction
Severe arterial hypertension (BP systolic >220 mm Hg, BP diastolic >120 mm Hg)
Severe arterial hypotension (BP systolic <90 mm Hg)
Cautious Use of Adenosine
Preexisting AV block or bundle branch block
Autonomic neuropathy
Severe aortic and mitral stenosis
Severe left ventricular outflow tract obstruction in hypertrophic cardiomyopathy
Severe carotid stenosis
Chronic obstructive pulmonary disease not requiring oral medication or regular inhaler therapy
Coexisting medication with beta-blockers, calcium antagonists, or cardiac glycosides (due to AV/sinus node depression)
Termination Criteria
Persistent or symptomatic II—III AV block
Symptomatic bradycardia
Significant drop in systolic BP (>20 mm Hg)
Persistent or symptomatic hypotension
Severe dyspnea or bronchospasm
▪ Common Side Effects Not Requiring Test Termination
Vasodilation: mild-to-moderate reduction in systolic, diastolic, and mean arterial BP (<10 mm Hg), increased HR (>100 bpm)
Stimulation of pain receptors: chest discomfort, neck flushing, and angina-like chest pain
Conduction system: transient first- and second-degree AV block (Wenckebach), sinus bradycardia (asymptomatic or HR > 45 bpm)
Dyspnea (common approximately 14% of patients)
▪ Adenosine Patient Preparation and Intervention Guide
It is important to inform patients about the steps of the test and that they need to hold breath when asked to do by the examiner and the possible side effects of the vasodilator agent and to report symptoms when they feel them. Also, it is important to notify patients before coming to the test that no food and drinks containing xanthines (tea, coffee, chocolate, and cola) may be consumed for at least 12 to 24 hours prior to the examination. Aminophylline, theophylline, and other xanthine medicines are competitive adenosine antagonists and should be avoided for 24 hours prior to the examination. Guide to intervention with adverse reactions (Table 19.2).
TABLE 19.2 Guide to Intervention with Adverse Reactions
Adverse reaction
Intervention
▪ Persistent or symptomatic II-III AV block
▪ Symptomatic bradycardia
▪ Significant drop in systolic BP (>20 mm Hg)
▪ Persistent or symptomatic hypotension
▪Severe dyspnea or bronchospasm or any other deemed significant
▪Stop infusion!
▪ High-flow oxygen
Persisting bradycardia
Bradycardia algorithm (ALS). Atropine 600 µg i.v. up to the total 1 mg. Consider admission for further monitoring.
Adenosine antidote: aminophylline 250-500 mg (5 mg/kg) i.v. injection 25 mg/mL slowly over 20 minutes under ECG monitoring—requires admission to intensive care unit
Persisting bronchospasm
Short-acting beta2 agonist via oxygen-driven nebulizer (salbutamol 5 mg). Consider hospital admission for further monitoring.
Adenosine antidote: aminophylline 250-500 mg (5 mg/kg) i.v. injection 25 mg/mL slowly over 20 min under ECG monitoring—requires admission to high care unit e.g., CCU
Dynamic contrast-enhanced first-pass perfusion is ideally acquired as dynamic series of images and displayed as a movie. It is a very challenging technical process to make this dynamic series of images demonstrating a motion-free cross section of cardiac muscle whose signal intensity rises and falls over time as the bolus of contrast agent passes through the myocardial tissue.
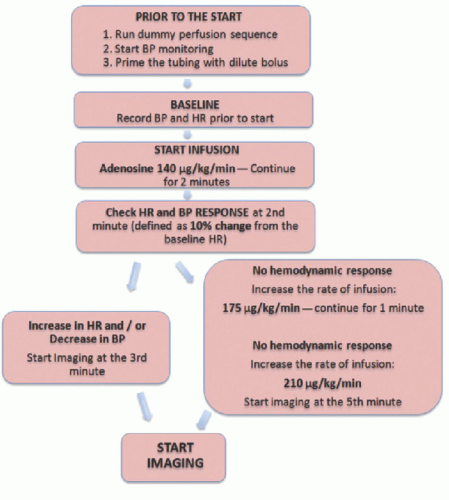
Standardized first-pass perfusion protocol has been proposed by the society of cardiac MRI (SCMR) as follows10 (Fig. 19.3):
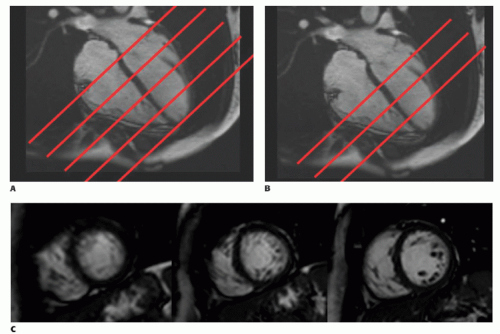
Scout imaging as per LV structure and function module aiming to plan a true short-axis (SA) view of the LV. For ischemia evaluation, data must be acquired for every heartbeat to visualize the flow of the contrast agent through the LV cavity and the myocardium. A minimum of three SA slices (apical, mid, and basal) should be acquired every heartbeat to ensure coverage of all except the most apical LV segment. Additional SA or long-axis slices may also be useful. The slice locations are timed to different points of time (i.e., phases) of the cardiac cycle, but each location is acquired repeatedly at the same phase. To obtain three SA, the four- and twochamber views are used. First, align five slices on the four- and twochamber views and adjust the slice gap so that the first slice is in the plane of the mitral valve and the last slice is at the apex. Then, remove the first and fifth slices by changing the number of slices from five to three. Slice thickness should be 8 mm, in-plane resolution ≤3 mm, and readout temporal resolution between 100 and 125 milliseconds or shorter as available (Fig. 19.4).
First-pass perfusion images must be T1 weighted in order to maximize the effect of the contrast agent on signal intensity. The fast (turbo-) gradient-echo and hybrid echo-planar imaging sequences described below employ small flip angles and very short time of repetition (TR), in order to reduce acquisition time, resulting in poor T1 contrast. While the balanced steady-state free precession sequence uses a higher flip, angle is weighted by the ratio of T2/T1. To overcome all of this, a preparation pulse is applied prior to the readout pulse sequence with an adequately long preparation pulse delay to establish a high T1 contrast prior to the readout sequence is employed.
How to Acquire T1-Weighted Images
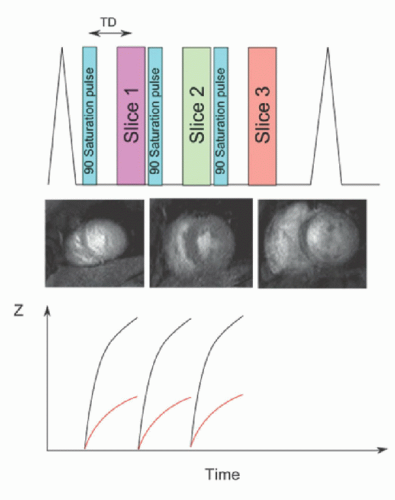
A 90-degree prepulse is used to null the magnetization signal and then wait for signal recovery (Fig. 19.5). Saturation recovery pulse sequence signal depends on the amount of the contrast agent; thus good perfusion leads to high concentration of contrast agent and rapid recovery of signal giving a bright image, while reduced perfusion leads to low concentration and slow recovery of signal giving a dark image (Fig. 19.6). In comparison to inversion recovery sequences that are used for late gadolinium enhancement, saturation recovery pulse sequences have the advantages that the contrast is independent of heartbeat variations during ECG-triggered image acquisition, and it has shorter scan time.
T1 weighting is dependent on accurate selection of the saturation time (TS). Generally, each imaging slice is preceded by a preparation pulse; thus the number of preparation pulses is equal to the number of slices in a given R-R interval. This acquisition scheme ensures a constant level of contrast in adjacent slices. In order to maximize T1 contrast for visualization of perfusion defects within the myocardium, longer saturation times should be used. A common TS for cardiac perfusion imaging is around 100 milliseconds for 1.5 T, and 120 milliseconds is commonly used at 3 T, but a wide range of values have been employed due to the following reasons: shorter TS values are desirable for quantitative perfusion imaging analysis as it reduces the nonlinearity in the relationship between contrast agent concentration and signal intensity (see later). Moreover, long TS values undertake long time of the R-R interval and restrict both coverage, by limiting the number of slices that can be acquired, and spatial resolution, by restricting the length of the data acquisition per slice. A single saturation prepulse followed by readout of multiple slices can also be used to increase the scan efficiency at the cost of varying levels of image contrast between different slices. This is the preferred solution on slow scanners and can also be used in tachycardiac patients. However, full quantification becomes impossible.
Figure 19-4. Illustrating planning of three SA slices. First, align five slices on the four-chamber view (A) and do the same in the two-chamber view (not shown). Ensure that the first slice is in the plane of the AV valves at end diastole and the last one is at the apex. Then, remove the first and the last slices by changing the number of slices from 5 to 3 (B). Slice thickness should be 8 mm with in-plane resolution ≤3 mm to obtain three SA slices optimum for running the perfusion sequence (C).
Figure 19-5. Perfusion sequences are usually generated with a 90-degree saturation pulse to produce the T1-weighted contrast.
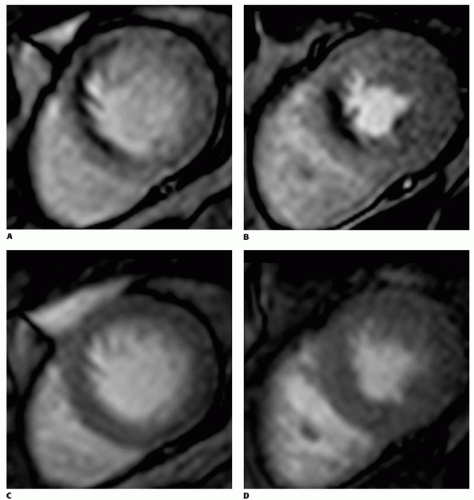
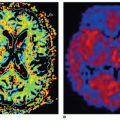
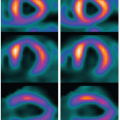
Figure 19-6. First-pass perfusion shows significant ischemic subendocardial perfusion defects appearing as dark area with no contrast in basal (A) and mid level (B) slices with stress, which that are not present at rest (C, D).
Different imaging readout can be used; gradient-echo-echo-planar imaging (GRE-EPI) hybrid, fast or (turbo-) gradient-echo (FGE), or balanced steady-state free precession (bSSFP) readout. These readout schemes can be associated with parallel acquisition techniques or image undersampling to speed up the acquisition (different RF pulse sequences will be discussed in more detail later in this chapter).
A test (dummy) perfusion sequence without contrast should be run prior to starting the adenosine infusion in order to detect the presence of artifact, move or increase field of view if indicated, and ensure patient compliance with breath-holding commands. Patients are asked to hold their breath in end expiration during the injection of contrast as long as they can and are allowed to take shallow breaths thereafter until the end of the scan, and finally, the adequacy of VCG triggering is tested.
Gadolinium-containing contrast agents are given in a dose between 0.025 and 0.1 mmol/kg (4 mL/s) according to the local protocol followed by at least 25 mL saline flush (4 mL/s). The paramagnetic effect of gadolinium causes a shortening in T1 relaxation time thus resulting in more brightening of myocardial tissue with adequate perfusion. Higher doses (e.g., 0.1 mmol/kg body weight) are preferred for visual assessment but can result in more severe signal saturation effects; lower doses (e.g., 0.025 mmol/kg body weight) are more suitable for quantitative and semiquantitative evaluation. Breath-hold starts during early phases of contrast infusion before contrast reaches the LV cavity. Image for 40 to 50 heartbeats by which time contrast has passed through the LV myocardium. Rest perfusion is performed with the same protocol used for stress perfusion using identical slices and similar sequence settings but without vasodilator agent a minimum 10 to 15 minutes after the adenosine stress perfusion in order to compare stress with rest images. If regadenoson or dipyridamole is used, it may take longer than 15 minutes in order to be able to acquire the rest images, because both agents have a longer half-life than that of adenosine.
Different Acquisition RF Pulse Sequence
In dynamic contrast-enhanced first-pass myocardial perfusion, the image brightness changes remarkably from frame to frame because of the passage of the contrast agent through the heart so the ordinary multishot k-space imaging that fills k-space over multiple cardiac cycles is not applicable. Hence, in order to acquire images quickly, a single-shot technique with an FGE, EPI and hybrid EPI, or bSSFP pulse sequences are generally used to perform perfusion imaging. All three sequences are fast, having a very short TR since they avoid the need to wait for the remaining transverse magnetization to decay after readout of the MR signal echo. Several k-t acceleration techniques have been also developed for improving spatial resolution and temporal resolution of perfusion imaging.
Fast (or Turbo) Spoiled Gradient Echo
Spoiled gradient-echo sequence repeats rapidly the low flip angle RF pulse used in conventional gradient-echo pulse sequence to generate several gradient echoes. In order to avoid the interference that may occur between the transverse magnetization generated by each RF pulse with the signal generated from the consequent TR, a spoiler gradient at the end of each TR period, or alternatively a technique called RF spoiling,11 is used to spoil this signal. Dynamic contrast-enhanced first-pass perfusion imaging requires fast imaging technique, so very short repetition time is used, for example, TR less than 10 milliseconds and time of echo (TE) less than 5 milliseconds, combined with a flip angle of around 30 degrees generating T1-weighted images.
Echo-Planar Imaging
EPI produces multiple gradient echoes following one RF pulse by changing the direction of frequency-encoding gradients quickly, generating an echo train. T2* decay throughout the echo train reduces the quality of images, relatively. Therefore, a hybrid EPI, also called segmented EPI, technique is typically employed in perfusion assessment where a number of shorter echo trains are obtained by applying multiple RF pulses. This reduces the harmful effect of T2* decay, enhancing the image quality while keeping the speeding advantage of the EPI technique.
Balanced Steady-State Free Precession
Compared to FGE, bSSFP gradient-echo sequence does not spoil the transverse magnetization, but instead, it reverses the signal dephased by the applied gradients by applying additional balancing gradients to rephase the MR signal before each subsequent RF pulse. After multiple repetitions, a steady-state condition arises, where the transverse magnetization from the successive repetitions accumulates to generate a much higher signal. The greater signal allows the use of higher receiver bandwidths, resulting in a shorter TE and TR compared to spoiled gradient-echo pulse sequences and therefore improved imaging efficiency. However, on the other hand, if the magnetic field is not homogenous, the transverse magnetization from several TRs can cancel each other rather than sum together in areas of magnetic field inhomogeneity, rendering the SSFP sequences susceptible to dark banding artifacts through the image.12 Therefore, it is very important to ensure that the magnetic field is as uniform as possible over the region of interest (ROI). This can be achieved by a dynamic shimming process, which uses the magnetic field gradients to correct for patient-induced field inhomogeneity. The dark-rim artifacts can also be avoided by using TR as short as possible.
Dynamic contrast-enhanced first-pass perfusion requires very fast pulse sequence in order to acquire high spatial and temporal resolution, with optimum volume coverage, and high signal-tonoise ratio (SNR). Breath-holds required during perfusion test are relatively long and can be challenging for patients with heart failure or other breathing problems. Thus, several new acceleration techniques have been developed to overcome this problem.
k-t Acceleration Techniques
The raw data acquired from the scanner is typically plotted in a domain known as k-space and is converted mathematically to the final image by Fourier transformation. The central region of k-space defines the contrast in the image while the outer region of k-space defines the edges and structure boundaries (i.e., the high spatial frequencies).13
The most common k-space sampling trajectories are Cartesian, which means each data point is located in a Cartesian grid, with each echo filling an entire phase-encoded line. k-Space sampling can also have non-Cartesian trajectories, with the most common being spiral or radial. These facts have been exploited in different approaches aiming to reducing the scanning time as follows:
▪ Parallel Imaging Approaches
To accelerate perfusion imaging and improve spatial resolution, parallel imaging approaches such as sensitivity encoding (SENSE) are used.14,15 Parallel imaging depends on the spatial difference of radiofrequency coil sensitivities to fill the k-space and accelerate the image reconstruction process. Nevertheless, practically, this is limited to twofold acceleration due to associated artifact and noise drawback.16 Another parallel k-t acceleration technique, known as kt-BLAST factor 5, with 11 training profiles has been shown to provide greater acceleration than SENSE and have been proposed more recently as a useful technique to improve the spatial resolution of perfusion imaging even further while preserving temporal resolution and cardiac coverage.17
▪ Radial and Spiral Sequences Perfusion (SPIRIT) Approaches
Recently, novel techniques have been proposed for rapid acquisition of data. The main idea is to collect data in the k-space in radial spokes or spiral approach rather than the Cartesian approaches. A multislice “real-time” ungated data acquisition method is an example of the radial pulse sequence and has been proposed by Harrison et al.18 The advantage of this method is the fast acquisition of data providing a number of perfusion images adequate for diagnosis without using ECG gating signals and during free breathing. Therefore, it can be potentially used in patients who have arrhythmias, have difficulties of gating, or are unable to perform adequate breath holding. In this method, a saturation recovery radial turboFLASH sequence is used, and 20 or 24 radial k-space radial rays in four subsets of five to six rays each are obtained for each slice. Four to five slices, according to the number of rays used, can be acquired after a single saturation pulse and a 40-millisecond delay. Each image is acquired in a few milliseconds (40 to 60 milliseconds) and is repeated continuously, roughly four times per second without gating and during free breathing. This means that each slice is acquired at different cardiac phases in every heartbeat. Image reconstruction from undersampled radial k-space data occurs by repetitive compressed sensing tool via spatial and temporal total variation constraints.19 A retrospective image-based gating method is used, which is similar to a regional sum method applied to self-gate cardiac cine data.20 Therefore, after reconstruction, the ungated images can be processed to self-gate into systole and diastole image sets. Subsequently, deformable image registration is used to correct for cardiac and respiratory motion remaining in systolic and diastolic images.21 In comparison to conventional ECG-gated perfusion techniques, this method is efficient in terms of providing maximal information quickly enough for dynamic contrast-enhanced first-pass perfusion imaging; however, it has been assessed over a small number of patients, and larger trials on patients with ischemic heart disease are required to validate this technique for CMR perfusion. Linogram and PROPELLER are variable methods of radial acquisition. The explanation of these methods falls outside the scope of this chapter, but the interested reader is referred to the respective bibliographical references.22,23
Spiral k-space scanning is another fast data acquisition technique that allows a substantial speed of perfusion imaging compared to conventional techniques. In a spiral acquisition, each k-space line follows a spiral trajectory with variable number of interleaves (Fig. 19.7); this is valuable in terms of achieving more coverage of k-space with fewer shots than Cartesian. Spiral acquisition fills a circular area of k-space and neglects the corners of k-space, which are collected with a Cartesian acquisition. Simply, the technique consists of defining the required number of interleaves, sampling time, number of points per trajectory, nominal field of view, maximum gradient and slew rate parameters, and a function w(t) describing the relative density as a function of time where (one corresponds to Nyquist sampling density) to determine the desired k-space trajectory. The details of this technique fall outside the scope of this chapter, but the interested reader is referred to the respective bibliographical references.24,25 It is thought that spiral pulse sequences produce high-quality first-pass perfusion images with minimal dark-rim and off-resonance artifacts, high SNR and contrast-to-noise ratio (CNR), and good delineation of resting perfusion abnormalities.26
Only gold members can continue reading. Log In or Register to continue
 Vascular Anatomy and Microanatomy
 CT and MR Contrast-Enhanced Tissue Perfusion Imaging: Basic Methodology, Postprocessing, Reliability Testing
 Clinical Applications of ASL Brain Perfusion Imaging
 Myocardial Perfusion Imaging with PET/SPECT: Techniques and Clinical Applications
 Ultrasound Perfusion Imaging: Techniques and Analytical Methods
 Contrast-Enhanced Ultrasound: Clinical Applications


