(1)
Department of Biology, University of Utah, Salt Lake City, UT, USA
(2)
Howard Hughes Medical Institute, University of Utah, Salt Lake City, UT, USA
(3)
Leibniz-Institut für Molekulare Pharmakologie im Forschungsverbund, Berlin, Germany
(4)
Janelia Farm Research Campus, Howard Hughes Medical Institute, Ashburn, VA, USA
(5)
Neuroscience Research Centre, Universitätsmedizin Berlin, Berlin, Germany
(6)
School of Medicine and Biology, St. Andrew University, Scotland, UK
Abstract
Nano-resolution fluorescence electron microscopy (nano-fEM) pinpoints the location of individual proteins in electron micrographs. Plastic sections are first imaged using a super-resolution fluorescence microscope and then imaged on an electron microscope. The two images are superimposed to correlate the position of labeled proteins relative to subcellular structures. Here, we describe the method in detail and present five technical advancements: the use of uranyl acetate during the freeze-substitution to enhance the contrast of tissues and reduce the loss of fluorescence, the use of ground-state depletion instead of photoactivation for temporal control of fluorescence, the use of organic fluorophores instead of fluorescent proteins to obtain brighter fluorescence signals, the use of tissue culture cells to broaden the utility of the method, and the use of a transmission electron microscope to achieve sharper images of ultrastructure.
Key words
Nano-fEMProtein localizationCorrelative light and electron microscopyFluorescence electron microscopySuper-resolution fluorescence microscopyFluorescence nanoscopyPhotoactivated localization microscopy (PALM)Ground-state depletion and single-molecule return (GSDIM)Stochastic optical reconstruction microscopy (STORM)Direct stochastic optical reconstruction microscopy (dSTORM)1 Introduction
Proteins play essential roles in cellular functions; to fully understand their roles, we must know where they are localized relative to subcellular structures. Previously, there have been two methods for localizing proteins to subcellular structures: immuno-electron microscopy and fluorescence microscopy. Immuno-electron microscopy localizes proteins at an ultrastructural level using gold-labeled antibodies [1–5]. However, it has many drawbacks, including a reliance on antibodies that can work on plastic sections, poor survival of epitopes, poor preservation of morphology, high nonspecific background, and a spatial displacement of up to 38 nm (the molecular length of two antibodies) [1, 2, 6]. Moreover, only a minority of the proteins are labeled due to the inaccessibility of antigens in the plastic.
Fluorescence microscopy, on the other hand, has become the method of choice for protein localization. In particular, genetic tagging of proteins with green fluorescent protein (GFP) [7–9] is very useful because every protein is labeled and can be imaged in living cells. However, two drawbacks limit its ability to locate proteins in a cell: resolution and cellular context. The light from a fluorescent protein can be only focused to a 450 nm spot on a camera. If there were only two proteins in an image, they could theoretically be distinguished if they were separated by greater than 250 nm, but typically many proteins are labeled and the image is really no more than an incoherent micron-sized ghost at high magnification. Thus, the diffraction limit means that proteins, typically on the order of 4 nm in diameter (the diameter of GFP), cannot be associated with cellular organelles, which are on the order of 40 nm in diameter (such as synaptic vesicles or Golgi cisternae). In the last few years, several super-resolution techniques have been developed that can resolve fluorescence at resolutions below the diffraction limit [10–16]. Single-molecule-based techniques include photoactivated localization microscopy (PALM) [10], fluorescence photoactivation localization microscopy (fPALM) [11], stochastic optical reconstruction microscopy (STORM) [13], direct stochastic optical reconstruction microscopy (dSTORM) [14], and ground-state depletion microscopy followed by individual molecule return (GSDIM) [12]. Despite the variations in acronyms, these techniques overcome the diffraction barrier by imaging single molecules one at a time [17]. The location of individual molecules is then calculated and mapped to reconstruct an image. In this chapter, we will use the terms PALM, for imaging individual fluorescent proteins, and dSTORM, for imaging organic fluorophores using ground-state depletion (see Note 1). These imaging techniques break the diffraction limit of conventional fluorescence microscopy and can localize a protein with a precision of 10 nm standard error of the mean (SEM) [18, 19] (see Note 2).
The second drawback with fluorescence microscopy is that it lacks cellular context. A precisely localized pinpoint of fluorescence in a black background is not useful. Combining these new subdiffraction fluorescence methods with electron microscopy merges the protein localization advantages of fluorescence microscopy with the structural definition of electron microscopy [20].
To localize GFP in ultrathin sections, one must maintain GFP fluorescence during the harsh osmium fixation steps, the dehydration steps, and the incubation and polymerization in acidic resins. Recently, we developed a method to preserve fluorescence by reducing fixative concentrations, maintaining hydration, and compromising on ideal polymerization conditions [20]. In short, transgenic worms expressing proteins tagged with fluorescent proteins are subject to high-pressure freezing and freeze-substitution. These animals are embedded into glycol methacrylate resin at −20 °C. Ultrathin sections are cut using a microtome and collected onto pre-cleaned cover glasses. These sections are first imaged on a super-resolution light microscope and then post-stained with uranyl acetate and imaged using backscattered electrons on a scanning electron microscope (SEM). Using this approach, we successfully localized histones, mitochondrial membrane proteins, and liprin-alpha to their proper organelles in a cell [20]. However, several improvements can be implemented to increase the sensitivity and the utility of our methods.
There are five problems associated with the original protocol we published. First, ~40 % of fluorescent proteins were lost during the fixation. Second, photoactivatable fluorescent proteins suitable for PALM imaging are not ideal. EosFP and its variants are the most reliable fluorophores for PALM. However, they emit green fluorescence before photo-conversion and red fluorescence after photo-conversion, covering two large spectra of visible light. Thus, multicolor imaging is extremely difficult. Third, the number of photons collected from each EosFP molecule before bleaching is very low (~300), reducing the calculated precision of the protein location by the computer. Fourth, the protocol was originally developed using the nematode Caenorhabditis elegans, optimal conditions for other biological samples such as cultured cells were not known. Fifth, despite the well-preserved morphology, the resolution of images generated by collecting backscattered electrons in a scanning electron microscope is limited by the size of the electron beam scanning the sample and leads to blurry images at high magnification (see Fig. 1a, c).
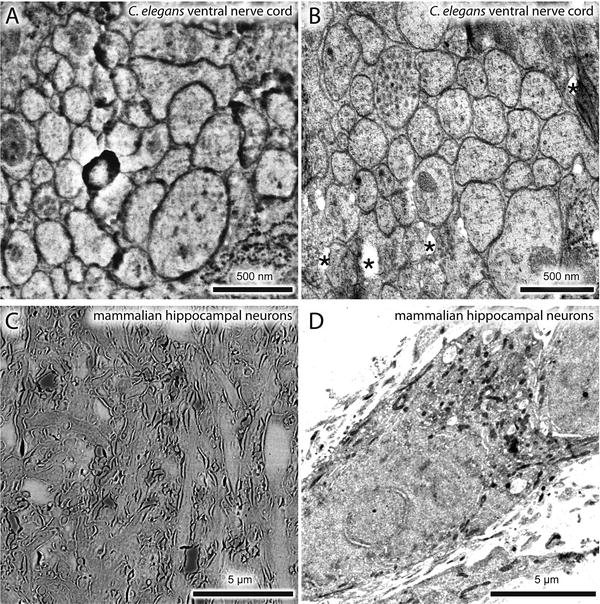
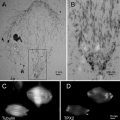
Fig. 1
Comparisons between SEM and TEM images. A nematode expressing a fluorescently labeled transgene was processed for nano-fEM, and the adjacent sections were imaged using SEM (a) and TEM (b). Mouse hippocampal neurons were labeled with Alexa-647 transferrin. Labeled transferrin binds transferrin receptors and is endocytosed. Cells were processed for nano-fEM and imaged using SEM (c) and TEM (d). The subcellular details are clearly visible in the TEM images. Asterisk indicates holes in a section created during sectioning due to incomplete infiltration or polymerization of the GMA resin. For the complete list of artifacts observed with GMA plastic, please refer to Watanabe and Jorgensen [21]
Therefore, since the original publication, we have improved our methods to solve these five problems. First, we fine-tuned our protocol to preserve up to 90 % of the fluorescence without compromising the fixation quality [21]. Second, to overcome the paucity of suitable fluorescent proteins with PALM imaging and demonstrate the potential for the method to localize multiple proteins at a time, we imaged the fluorescent protein, citrine, that is not photoactivatable or photoconvertible using a ground-state depletion scheme [21]. Third, we labeled with an organic fluorophore, Alexa-647, capable of generating many more photons and hence higher precision, and imaged using a dSTORM scheme although this approach is not quantitative (see Note 3 and Fig. 2a, b). Fourth, we demonstrated that this method could be readily applied to specimens other than C. elegans using the protocol (see Fig. 2). Fifth, we developed a method to image using a transmission electron microscopy to provide higher-resolution details of ultrastructure (see Figs. 1 and 2). Here, we describe the improved protocol in detail.
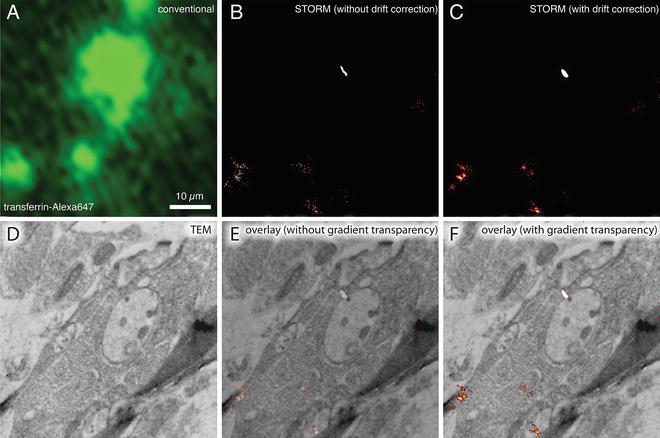
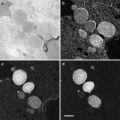
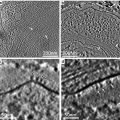
Fig. 2
dSTORM images of plastic sections of cultured mouse primary hippocampal cells with fluorescently labeled transferrin. Wide-field fluorescence image (a), dSTORM image without drift correction (b), dSTORM image with drift correction (c), and TEM image (d) from the same GMA thin section (50 nm) of cell cultures incubated with Alexa647-labeled transferrin. The sample drift during imaging was corrected based on the positions of TetraSpeck beads in the first image of the acquired series. (e, f) Correlative dSTORM—TEM image showing transferrin localization. The transparency was applied to the whole STORM image in (e), whereas the transparency was applied only to the background black pixels in the STORM image in (f). Note that the STORM signal intensity is not compromised using a gradient transparency in (f). The section was incubated in imaging buffer containing oxygen scavengers and imaged using a fluorescence microscope equipped with an EMCCD camera and appropriate laser lines and filter sets. For the dSTORM image, a total of 10,000 frames (30 ms/frame) were collected and processed using ImageJ with the QuickPALM plug-in [27]
2 Materials
2.1 High-Pressure Freezing for C. elegans
2.
Specimen carriers type A (Technotrade International, Manchester, NH).
3.
Specimen carriers type B (Technotrade International, Manchester, NH).
4.
Hexadecene (Sigma-Aldrich, St. Louis, MO).
5.
Forceps.
6.
Paintbrush #00.
7.
Whatman filter paper.
8.
Liquid nitrogen (160 l).
2.2 High-Pressure Freezing for Cell Cultures
2.
Sapphire disks (6 mm diameter, Wohlwend GmbH, Sennwald, Switzerland).
3.
Specimen carriers type A (6 mm diameter, Leica Microsystems, Wetzlar, Germany).
4.
Culture media: DMEM medium (90 % DMEM, 10 % FCS, 10 μg/ml penicillin, and 1 μg/ml streptomycin), FUDR stock solution (19.94 mg 5-fluoro-2’-deoxyuridine, 49.82 mg uridine, and 10 ml DMEM), and NBA medium (97 % NBA, 2 % B27, 1 % Glutamax, 10 μg/ml penicillin, and 1 μg/ml streptomycin).
5.
Recording media: BASE + (140 mM NaCl, 2.4 mM KCl, 10 mM HEPES, 10 mM glucose, 2 mM CaCl2, 4 mM MgCl2; pH adjusted to 7.5–7.6; osmolarity adjusted to ~300 mOsm).
6.
Transferrin from human serum, Alexa Fluor 647 Conjugate (Invitrogen, Grand Island, NY).
7.
Sapphire disk holder middle plate (6 mm diameter, Leica Microsystems, Wetzlar, Germany).
8.
Sample holder half cylinder (6 mm diameter, Leica Microsystems, Wetzlar, Germany).
9.
Forceps (insulated).
10.
Ethanol (absolute).
11.
Liquid nitrogen.
12.
Whatman filter paper.
2.3 Freeze-Substitution
1.
Automated freeze-substitution unit (AFS 2, Leica Microsystems, Wetzlar, Germany).
2.
Cryovials.
3.
50 ml screw cap conical tubes.
4.
15 ml screw cap conical tubes.
5.
Acetone (glass distilled, Electron Microscopy Sciences, Hatfield, PA).
6.
Ethanol (absolute).
7.
Osmium tetroxide (crystals, 1/10 g, Electron Microscopy Sciences, Hatfield, PA).
8.
Potassium permanganate (Electron Microscopy Sciences, Hatfield, PA).
10.
Disposable transfer pipette (7.5 ml).
11.
Disposable transfer pipette (1.5 ml).
12.
Disposable Pasteur pipette (borosilicate glass).
13.
Pipetman and tips (P1000, P200, P20).
2.4 Plastic Embedding
1.
Glycol methacrylate kit (GMA, 2-hydroxyethyl methacrylate, low acid and TEM grade, SPI, West Chester, PA).
2.
N,N-Dimethyl-p-toluidine (EMD Chemicals, Philadelphia, PA).
3.
Scintillation vials with screw caps (20 ml, Electron Microscopy Sciences, Hatfield, PA).
4.
ACLAR film (Electron Microscopy Sciences, Hatfield, PA).
6.
3/8” disk punches (Ted Pella Inc., Redding, CA).
7.
25 ml serological pipette.
8.
10 ml serological pipette.
9.
Petri dish (35 mm × 10 mm).
2.5 Cover Glass Cleaning
1.
Cover glass (#1.5, round, Warner Instruments, Hamden, CT).
2.
Sulfuric acid.
3.
Hydrogen peroxide.
4.
Cover glass rack (Teflon; Invitrogen, Grand Island, NY).
5.
Sonicator.
6.
Glass beaker (500 ml).
2.6 Cover Glass Coating
2.
Pioloform (Ted Pella Inc., Redding, CA).
3.
Chloroform.
4.
Wax.
2.7 Sectioning
1.
Ultramicrotome (UC6, Leica Microsystems, Wetzlar, Germany).
2.
Diamond knife (ultra jumbo, 45°, 4.0 mm; DiATOME, Hatfield, PA).
3.
Glass strips (Ted Pella Inc., Redding, CA).
4.
Glass knife boats (Ted Pella Inc., Redding, CA).
5.
Nail polish (clear).
6.
Perfect loop (Electron Microscopy Sciences, Hatfield, PA).
7.
Hair tool for manipulation of plastic sections.
8.
Razor blade (double edge; Electron Microscopy Sciences, Hatfield, PA).
9.
High-profile microtome blades (Leica Microsystems, Wetzlar, Germany).
2.8 PALM Imaging
2.
Gold nanoparticles (call for 2× concentrated solution; Microspheres-Nanospheres Inc., Cold Spring, NY).
3.
Canned air.
4.
Attofluor cell chamber for microscopy (Invitrogen, Grand Island, NY).
2.9 Cover Glass Mounting for dSTORM Imaging
1.
Twinsil (two-component silicone glue, Picodent, Wipperfürth, Germany).
2.
Concave blank microscope slides (Celestron, Torrance, CA).
3.
Imaging buffer (50 mM Tris (pH 8.0), 10 mM NaCl, 0.5 mg/ml glucose oxidase, 40 μg/ml catalase, 10 % (w/v) glucose, and 10 mM MEA).
2.10 dSTORM Imaging
2.
TetraSpeck fluorescent microspheres (0.1-μm diameter, Invitrogen, Grand Island, NY).
2.11 Staining
1.
Uranyl acetate (Polysciences, Warrington, PA).
2.
Syringe (10 ml).
3.
Syringe filter (0.22 μm; Millipore, Billerica, MA).
2.12 Retrieval of Sections from Cover Glass
1.
Hydrofluoric acid (Sigma-Aldrich, St. Louis, MO).
2.
Parafilm.
2.13 SEM Imaging
2.
Backscattered electron detector (vCD, FEI, Hillsboro, OR).
3.
Carbon fiber cord (Electron Microscopy Sciences, Hatfield, PA).
4.
Carbon sputter device (SCD005, Baltec).
5.
SEM pin stub (Ted Pella Inc., Redding, CA).
6.
Carbon conductive tape (double coated; Ted Pella Inc., Redding, CA).
2.14 Image Alignment
1.
Photoshop (CS6, Adobe, San Jose, CA).
3 Methods
3.1 Preparing Sapphire Disks for Culturing Cells
1.
Wash the disks in ethanol (absolute) and let them dry in air.
2.
3.
To keep a track of the carbon-coated surface during the subsequent manipulation, mark the carbon-coated surface by scratching out an asymmetrical letter such as “F” or “G” [24]. If finding particular cells (e.g., fluorescence-positive cells) is required, a finder grid (Leica Microsystems) can be placed on top of the sapphire disk to generate a specific pattern on the surface when carbon coating (see Fig. 3a, b).
Fig. 3
Preparing cell cultures for high-pressure freezing. (a) 6 mm-diameter sapphire disks are rinsed in ethanol before use. (b) A carbon-coated sapphire disk with a finder grid pattern. A finder grid was placed on top of a sapphire disk before carbon coating. (c) Mouse hippocampal neurons cultured on a coated sapphire disk after the treatment with poly-l-lysine. Cells can grow as well on sapphire disks as on a cover glass. (d) A middle plate for the HPM100 that can hold a sapphire disk. (e) A sapphire disk mounted directly in the plate. Note that the countersink holds the sapphire disk in place. (f) A type A specimen carrier, overfilled with culture media, placed on top of the sapphire disk. Make sure there are no air bubbles trapped in the chamber of the specimen carrier. (g) A sample holder ready for freezing
4.
Bake the disks in an oven (120 °C) overnight.
5.
Place sapphire disks into a 12-well culture plate (we typically place two in each well), apply poly-l-lysine for 5 min, and let it dry for 1 h.
6.
Apply ultraviolet light for 20 min.
3.2 Transferrin-647 Uptake
1.
To prepare transferrin conjugates, we followed a protocol provided by Invitrogen (http://tools.invitrogen.com/content/sfs/manuals/mp02871.pdf). In short, we mixed 5 mg transferrin-647 with 1 ml deionized water.
2.
Dilute the transferrin-647 solution to 5 ng/ml by adding 1 μl of the solution into 1 ml of recording media (BASE +).
3.
Apply the diluted solution to cell cultures for 2 h.
4.
 Microwave-Assisted Processing and Embedding for Transmission Electron Microscopy
 Electron Microscopy of Microtubule Cytoskeleton Assembly In Vitro
 Biological Applications of Energy-Filtered TEM
 Biological Applications of Phase-Contrast Electron Microscopy
 Correlative Light and Electron Microscopy Using Immunolabeled Sections
 X-Ray Microanalysis in the Scanning Electron Microscope


Wash cells with recording media several times.
Related posts:
Microwave-Assisted Processing and Embedding for Transmission Electron Microscopy
Electron Microscopy of Microtubule Cytoskeleton Assembly In Vitro
Biological Applications of Energy-Filtered TEM
Biological Applications of Phase-Contrast Electron Microscopy
Correlative Light and Electron Microscopy Using Immunolabeled Sections
Stay updated, free articles. Join our Telegram channel
Full access? Get Clinical Tree
