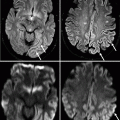
Fig. 22.1
MRI of a 69-year-old man shows an ill-defined heterogeneous lesion with minimal mass effect in the right frontoparietal region. This is predominantly hyperintense on FLAIR- (a) and T2-weighted axial images (b). Note the paucity of perilesional edema considering the size of the mass. No evidence of hyperintensity on diffusion-weighted imaging (c). Color-coded fractional anisotropy map overlaid on ADC (d) shows displacement and disruption of the intervening white matter tracts. The lesion appears hypointense on pre-contrast T1 (e) and enhances minimally on post-contrast T1-weighted image (f). Perfusion maps show no significant increase in CBV (g) or CBF (h). Elevated choline with reduced N-acetyl aspartate (NAA) is seen on proton MR spectroscopy from the lesion (i). Histology confirmed a grade II astrocytoma
Diffusion tensor MRI has been proposed as a method for delineation of glioma margins and regions of tumor infiltration (Sinha et al. 2002; Price et al. 2006). Changes in fractional anisotropy in gliomas have been correlated with the histologically determined degree of tumor cell infiltration (Stadlbauer et al. 2006).
Perfusion-Weighted Imaging
Perfusion-weighted imaging encompasses both dynamic susceptibility contrast and dynamic contrast-enhanced MRI. In brain tumors, the former is conventionally used to measure cerebral blood volume (CBV) and the later to measure both CBV and vascular permeability. The regional CBV has been the most widely used parameter and has been shown to correlate significantly with glioma grade (Quarles et al. 2005; Law et al. 2004; Schmainda et al. 2004; Shin et al. 2002) and with tumor total choline (Wu et al. 2002), glucose uptake, and tumor angiogenesis (Aronen et al. 2000). In addition, regional CBV may help to differentiate primary CNS lymphoma and glioblastoma multiforme (GBM) (Hartmann et al. 2003), and certain metastases from high-grade astrocytoma (Kremer et al. 2003; Cha et al. 2007) aid in the differentiation of posttreatment changes from tumor recurrence (Siegal et al. 1997; Cha et al. 2000) and predict early local recurrence or malignant transformation (Fuss et al. 2001). The regional CBV has also been proposed as a guide for stereotactic biopsy of the portions of glioma most likely to yield the highest grade (Sadeghi et al. 2007). Its thresholds have been proposed for distinguishing low-grade from high-grade gliomas and predicting which low-grade lesions may have a propensity for malignant transformation (Law et al. 2006). The K trans value is a putative measure of vascular permeability to contrast agent and correlates with glioma grade (Fig. 22.2) (Provenzale et al. 2002; Roberts et al. 2000). A direct relationship has been shown between K trans and length of survival in high-grade gliomas (Mills et al. 2006). Moreover, substantial changes in K trans have been documented in high-grade glioma soon after initiation of antiangiogenic chemotherapy, well before any notable change in tumor volume, or changes in CBV, suggesting that this tool may serve as an imaging biomarker for therapeutic response to angiogenesis inhibitors (Batchelor et al. 2007).
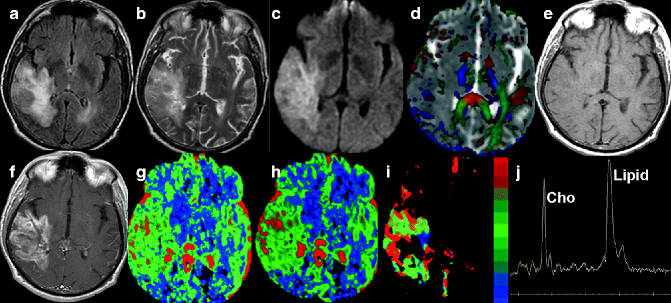

Fig. 22.2
MRI of a 75-year-old patient. Axial FLAIR- (a) and T2-weighted (b) images show a heterogeneous mass lesion with irregular margins in the right temporal lobe. Areas of hyperintensity on diffusion-weighted imaging (c) with low ADC (c) in the corresponding area are seen in the tumor, suggestive of increased cellularity. Color-coded fractional anisotropy map overlaid on ADC map (d) shows the infiltrative nature of this lesion with interruption of adjacent white matter tracts. This mass is isointense on pre-contrast T1-weighted axial image (e) and shows enhancement on post-contrast T1-weighted axial image (f). Perfusion maps show a marked increase in CBV (g), CBF (h), and K trans (i) values. Proton MR spectroscopy from the lesion shows elevated choline and lipid (j). Histology confirmed this lesion as GBM
MR Spectroscopy
MR spectroscopy provides a metabolite profile of normal as well as the pathological tissue. The most commonly analyzed metabolites with respect to tumors include N-acetyl aspartate (NAA), a neuronal marker; phosphocreatine/creatine, a marker for relative metabolic activity; and choline, a marker of cell density and cellular proliferation. Another important resonance is lactate, which can be seen in regions of tissue necrosis and tissue hypoxia. When choline resonance predominates, especially when the choline-to-NAA ratio exceeds 2:1, the spectral signature suggests cellular proliferation, as can be seen in tumors (Howe et al. 2003); suppression of all key metabolite spectral peaks, with or without presence of lactate, suggests tissue necrosis (Pivawer et al. 2007). Myoinositol (MI) levels may also correlate with glioma grade, with a trend toward lower MI levels in the presence of high-grade gliomas than in low-grade astrocytomas (Castillo et al. 2000).
22.4 Classification
Tumor classification is an inexact science because of the incomplete understanding of tumor histology, molecular genetics, and sometimes even clinical features. Current classifications thus are derived historically on the basis of suspected cell lineage, stage of cytogenesis (e.g., primitive or “-blastic” and differentiated or “-cytic”), and degree of dedifferentiation or anaplasia (often graded from I, well differentiated, to IV, highly malignant). Tumor phenotypes based on morphologic appearance, now established by MRI, and clinical presentation contribute further to classification. Most clinicians now use a blend of the Kernohan and World Health Organization (WHO) systems (Kleihues et al. 1993; WHO 1990). The gliomas—astrocytomas, oligodendrogliomas, and ependymomas—comprise nearly half of all intracranial tumors, and almost half of gliomas are GBM.
22.4.1 Primary Neoplastic Lesions
22.4.1.1 Intra-axial Neoplasms
Broadly, these lesions are divided into glial and non-glial tumors. Among the glial tumors, glioblastoma multiforme and high-grade astrocytoma are the commonest lesions in the geriatric population.
Glioblastoma Multiforme
GBM represents the most malignant end of the spectrum of astrocytic tumors. It constitutes approximately 15–20 % of all intracranial tumors (Russell and Rubinstein 1989) and is the most common primary brain neoplasm in adults. Most GBMs arise from an existent astrocytoma, but some develop de novo (Vandenberg 1992), and about 7.5 % they have multicentric origin (Barnard and Geddes 1987). Most cases are diagnosed in patients older than 50 years of age, with the peak incidence in the sixth decade. As with gliomas in general, these lesions show a male predominance of approximately 3:2. Typically, clinical signs and symptoms of elevated intracranial pressure progress rapidly over a period often as short as 1 month from its initial onset. These tumors have poor prognosis despite all forms of therapy, with a median survival of approximately 12 months. Factors that appear to correlate with a somewhat better prognosis include younger patients, development of glioblastoma as a secondary dedifferentiation rather than as the initial presentation, and surgical debulking.
Large, irregular, but seemingly well-circumscribed mass lesions are seen on gross pathology, which typically demonstrate central necrosis, hemorrhage of varying stages, and hypervascularity, often with regions of thrombosed vessels. Extensive mass effect and edematous white matter often accompany even relatively small tumor masses. The mechanism of peritumoral edema is presumed to be related to the production of vascular permeability factor, which is supported by the fact that glioblastomas are typically noted to have substantially elevated vascular permeability (K trans) to gadolinium as compared with lower-grade gliomas (Wu et al. 2002; Aronen et al. 2000). Vascular endothelial proliferation within and adjacent to the tumor tissue and intratumoral necrosis are characteristic of glioblastoma (Kallio 1990; Burger and Scheithauer 1994a). The MRI features of these tumors clearly reflect the pathologic findings such as intratumoral hemorrhage, necrosis, and varying degrees of hypercellularity (Fig. 22.3). Linear or serpentine regions of signal void within the tumor mass on conventional MRI indicate the prominent angiogenesis that characterizes GBM.
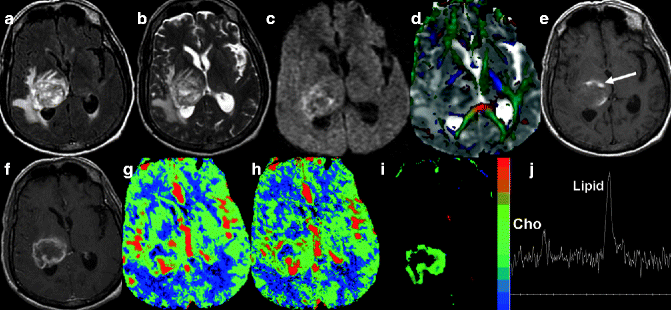

Fig. 22.3
MRI of a 70-year-old patient. Axial FLAIR- (a) and T2-weighted (b) images show a heterogeneous mass lesion with marked perilesional edema in the region of the right thalamus and adjacent temporoparietal lobes. Diffusion-weighted imaging shows areas of hyperintensity in the periphery of the lesion (c). Color-coded fractional anisotropy map overlaid on ADC (d) shows near complete interruption of adjacent white matter tracts in the tumoral region. Note the areas of reduced ADC within the tumor, suggestive of increased cellularity. Areas of hemorrhage are seen as hyperintensity (arrow) on T1-weighted image (e). Note the peripheral thick rim enhancement with a non-enhancing necrotic central part on post-contrast T1-weighted axial image (f). Perfusion maps show marked increase in CBV, CBF (g h), and K trans (i) values, suggestive of neoangiogenesis and increased permeability. On proton MR spectroscopy, the presence of a prominent lipid peak along with choline suggests high-grade neoplasm with necrosis (j). On histopathology the tumor was confirmed as GBM
Nearly all glioblastomas at least partially enhance with intravenous contrast. Enhancement patterns are usually very heterogeneous, often ringlike, depicted as thick, irregular, nodular, and having surrounding necrotic areas. These findings are virtually indistinguishable from those seen in metastases and radiation necrosis. Most glioblastomas are solitary lesions (as opposed to metastases); multicentric glioblastomas are distinctly unusual (Barnard and Geddes 1987). Multicentric malignant gliomas, whether synchronous (detected at the time of the initial presentation) or metachronous (occurring at different times but discontinuous on pathology), cannot be differentiated from metastases without biopsy (Van Tassel et al. 1988). These lesions often extend across dense white matter commissures including the corpus callosum and may spread along CSF. Regions that enhance on post-contrast imaging correlate with areas of tumor tissue on pathology (Earnest et al. 1988), which is helpful in guiding surgical biopsy; however, not all enhancing regions of the tumor will necessarily be of similar histopathologic grade. Targeting regions of high CBV derived from perfusion MRI for biopsy has been advocated by some investigators as a means of identifying the most active portions of the tumor (Goldman et al. 2006) and reducing the risk of under-grading.
The differential diagnosis includes metastasis, anaplastic oligodendroglioma, and lymphoma. Radiation necrosis can appear identical to glioblastoma; abscess/cerebritis with enhancement and even cavernous angiomas with recent hemorrhage, or reactive gliosis, must also be considered. Even hemangioblastoma can appear virtually identical to glioblastoma because intratumoral vessels, heterogeneity, enhancement, and edema can be evident in both. Hemorrhage, however, is highly unusual in hemangioblastoma but common in the glioblastoma, anaplastic oligodendroglioma, and some metastases. The large, often non-enhancing cyst of hemangioblastoma and the posterior fossa location are the key to the distinction. MRI potentially narrows this list considerably: (1) it is more sensitive for detecting multiple lesions, which would heavily favor lesions other than glioblastoma; (2) the capsule of an abscess characteristically shows thin hyperintensity on T1-weighted and thin hypointensity on T2-weighted MRI (Haimes et al. 1989), and pyogenic abscesses show central restricted diffusion, findings not described in tumors; and (3) lymphoma most commonly appears homogeneous and hypointense on T2-weighted images, a characteristic feature seen less commonly in glioblastoma. Adjunctive MRI techniques, like MR spectroscopy and diffusion- and perfusion-weighted imaging, particularly for radiation necrosis, may assist in refining the differential diagnosis. In cases where the biopsy is planned, these techniques may guide the surgeon toward the regions of highest grade, as suggested by elevated CBV or relatively high choline peaks on MR spectroscopy (Nelson and Cha 2003; Nelson et al. 2002).
Anaplastic Astrocytoma
The intermediate form of the infiltrative fibrillary astrocytoma is the anaplastic astrocytoma (WHO grade III). This lesion is somewhere between the astrocytoma and the glioblastoma in its histologic features and biological behavior. It may arise as a dedifferentiated astrocytoma or may develop de novo (VandenBerg 1992). These lesions generally occur in patients who are older than those with astrocytomas but younger than those with glioblastomas. The peak incidence of anaplastic astrocytoma of the cerebral hemisphere is in the fifth decade. On macroscopic pathology, anaplastic astrocytomas are usually more obvious and more heterogeneous mass lesions than their lower-grade counterpart. The microcystic changes often found in well-differentiated astrocytoma are lacking in the anaplastic type. As compared with glioblastoma, the necrosis and degree of vascular proliferation are less prominent and show moderate hypercellularity (Burger and Scheithauer 1994a).
MRI of anaplastic astrocytoma is variable. These are typically more heterogeneous than astrocytoma and do not show signs of frank cystic necrosis that are highly suggestive of glioblastoma. The high-intensity abnormality on T2-weighted images suggestive of vasogenic edema is commonly associated with these lesions. These lesions can show areas of hypercellularity, as opposed to the typical low-grade astrocytoma. Intratumoral hemorrhage and flow voids suggestive of neovascularity which are more commonly seen in GBM may also be seen in these lesions. Contrast enhancement is extremely variable in anaplastic astrocytomas in both extent and pattern and can be focal, nodular, homogeneous, or ringlike (Fig. 22.4). Intraventricular, subarachnoid, or subependymal spread may also be seen in these lesions.
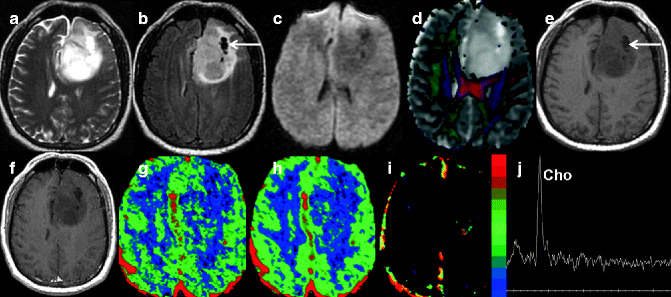

Fig. 22.4
MRI of a 63-year-old woman with histology-proven anaplastic astrocytoma. T2-weighted axial image (a) shows a heterogeneous infiltrating intra-axial mass lesion in the left frontal lobe. The FLAIR image shows few areas of cystic formation (arrow) within the mass (b). The lesion appears hypointense on diffusion-weighted imaging (c). Color-coded fractional anisotropy map overlaid on ADC map shows disruption as well as displacement of the adjacent white matter tract (d). Note the areas of high as well as low ADC suggesting tumor heterogeneity. This lesion is iso- to hypointense (arrow) on pre-contrast T1-weighted axial image (e) with no evidence of enhancement on the post-contrast T1-weighted image (f). Perfusion maps show heterogeneity of CBV (g) and CBF (h) values in the tumor. On K trans map, a small area of positive values suggests the presence of a minimal break in the blood brain barrier (i). Proton MR spectroscopy (j) reveals elevated choline
Oligodendroglioma and Anaplastic Oligodendroglioma
This tumor is relatively infrequent in the geriatric population with peak incidence in the fourth to fifth decades. Although most of these tumors are located superficially in the frontal and frontotemporal cortex, a smaller number are seen in the ventricular walls, cerebellum, and very rarely within the spinal cord (Russell and Rubinstein 1989). The prognosis is considerably better than that of infiltrative astrocytomas of similar histologic grade (Shaw et al. 1992; Baehring 2005). Anaplastic differentiation also has been described in well-differentiated lesions as in astrocytoma, but this occurs over a long period in contrast to astrocytoma (Burger and Scheithauer 1994a).
Pathologically, oligodendrogliomas are solid infiltrative lesions with poorly defined borders and often contain cellular elements of other glial types and hence are considered “mixed” in up to one half of the cases (Russell and Rubinstein 1989). Focal cystic necrosis and intratumoral hemorrhage are frequent findings, as these are the intracranial tumors with the highest frequency of calcifications. Oligodendrogliomas are generally graded into well-differentiated tumors (WHO grade II) and anaplastic lesions (WHO grade III). Microcysts and low cellularity are favorable features, whereas mitosis, vascular hypertrophy, pleomorphism, and cellular atypia are unfavorable (Burger and Scheithauer 1994a). Oligodendrogliomas are usually heterogeneous and show lower signal intensity than astrocytomas (i.e., isointense to gray matter) on T2-weighted images because they are typically hypercellular. These masses are typically located peripherally and quite often are situated in the frontal lobes (Fig. 22.5) (Lee and Van Tassel 1989), and the most useful finding on MRI is the cortical infiltration and marked cortical thickening, a finding that distinguishes these neoplasms from the astrocytic brain tumors, which arise within white matter. Small cystic-appearing regions and hemorrhages are also commonly seen. Linear or nodular tumoral calcification on CT has been reported in 50–90 % of oligodendrogliomas (Vonofakos et al. 1979). Evidence of the long-standing nature of the mass like adjacent calvarial changes should be sought carefully as these are very subtle on MRI and more easily seen on CT. Contrast enhancement has been reported in about one half of cases (Lee and Van Tassel 1989), but edema is not a common feature of these tumors. Perfusion imaging can demonstrate areas of relatively high cerebral blood volume within oligodendrogliomas (Spampinato et al. 2007), which is helpful in differentiating low-grade from higher-grade tumors.
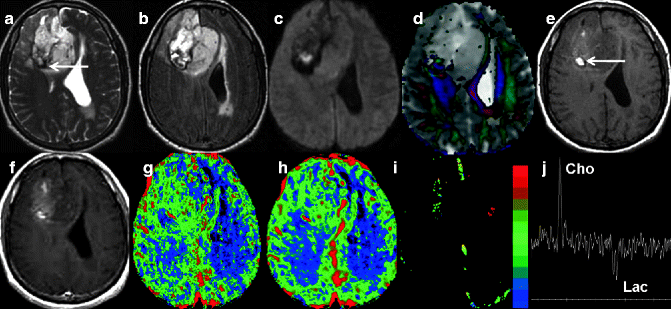

Fig. 22.5
Histopathologically proven case of anaplastic oligodendroglioma in a 70-year-old man. Axial T2-weighted image (a) shows a heterogeneous intra-axial mass lesion with perilesional edema in the right frontal lobe, with mass effect. FLAIR image shows dilation of left lateral ventricle with periventricular ooze suggestive of hydrocephalus with trans-ependymal seepage (b). Focal area of hyperintensity is seen on diffusion-weighted imaging image (c). Color-coded fractional anisotropy map overlaid on ADC (d) shows interruption of right frontal white matter tracts in the tumoral region, with variable ADC values. Areas of hemorrhage are hyperintense on pre-contrast T1 (e) image (arrow) and hypointense (arrow) on T2-weighted image (a). Minimal patchy areas of nodular enhancement are seen on the post-contrast T1-weighted image (f). Perfusion maps show a mild increase in CBV (g), CBF (h), and K trans (i) values, suggesting increased permeability and neoangiogenesis. Proton MR spectroscopy from the tumor shows elevated choline and lactate peak (j)
Primary Lymphoma
Primary CNS lymphoma (PCNSL) is a rare entity with an increasing incidence, constituting approximately 1 % of all primary brain tumors in the literature (Burger and Scheithauer 1994a). This increase has occurred not only in patients with human immunodeficiency virus but also among the immunocompetent population and is strongly associated with Epstein-Barr virus in immunocompromised patients (Hoang-Xuan et al. 2004). Peak age of incidence in the non-AIDS population is the sixth decade. It is recognized that nearly all PCNSL is of the non-Hodgkin type (Russell and Rubinstein 1989); when Hodgkin lymphoma involves the brain parenchyma, it is almost always in the presence of systemic disease or with dural attachment (Clark et al. 1992). The supratentorial compartment is involved in approximately 75–85 % of patients at initial presentation, and multiplicity is noted in up to one half of cases. Intracranial metastases from systemic lymphoma generally fall into one of two categories: leptomeningeal (with or without parenchyma) or dural based (Russell and Rubinstein 1989). Pathologically, parenchymal lesions are ill-defined masses with irregular borders. Microscopically, the infiltrative edges of the lesions extend along perivascular spaces and infiltrate blood vessel walls (Hochberg and Miller 1988). Dural-based masses often spread via the Virchow-Robin perivascular spaces and directly invade the brain parenchyma.
The classic imaging findings of parenchymal lymphoma include masses that involve the deep gray matter structures, periventricular regions (Fig. 22.6), and corpus callosum (Jack et al. 1988). It has been reported that up to 75 % of lymphomatous masses are seen to be in contact with ependyma or meninges, or both (Jack et al. 1988). The detection of enhancement along perivascular spaces on MRI should put PCNSL at the top of the differential diagnosis, with sarcoidosis as an alternative. The extent of edema on MRI is generally less than seen in conjunction with primary gliomas or metastases of similar size. Calcification and hemorrhage are distinctly uncommon. MRI signal intensity patterns are often varied, particularly in patients with AIDS. Usually, these lesions are often isointense to gray matter on all spin echo sequences and show dense and homogeneous enhancement; however, necrotic lesions show ring enhancement, especially in AIDS patients. In this setting, differentiation from toxoplasmosis is important. The presence of subependymal spread is the most valuable sign on imaging which is highly suggestive of lymphoma (Dina 1991). Diffusion MRI shows low ADC due to hypercellularity. Presence of an elevated choline peak on MR spectroscopy and relatively diminished regional CBV in perfusion-weighted imaging favors toxoplasmosis over lymphoma. Presence of hemorrhage argues against lymphoma which can be seen in toxoplasmosis especially after treatment. If a focal-enhancing parenchymal mass is accompanied by enhancement along the perivascular spaces, especially with adjacent meningeal enhancement, the only entities that should be seriously considered are lymphoma and sarcoidosis.
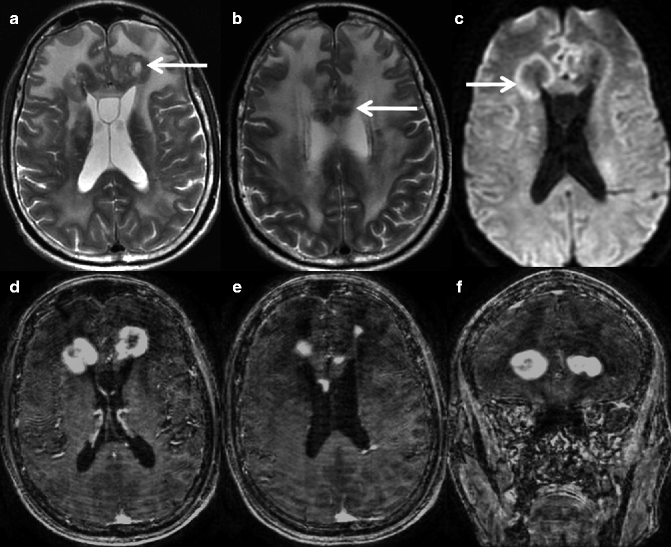

Fig. 22.6
MRI of a 69-year-old man who presented with a headache. T2-weighted axial images (a, b) show multiple lesions (arrow) with marked perilesional edema in the bilateral frontal lobes. Note the T2 hypointensity and periventricular location of these lesions. Hyperintensities are (arrow) suggestive of diffusion restriction, as seen on diffusion-weighted imaging (c). Post-contrast T1-weighted axial and coronal images (d–f) show nodular areas of contrast enhancement. Histology of this lesion confirmed lymphoma
Posttransplant lymphoproliferative disorder refers to a highly morbid condition in which a group of B cells grows out of control after an organ transplant in patients receiving immunosuppression, associated with Epstein-Barr virus infection of B cells. Posttransplant lymphoproliferative disorder is most commonly used to describe a spectrum of lymphoproliferative disorders, from infectious mononucleosis and lymphoid hyperplasia to highly invasive malignant lymphoma (Taylor et al. 2005). The CNS is involved in up to 30 % of cases of posttransplant lymphoproliferative disorder, and, in many of these, the disease is confined to the CNS with poor prognosis (Maecker et al. 2007). When the brain is involved, lesions are typically multiple and enhancing and can appear identical to typical lymphoma, which reflects hypercellular masses often with accompanying leptomeningeal or subependymal involvement.
22.4.1.2 Extra-axial Tumors
Meningiomas
Meningiomas are the most common primary non-glial intracranial tumor (Hardman 1983). Meningiomas mostly affect people in the middle and late decades of life. There is a strong female predilection, with a female-to-male ratio of about 2:1. A varying incidence of multiple meningiomas (1–8 %) has been reported in the older population (Kepes 1982). Meningiomas have a distinct predilection for certain intracranial locations, although they may occur in any area where meninges exist or there may be cell rests of meningeal derivation. There is a close relationship between the location of the arachnoid granulations and the prevalent sites of origin for meningiomas (Hardman 1983). Approximately 50 % of convexity meningiomas are parasagittal or attached to the sagittal sinus. Other favorite sites include the dura adjacent to the anterior sylvian fissure region, the sphenoid wings, tuberculum sellae, perisellar region, and olfactory grooves. They may also arise from the optic nerve sheath intra-orbitally or extend into the optic foramen from a tuberculum sella tumor. In the posterior fossa, these frequently arise from the petrous bone in the cerebellopontine angle, the clivus, the tentorial leaf, and the tentorial free margin. Meningiomas are usually broad based and firmly attach to the adjacent dura (Fig. 22.7), or they can arise without any dural attachments apparently from pial meningeal cells. These pial-based meningiomas may be found in the depths of the sylvian fissure or may present intraventricularly, usually in the lateral ventricle but occasionally in the third and fourth ventricles arising from either the tela choroidea or arachnoidal cell rest within the stroma of the choroid plexus.
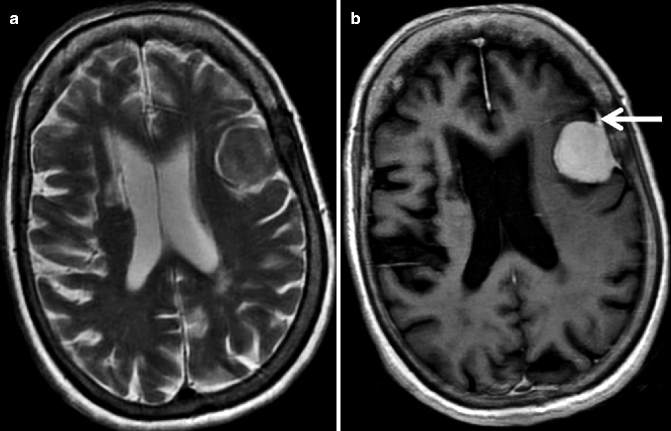

Fig. 22.7
MRI of a 70-year-old woman who presented with headache. T2-weighted axial image (a) of the brain shows a well-defined hypointense dural-based extra-axial lesion adjacent to the left frontal convexity. The corresponding post-contrast T1-weighted image (b) shows homogenous contrast enhancement. Note the enhancing dural tail (arrow). Histology from this lesion confirmed meningioma
Most meningiomas demonstrate a heterogeneous intensity pattern that is most evident on T2-weighted images (Spagnoli et al. 1986). Tumor heterogeneity can be related to the presence of several factors such as vascularity, cystic foci, calcifications, and an inherent speckling and mottling of uncertain etiology. Tumor vascularity has been identified in approximately one third of cases and appears as punctate and curvilinear hypointensities within the mass on both T1- and T2-weighted images. Cystic foci develop from coalescence of cystic spaces in the microcystic and angioblastic varieties of meningioma. These appear on T1-weighted images as smooth and rounded hypointensities. On proton density-weighted and FLAIR images, these foci are iso- to slightly hypointense and become hyperintense on T2-weighted images. Calcifications, when apparent on MRI, appear as coarse, irregular regions of hypointensity on both T1- and T2-weighted sequences and are better visualized with susceptibility-weighted imaging. Internal tumor vascularity and arterial encasement are well demonstrated on MRI and are usually not detectable with CT (Spagnoli et al. 1986; Young et al. 1988) as these vessels and the meningioma usually exhibit similar contrast enhancement. MRI is also superior to CT in demonstrating venous sinus invasion (Spagnoli et al. 1986). Venous sinus invasion is demonstrated on MRI by the partial or complete obliteration of the sinus flow void with a soft tissue mass. The intensity of the tissue within the venous sinus is usually similar to that of the adjacent tumor mass and can be appreciated on both T1- and T2-weighted imaging. Tumor may be demonstrated crossing from one side to the other through the tentorium cerebelli, falx cerebri, or cavernous sinus. Bony hyperostosis is also equally well demonstrated with MRI and CT. Small soft tissue components of primarily intraosseous meningiomas are frequently definable with MRI but not with CT.
Brain edema develops in approximately 50 % of meningiomas. Edema associated with meningioma is thought to be vasogenic in origin and probably related to tumor secretion of vascular endothelial growth factor (VEGF), rather than a result of direct mass effect on adjacent brain or venous invasion causing vascular congestion (Pistolesi et al. 2002). The presence of intra-axial edema is said to predict an increased potential for recurrence (Vignes et al. 2008; Simis et al. 2008). Reduced water diffusivity has been shown to correlate with more aggressive tumor behavior and is sometimes seen with atypical/malignant meningiomas with high cellular density and recurrence (Nagar et al. 2008). A decrease in ADC values at follow-up of a benign meningioma should raise suspicion for dedifferentiation to higher tumor grade (Hakyemez et al. 2006). Essentially all meningiomas produce marked homogeneous tumor enhancement (Bydder et al. 1985a, b; Felix et al. 1985). Contrast enhancement on MRI is almost always identifiable, even when meningiomas are densely calcified. Enhancement may be either uniform or ringlike. The most striking finding of contrast-enhanced MRI in meningiomas is dural enhancement adjacent to the lesion. En plaque convexity and basal meningiomas may infiltrate adjacent dural surfaces for several centimeters. Recognition of this infiltration can be of significant importance in surgical planning for complete tumor removal (Borovich and Doron 1986). Dural enhancement is not specific for meningioma; rather, it indicates dural involvement by any adjacent mass, whether the mass is meningioma, metastases, or invasive primary brain tumor.
MRI appearance of angioblastic meningiomas may be quite varied, depending on cellular and secondary changes in the tumor. On T1-weighted images, angioblastic meningiomas may reveal either low or high intensity, depending on the degree of xanthomatous change. Those with prominent fatty accumulations are of high intensity on T1-weighted images. On T2-weighted images, these meningiomas are also usually of high intensity because of the rich capillary bed. There may be focal or diffuse hypointensity with xanthomatous change. Brain edema may be extensive. Intratumoral hemorrhage is presented with characteristic signal intensity, depending on the age of the hemorrhage.
Five to 10 % of all meningiomas occur in the sellar region, where they are the second most common lesion in adults exceeded only by the pituitary adenoma. Based on clinical presentation, a sellar meningioma can be distinguished from a pituitary adenoma. The presence of visual symptoms without evidence of endocrine abnormalities or bitemporal hemianopsia with the presence of a normal-sized sella favors the diagnosis of a meningioma (Freda and Post 1999).
Burger and Scheithauer (1994b) divided meningiomas into three groups, using both the level of histologic differentiation and the degree of aggressiveness to adjacent brain tissue: (1) typical benign meningioma; (2) atypical meningioma, having a strong tendency to recur but lacking histologic criteria of frank anaplasia; and (3) rare overtly malignant meningioma. This author stated that brain invasion, with deep expansile penetration of perivascular spaces with or without pial disruption, was due to malignant meningioma. Parenchymal invasion by meningioma can be suggested by absence of cleft with frond-like projections interdigitating with brain tissue.
Acoustic Schwannoma
Acoustic schwannomas constitute approximately 7–8 % of all primary intracranial neoplasms. They most frequently arise from the vestibular portion of the eighth cranial nerve, followed by the trigeminal nerve. They are frequently seen in association with neurofibromatosis type 2 diseases, in which these are typically bilateral. The tumors generally involve the intracanalicular portion of the nerve and in most instances also demonstrate a mass in the cerebellopontine angle. On MRI, thin-section (3 mm) axial T1-weighted images will reveal most tumors, which are generally larger than 3 mm in size (Goldberg et al. 1986; Press and Hesselink 1988). The tumors are usually well demarcated from adjacent CSF on these images and reveal mild hypointensity. On long-repetition time images, the tumors are usually heterogeneously hyperintense (Press and Hesselink 1988), and similar CSF intensity may obscure the lesion. These tumors can usually be demonstrated within the internal auditory canal without the use of contrast enhancement in most instances (Press and Hesselink 1988; Daniels et al. 1987). Contrast enhancement demonstrates smaller intracanalicular tumors that may not be otherwise fully defined, even on high-resolution routine series. Newer, high-spatial-resolution, thin-section, heavily T2-weighted images used to acquire an “MR cisternogram” allow for excellent depiction of the contents of the cerebellopontine angle and visualization of the seventh and eighth nerve complexes (Fig. 22.8). Acquisition can be performed either with three-dimensional half-Fourier rapid acquisition with relaxation enhancement or three-dimensional constructive interference in the steady-state techniques (Naganawa et al. 2001; Nakamura et al. 2002; Stuckey et al. 1996; Iwayama et al. 1999).
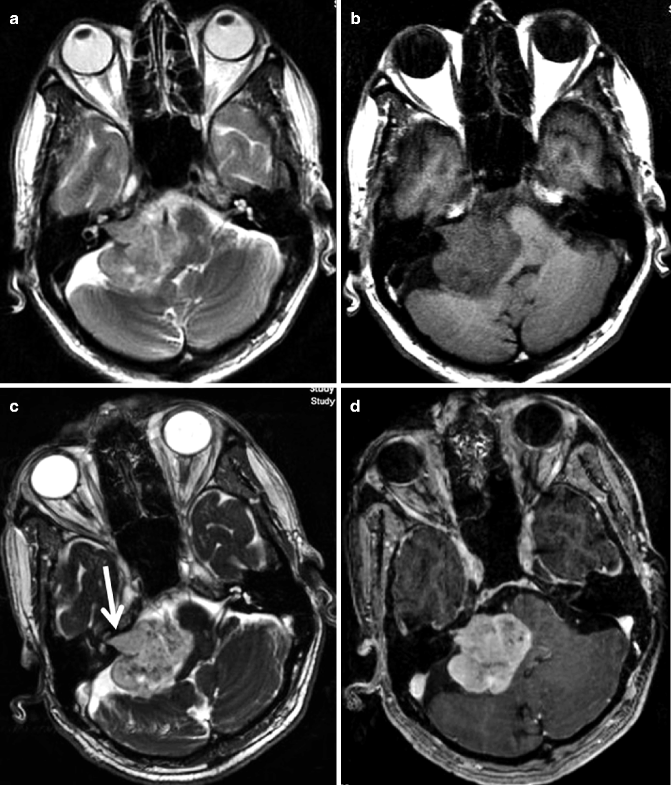

Fig. 22.8
MRI of the posterior fossa in a 66-year-old woman. Axial T2-weighted image (a) shows a large heterogeneous lobulated extra-axial mass in the right cerebellopontine angle cistern. This mass is hypointense on pre-contrast T1-weighted axial image (b). The mass is extending into the right internal auditory canal causing its enlargement (arrow), compared to the contralateral normal internal auditory canal, which is clearly seen on a post-contrast axial FIESTA image (c). Post-contrast T1-weighted image shows tumor enhancement (d)
Sellar and Parasellar Neoplasms
The sellar region encompasses the sella turcica with adjacent structures, the CSF spaces located nearby, the hypothalamus, the bottom of the third ventricle, and cavernous sinuses. Neoplastic lesions can arise from any of these structures, and rarely the pituitary gland can be the site for metastases.
Pituitary Adenomas
Pituitary adenomas account for approximately 10 % of all intracranial neoplasms and between one third to one half of sellar and parasellar masses (Osborn 1994; Kovacs et al. 1985). Nonfunctioning adenomas are more common in the geriatric population (Turner et al. 1999). Clinical signs of functioning adenomas such as hypertension, glucose intolerance, asthenia, mood depression, and arthralgia are rather prevalent, thus preventing adequate diagnostic work-up in elderly patients (Cohen et al. 1989b; Benbow et al. 1997; Tayal et al. 1994). Pituitary macroadenomas are twice as common as microadenomas and are the most common suprasellar masses and the most common mass resulting in visual symptoms in this region (Kovacs et al. 1985; Chung 1999). Even signs and symptoms due to macroadenomas can be easily misinterpreted (hypogonadism is one of the earliest symptom in nonfunctioning adenomas), but its presence in postmenopausal women is clinically silent, whereas in men it is often ascribed to a misconception about the physiological decline of sexual function with increasing age. Visual defects secondary to compression of the optic pathway are often misdiagnosed as other ocular diseases, such as cataract, macular degeneration, and vascular retinal disease, which are particularly frequent in this age group (Cohen et al. 1989b; Benbow et al. 1997; Tayal et al. 1994).
Virtually all pituitary tumors are benign adenomas, but on rare occasion adenohypophyseal cells give rise to carcinoma. The histologic criteria of malignancy are not well established, and the morphologic diagnosis is often difficult. Cellular pleomorphism and mitotic figures indicate a rapid growth rate but can be apparent also in benign tumors. Invasion of adjacent tissue is not regarded as unequivocal proof of malignancy. Conventionally, the diagnosis of carcinoma is used only when distant metastases occur (Kovacs et al. 1985).
A slow-growing macroadenoma expands the bony sella and extends into the suprasellar cistern. Often, these lesions have a “figure eight” or “snowman-like” appearance because the rigid dura of the diaphragm sellae gives the mass a waist (Fig. 22.9). On pre-contrast CT, macroadenomas are isointense to brain and demonstrate moderate contrast enhancement. On MRI, a macroadenoma appears isointense to gray matter on T1- and T2-weighted MRI and usually demonstrates intense contrast enhancement unless there are areas of necrotic degeneration or small amounts of hemorrhage (Osborn 1994). Macroadenomas are usually well defined and slow growing; if the adenoma is significantly large or invasive, it may extend into the sphenoid bone and sinus or into the cavernous sinuses affecting the carotid arteries or cranial nerves. Invasive adenomas are usually prolactin-excreting tumors (Elster 1993; Cottier et al. 2000). Cavernous sinus invasion by an adenoma is almost certain if the vessel is more than 67 % encased (Cottier et al. 2000). Invasion is likely if the carotid sulcus venous compartment (the space between the cavernous carotid artery and the carotid sulcus of the sphenoid bone) is obliterated or a line drawn along the lateral margins of the intracavernous and supracavernous segments of the internal carotid artery is crossed.
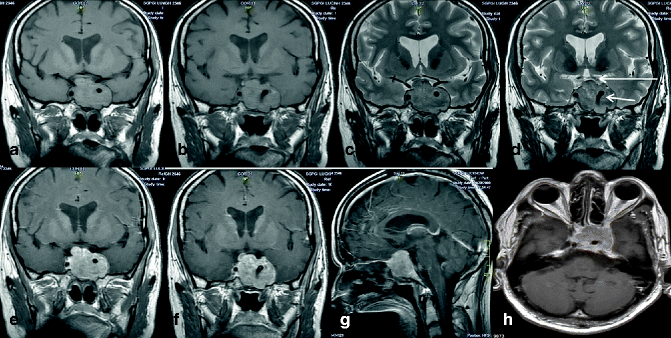

Fig. 22.9
MRI of pituitary adenoma in a 66-year-old man. Coronal pre-contrast T1-weighted images (a, b) show a large isointense lobulated sellar mass with suprasellar extension and expansion of the sella producing a figure eight. This lesion is iso- to mildly hyperintense on corresponding T2-weighted coronal images (c, d). Though the mass has encased the cavernous part of the left ICA, patency is maintained as evidenced by intact flow void (short arrow). The mass is abutting the optic chiasma (long arrow). In corresponding post-contrast T1-weighted coronal (e, f), sagittal (g), and axial (h) images, the mass shows nearly homogenous contrast enhancement. The pituitary gland cannot be discerned from the mass in any of these images
Craniopharyngioma
Craniopharyngiomas are rare tumors with an overall incidence of 0.13 cases per 100,000 per year with bimodal age presentation with a second peak at 50–74 years (Bunin et al. 1998). Craniopharyngiomas are grade I tumors, according to the WHO classification (Kleihnes et al. 1993). Although considered histologically benign, rare cases of malignant transformation (possibly triggered by previous irradiation) (Nelson et al. 1988; Kristopaitis et al. 2000) have been reported. Craniopharyngioma may arise anywhere along the craniopharyngeal canal, but most of them are located in the sellar/parasellar region. The majority (94–95 %) have a suprasellar component (purely suprasellar, 20–41 %; both supra- and intrasellar, 53–75 %) (Petito et al. 1976; Harwood-Nash 1994; Karavitaki et al. 2005), whereas the purely intrasellar ones are the least common variety (5–6 %) (Harwood-Nash 1994; Karavitaki et al. 2005).
The appearance of the craniopharyngioma depends on the proportion of the solid and cystic components, the content of the cyst (Pusey et al. 1987) (cholesterol, keratin, hemorrhage), and the amount of calcification present. The solid tumor appears iso- or hypointense relative to the brain on pre-contrast T1-weighted images which show enhancement after gadolinium, whereas it is usually of mixed intensity on T2-weighted images (Sartoretti-Schefer et al. 1997; Byrne 2002). Presence of calcification is of diagnostic significance and susceptibility-weighted imaging can detect it with sensitivity almost equal to CT. The cystic component is usually hypointense on T1-weighted and hyperintense on T2-weighted sequences (Byrne 2002). Protein, cholesterol, and methemoglobin may cause high signal on T1-weighted images (Pusey et al. 1987; Caruso et al. 1998), whereas very concentrated protein, calcification, and various blood products may appear hypointense on T2-weighted images (Caruso et al. 1998). Post-contrast T1-weighted images demonstrate the thin peripheral contrast-enhancing rim of the cyst (Sartoretti-Schefer et al. 1997). Interestingly, edema in the adjacent brain parenchyma spreading along the visual pathways may be present, providing a useful MRI finding for distinguishing craniopharyngioma from other common parasellar tumors (Nagahata et al. 1998).
Neoplastic Lesions of Nonpituitary Origin
Tumors metastatic to the pituitary gland are an unusual complication of systemic cancer typically seen in elderly patients with diffuse malignant disease (Sioutos et al. 1996; McCormick et al. 1989). The breast and lung are the commonest sites of the primary tumor, and diabetes insipidus is the most frequent symptom at presentation (Sioutos et al. 1996; McCormick et al. 1989). The predilection for metastasis to the posterior lobe is mainly attributed to the lack of direct arterial blood supply of the anterior lobe. Another contributing factor is that the posterior lobe has a larger area of contact with the adjacent dura (Chiang et al. 1990; Teears and Silverman 1975)
22.4.2 Metastases
On the basis of clinical studies, hospital records, and autopsy series, it has been suggested that intracranial metastases represent the most common brain tumors in the elderly population, accounting for 25–50 % of all cancer patients (Johnson and Young 1996; Posner 1996). Although brain metastases occur in patients of all ages, the highest incidence is seen in the fourth to seventh decades of life and constitutes a major health care problem (Vieth and Odom 1965). As new and more effective therapies for treating primary tumors lengthen patient survival and the availability of improved imaging techniques favors the detection of small and asymptomatic brain lesions, the incidence of brain metastases is expected to rise. In the geriatric population, lung cancer is the main cause of brain metastases (50–60 %), followed by breast cancer (15–20 %) and melanoma (5–10 %) (Langer and Mehta 2005). In cancer patients who will develop brain metastases, median time to brain recurrence is about 12 months, and, without treatment, median survival from detection of brain metastases rarely exceeds 1 month (Langer and Mehta 2005).
Over the past few decades, whole brain radiotherapy has been considered the standard treatment for brain metastases (Chung 1999). More recently, stereotactic radiosurgery, the delivery of a single, high-dose fraction of external radiation to a target lesion in the brain, has emerged as a promising therapeutic option for these patients. Surgery is another important treatment modality for brain metastases, although current evidence suggests that it should be reserved for selected patients with single brain metastasis and favorable prognostic factors.
22.4.2.1 Intraparenchymal Metastases
It is generally accepted that most intracerebral metastases are multiple, regardless of the site of origin; however, there is a high incidence of solitary metastasis, estimated to range from 30 to 50 % and especially common in melanoma, lung, and breast carcinoma (Posner and Chernik 1978; Meyer and Reah 1953). Therefore, the fact that an intracerebral mass lesion is solitary does nothing to mitigate the consideration of metastasis as the diagnosis. As the surgical intervention is often indicated for solitary metastases, whereas radiotherapy or radiosurgery is generally the therapy for multiple lesions, the detection of intracerebral metastases is critical to patient management.
Specific locations of intracerebral metastases generally coincide with the respective lobar volumes (Russell and Rubinstein 1989), except for the trend of renal cell carcinoma metastases to involve the infratentorial brain (Posner and Chernik 1978). Early metastatic foci are commonly found at the gray-white matter interface, a feature shared by all hematogenously disseminated embolic disease. This distribution has been ascribed to the dramatic narrowing of the diameter of arterioles supplying the cortex as these vessels enter the white matter (Russell and Rubinstein 1989). Metastases are notoriously surrounded by massive amounts of edema, often extending far from the site of a relatively small metastatic focus. The edema associated with brain tumors is classified as vasogenic (Klatzo and Seitelberger 1967), where the major mechanism of edema formation is an underlying disturbance in vascular permeability. The extent of associated edema bears no direct relationship to either the size of the metastasis or, necessarily, the clinical status of the patient (Penn 1980).
MRI with contrast is essential to detect intraparenchymal metastases. Lesions are usually discrete and can be distinguishable from associated edema on both post-contrast CT and MRI (Fig. 22.10). The edema accompanying metastases usually neither crosses the corpus callosum nor does it involve cortex, a feature that often helps to distinguish these lesions from primary infiltrative brain malignancies. Metastases may also occur in the corpus callosum, and the location alone should not preclude the diagnosis. Edema is not a significant component of cortical metastases, presumably due to the paucity of interstitium in these regions. Therefore, small metastases to the cortex may be missed if one relies on non-contrast study.
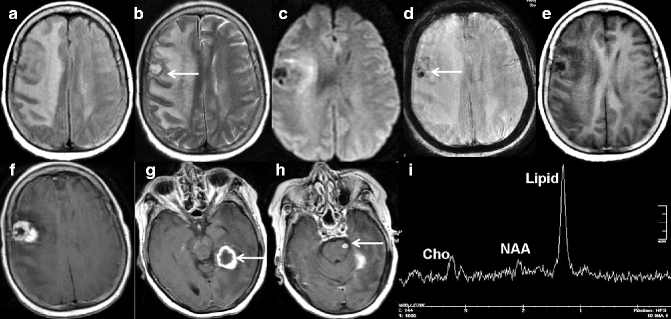

Fig. 22.10
MRI of a 60-year-old woman with known history of breast carcinoma shows brain metastases. Axial FLAIR- (a) and T2-weighted images (b) show heterogeneously hyperintense lesion (arrow) with perilesional edema in the right frontoparietal lobe. DWI shows heterogenous signal intensity (c). Note the disproportionate edema compared to the size of the lesion. Focal area of blooming suggests intralesional bleed (arrow) as seen on axial susceptibility-weighted (d) image. This lesion is hypointense on pre-contrast T1-weighted image (e) and shows a heterogeneous thick rim enhancement on post-contrast axial T1-weighted image (f). Post-contrast T1-weighted images at other levels show additional lesions (arrows in g, h) in the brainstem and left temporal lobe. On proton MR spectroscopy, there is presence of elevated lipid and reduced N-acetyl aspartate (NAA) peak (i)
Signal intensity patterns of specific metastases on MRI are usually nonspecific in that most tumors, regardless of site of origin, appear to be extremely variable in signal intensity (Damadian et al. 1973; Meyer and Reah 1953; Hall et al. 2004). There are several specific pathologic changes in metastases that influence the MRI appearance of these lesions, and these findings seem to be best delineated by conventional T2-weighted rather than FLAIR images. Areas of nonhemorrhagic cystic necrosis appear as irregular regions of CSF-like intensity surrounded by the non-necrotic portion of the lesion. Necrosis, on the other hand, has also been shown to shorten relaxation times, which may be due to release of intracellular, naturally occurring paramagnetics (e.g., iron or copper) or to free radical peroxidation. Intratumoral hemorrhage, which occurs in just less than 20 % of metastases (McConville et al. 2007; Goldman et al. 2006), is readily detected by MRI. The exquisite sensitivity for the detection of hemorrhage on MRI can give clues to the primary site of origin because some metastases (most notably melanoma, small cell lung carcinoma, thyroid cancer, choriocarcinoma, and renal cell carcinoma) have a particular tendency to bleed. Furthermore, detailed analysis of signal intensities in these cases can lead to the diagnosis of underlying tumor as the etiology of the intracranial hemorrhage (Atlas et al. 1987). It is well recognized that essentially all intracerebral metastases demonstrate contrast enhancement on MRI, presumably due to deficient blood-tumor barriers in the vascular endothelium of the involved capillaries. Moreover, high doses of MRI contrast agents appear to allow the detection of more metastatic lesions; this effect is dramatic in cortical metastases. It has been estimated that approximately 10 % of such cases alter patient management (Price et al. 2006). Cost-benefit studies and accurate approximations of the effect on patient management using high-dose contrast for patients with suspected metastatic disease remain uncertain. Recent attention to the use of stereotactic radiosurgery as an alternative to surgical resection for solitary metastases (Fig. 22.11), as well as data supporting the use of adjuvant radiotherapy after surgery (Stadlbauer et al. 2006; Quarles et al. 2005), makes the delineation of even small single metastases highly significant to management.
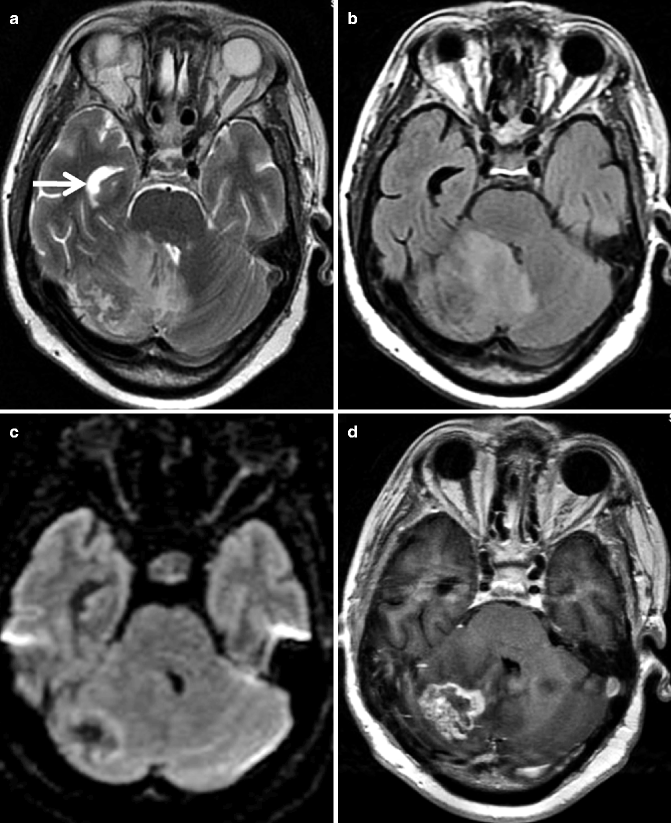

Fig. 22.11
MRI of the posterior fossa in a 63-year-old man. Axial T2-weighted image (a) shows a heterogeneous intra-axial lesion with perilesional edema in the right cerebellar hemisphere. Contrast between the lesion and the extent of edema is better visualized on FLAIR image (b). Peripheral hyperintensity is seen in the mass on diffusion-weighted imaging, consistent with cellular portion of the tumor (c). This lesion shows thick irregular rim enhancement on post-contrast T1-weighted image (d). Note the mass effect over the fourth ventricle leading to enlargement of the temporal horn of the right lateral ventricle (arrow), suggestive of hydrocephalus. Patient had been operated on for lung carcinoma 5 months before this MRI was acquired
22.4.2.2 Extra-axial Metastases
The most common type of metastatic tumor to spread to dural sites is breast carcinoma, followed by lymphoma, prostate carcinoma, and neuroblastoma (Posner and Chernik 1978). Epidural metastases in adults are almost invariably secondary to metastatic tumor in the adjacent skull and are usually associated with primary carcinomas of the breast, lung, prostate, or kidney (Posner and Chernik 1978, 138, Tsukada et al. 1983). Symptomatology from epidural or subdural metastases is usually due to direct compressive effects of underlying brain parenchyma, and location again determines the neurologic deficit. Other, less common sequelae of these lesions include venous thrombosis, which can occur either as a result of tumor invasion itself into the dural sinus or from venous compression and stagnation. A rare consequence of dural metastases is pachymeningitis hemorrhagica interna, which entails subdural hemorrhage in association with diffuse dural metastases. Subdural hematoma due to dural metastases is usually bilateral and is most often due to breast carcinoma (Russell and Rubinstein 1989); however, it has also been reported with many neoplasms, including prostate carcinoma and melanoma.
Leptomeningeal carcinomatosis, or carcinomatous meningitis, is an uncommon disorder that clinically is manifested by a low-grade meningitis syndrome accompanied by cranial nerve palsies due to infiltration of the subarachnoid space and the structures around the base of the brain (Henson and Urich 1982). The presence of this often elusive clinical diagnosis may also be indicated by the presence of communicating hydrocephalus. Besides primary CNS malignancies, adenocarcinomas are the major cell type to involve the leptomeninges, particularly from lung, stomach, breast, and ovary; however, melanoma is also seen as a cause of this disorder (Posner and Chernik 1978). Although radionuclide bone scan still is a reasonable screening tool for bone metastases, several reports indicate that MRI may have a higher sensitivity for these lesions. Metastases to the skull are seen as focal lytic or blastic lesions of both the inner and outer tables of the calvarium on CT. These lesions typically lack a well-defined sclerotic border, which, if present, suggests benignity. Occasionally, metastatic lesions to the skull are expansile and even hemorrhagic, especially from renal cell or thyroid carcinoma. MRI depicts calvarial metastases as focal regions of abnormal low signal intensity (isointense to gray matter) on T1-weighted images, which are relatively distinct from the high intensity of normal fatty marrow (Fig. 22.12). Note that these lesions can be obscured on MRI by enhancement after intravenous contrast, and pre-contrast images must be obtained if calvarial metastases are suspected. In addition, benign intradiploic epidermoid may be indistinguishable from the intracranial epidural extent of skull metastases. The presence of subdural disease is well documented by both CT and MRI, although a subtle dural-based tumor is probably better seen on MRI as CT is often limited by artifacts emanating from bone. The role of the radiologist in these cases is mainly to correctly discern extra-axial disease from superficial cortical intra-axial lesions. MRI or CT can also be helpful to distinguish epidural from subdural masses. Both modalities usually demonstrate epidural tumor as the characteristic biconvex mass that displaces brain parenchyma away from the calvarial metastasis.
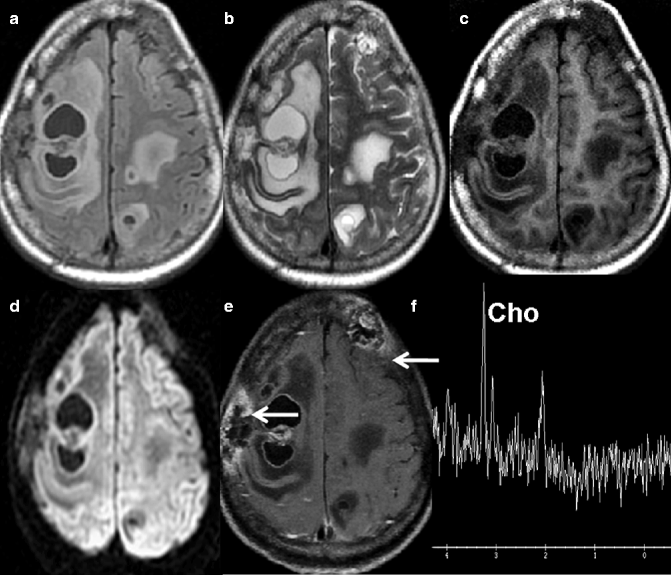

Fig. 22.12
MRI of a 67-year-old woman who had undergone surgery for carcinoma of the right breast 7 months previously. Multiple heterogeneous intra-axial lesions with areas of necrosis and marked perilesional edema are seen in bilateral frontoparietal lobes in the axial FLAIR- (a) and T2-weighted images (b). These lesions are hypointense on pre-contrast axial T1-weighted (c) image with no evidence of hyperintensity on diffusion-weighted imaging (d). These lesions show heterogeneous peripheral enhancement on post-contrast axial T1-weighted image (e). Two calvarial lesions, one in the right parietal bone and one in the left frontal bone, display abnormal marrow signal intensity and heterogeneous enhancement along with bone destruction in post-contrast axial T1-weighted image (arrows). Proton MR spectroscopy from the right frontal lesion shows elevated choline consistent with neoplastic etiology (f)
Subdural metastatic lesions, in contrast to subdural fluid collections (e.g., hematoma, hygroma), often appear very similar in intensity and shape to epidural metastases. These lesions are solid masses of neoplastic tissue and do not necessarily have the typical crescentic appearance of subdural hematomas because they do not merely passively fill the potential space of the subdural compartment. The major feature of epidural disease that allows distinction from subdural tumor is the neoplastic involvement of overlying calvarium, a nearly universal finding in epidural metastases. MRI is superior at depicting several signs that are not only pathognomonic of extra-axial disease but also allow specific identification of the involved compartment: (1) the identification of a CSF or vascular cleft between the lesion and normal brain, (2) direct visualization of the displaced dura and its relationship to the mass (especially after intravenous contrast), and (3) the documentation of displaced cortical veins, which lie between the extra-axial lesion and the brain.
Signal intensity patterns on MRI are usually not specific in the evaluation of types of extra-axial tumor because most metastases are slightly hypointense to cortex on T1-weighted images and are slightly hyperintense on T2-weighted images. This does differ somewhat from the most typical pattern described in meningiomas, which are classically nearly isointense to cortex on all sequences (Spagnoli et al. 1986). Unfortunately, some metastatic lesions, particularly those of small cell primary neoplasms, are isointense to gray matter on MRI. It is not uncommon for subdural metastases to invade brain parenchyma. Other nonneoplastic lesions, such as sarcoidosis or even empyema, can appear identical to metastases on MRI. Signal intensity patterns are helpful, however, in separating extra-axial hemorrhage from tumor because the various stages of extra-axial hemorrhage have relatively specific intensities (Fobben et al. 1989). Intravenous contrast agents might increase the detection of neoplastic causes of extra-axial hemorrhage. Bone invasion would indicate a neoplastic etiology of the mass. Several reports have shown that intravenous contrast-enhanced T1-weighted imaging is more sensitive for the detection of leptomeningeal diseases (Mathews et al. 1989; Frank et al. 1988), although recently FLAIR imaging has been shown to be extremely useful in this setting. On both CT and MRI, this disorder, when demonstrated, is seen as prominent enhancement of the leptomeninges and, at times, ependymal surfaces. Leptomeningeal involvement with tumor usually cannot be differentiated from other diffuse meningeal conditions, such as infectious meningitis. Although MRI is certainly the most sensitive imaging method to date, subependymal/ependymal tumor seeding does not necessarily enhance on MRI in all cases, and so it can be inferred that subtle cases will be missed. As with CT, even if MRI demonstrates only hydrocephalus in a patient with a known extracranial malignancy, the diagnosis of leptomeningeal carcinomatosis should be suspected, and examination of CSF for cytologic evidence of malignancy should be recommended.
22.5 Neoplastic Disease of the Spine and Spinal Cord
Compartmental localization of the lesions is of prime importance in the evaluation of neoplastic diseases of the spine and spinal cord. Inspecting the edge of the lesion at its interface with the subarachnoid space is the key to answering this essential question in the diagnostic approach to spinal lesions. In extradural lesions, the subarachnoid space is at the interface of the mass and the spinal cord. In intradural extramedullary masses, the subarachnoid space is widened and caps the lesion. A given lesion may reside in two compartments simultaneously, for example, a neurofibroma extending into both the extradural and the intradural extramedullary spaces. The other important issue in this compartmental classification is that lesions with identical pathology may occur in different compartments. For example, metastases obviously may occur in any of the three compartments, including the intramedullary space. In the extradural space, numerous primary bone tumors can occur. However, with few exceptions, such as hemangioma, most of the primary bone tumors are comparatively unusual. Secondary tumors, or metastases, are far more common in the extradural space.
In intramedullary masses, the lesion is part of the expanded spinal cord; hence, the subarachnoid space around the lesion-spinal cord complex is narrowed. Intramedullary tumors account for approximately 4 % of all CNS tumors. Most of the intramedullary tumors are of glial origin and are comprised of ependymoma (63–65 %) and astrocytoma (24–30 %) and less frequently glioblastoma (7 %), oligodendroglioma (3 %), and others (2 %).
22.5.1 Extradural Tumors
Vertebral body lesions usually have low intensity on T1- and high intensity on T2-weighted images (Fig. 22.13) (Frank et al. 1988; Vogler and Murphy 1988


Stay updated, free articles. Join our Telegram channel

Full access? Get Clinical Tree


