(1)
Department of Medical Imaging, Linkou Chang Gung Memorial Hospital, Taoyuan, Taiwan
(2)
Department of Medical Imaging and Radiological Sciences, Institute of Radiological Research Chang Gung University, Taoyuan, Taiwan
12.1 Renal Cell Carcinomas in Dialysis Patients with Acquired Cystic Kidney Disease
Case 1
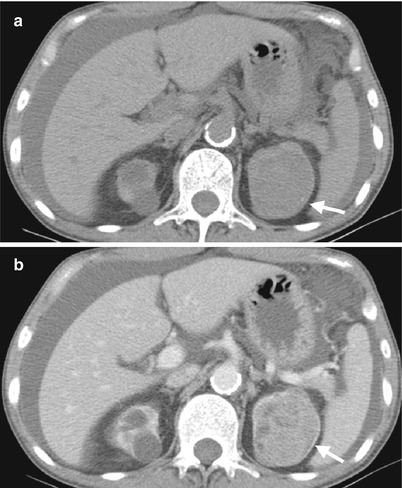
Fig. 12.1
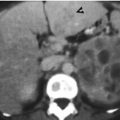
Computed tomography (CT) shows imaging characteristics of bilateral renal cell carcinomas (RCCs) in a patient with acquired cystic kidney disease (ACKD). Unenhanced (Fig. 12.1a) and enhanced (Fig. 12.1b) CT images at the renal upper pole show a predominantly solid tumor (arrows) at the left renal upper pole, consistent with an RCC. Note ascites due to end-stage renal disease of the patient. Multiple cysts of both kidneys are noted, consistent with ACKD.
Case 2
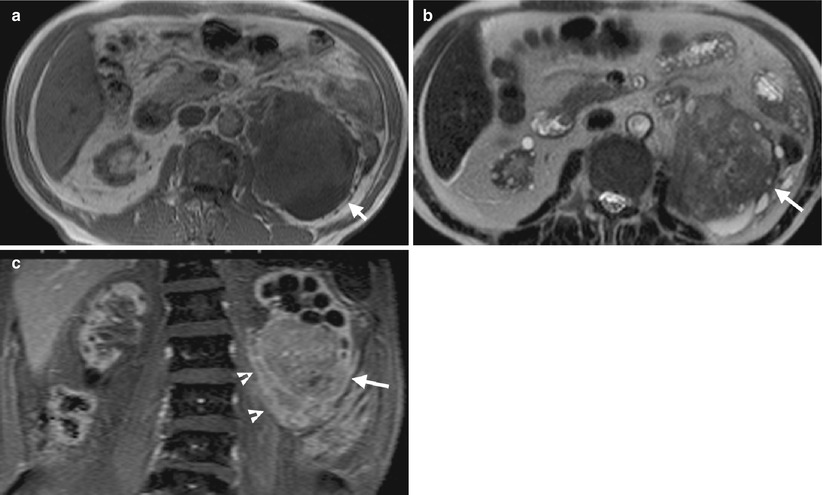
Fig. 12.2
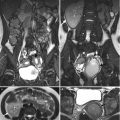
Magnetic resonance imaging (MRI) shows imaging findings of RCC in a patient with ACKD. Unenhanced axial T1-weighted image (T1WI) (Fig. 12.2a) shows a large left renal tumor (arrow) with similar signal intensity to the muscle. Unenhanced axial T2-weighted image (T2WI) (Fig. 12.2b) shows heterogeneous signal intensity of the left renal tumor (arrow), higher than that of the muscle. Coronal enhanced T1 fat-suppressed (T1FS) image (Fig. 12.2c) shows heterogeneous tumor enhancement of the left renal lower polar tumor (arrow) with perinephric invasion (arrowheads).
Key Diagnostic Features
Dialysis patients with acquired cystic kidney disease (ACKD) have higher risk to develop renal cell carcinomas than the general population [1]. The diagnosis of RCC in patients with ACKD is more difficult than that of the general population. However, detection of enhancing solid tumor or enhancing solid part in a cystic mass in a patient with ACKD should raise the suspicion of RCC. If there is clinical doubt of RCC diagnosis, an image-guided biopsy could be obtained to establish the diagnosis.
12.2 Urothelial Carcinomas in Dialysis Patient
Case 3
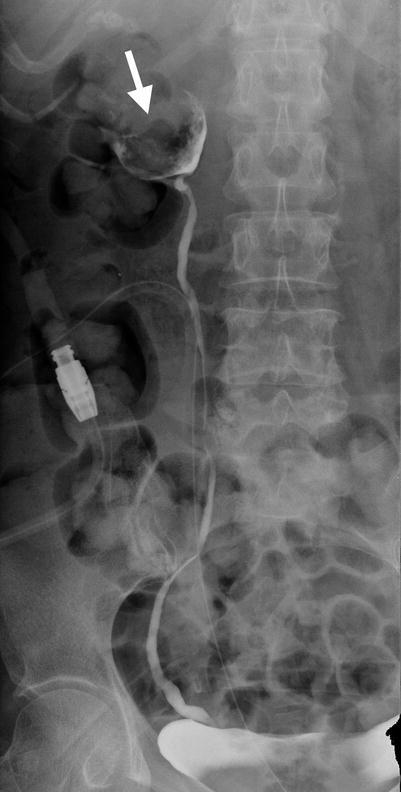
Fig. 12.3
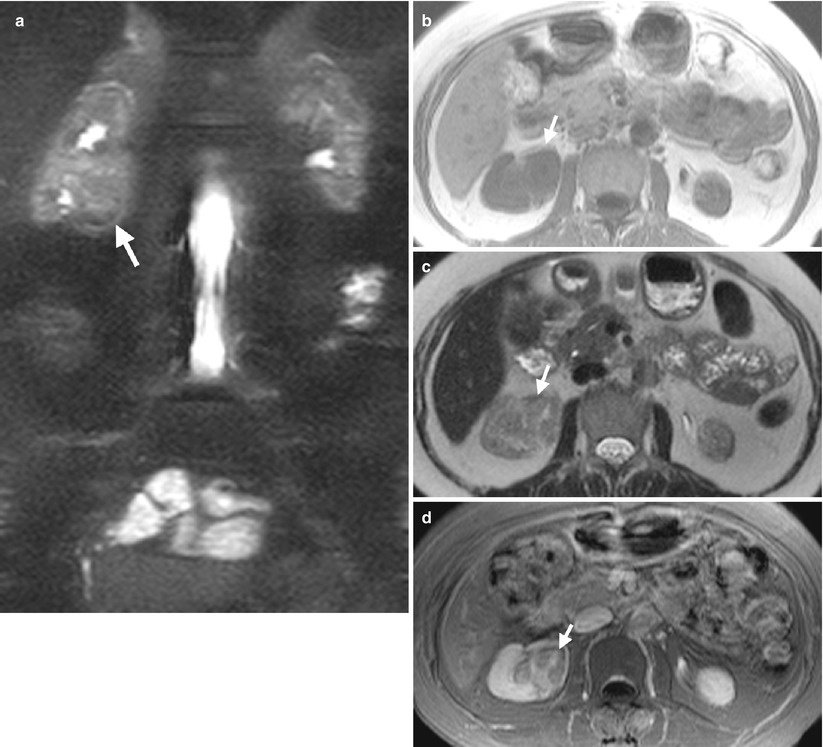
Fig. 12.4
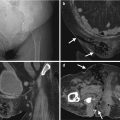
Retrograde pyelography (RP) and magnetic resonance imaging (MRI) show a urothelial carcinoma of the right renal pelvis in a dialysis patient. Right RP (Fig. 12.3) shows a large filling defect (arrow) in the right renal pelvis. MR urography (Fig. 12.4a) shows a mass lesion (arrow) of the right renal pelvis. Unenhanced axial T1-weighted image (Fig. 12.4b) and T2-weighted image (Fig. 12.4c) show the right renal pelvis mass (arrows) with isointensity to the muscle on T1-weighted image and intermediate signal intensity higher than the muscle on T2-weighted image. However, the demarcation of this mass to normal renal parenchyma is not conspicuous on these two images. Enhanced T1 fat-suppressed image (Fig. 12.4d) shows heterogeneous enhancement of the renal pelvis tumor (arrow), distinct from the right renal normal parenchyma.
Case 4
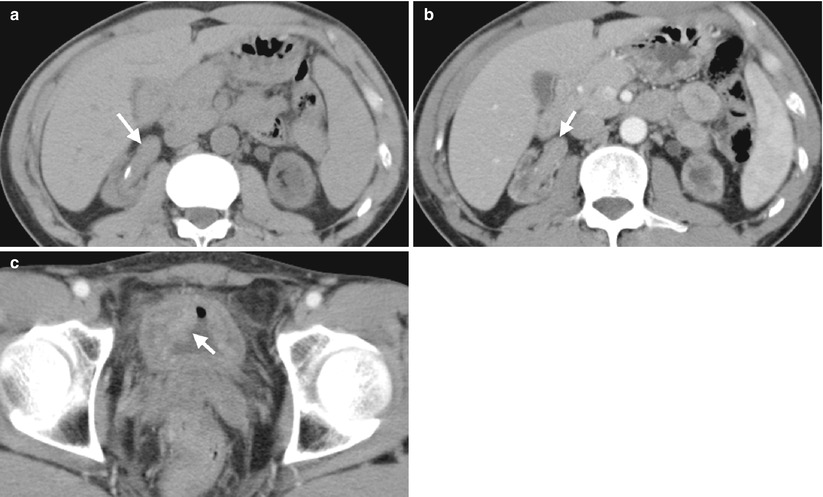
Fig. 12.5
Computed tomography (CT) shows imaging characteristics of urothelial carcinomas in the right renal pelvis and urinary bladder of a dialysis patient. Unenhanced (Fig. 12.5a) and enhanced (Fig. 12.5b) axial renal CT show an enhancing soft tissue mass of the right renal pelvis, compatible with urothelial carcinoma. Enhanced axial bladder CT (Fig. 12.5c) shows a mass lesion (arrow) at the right anterolateral wall of the urinary bladder as a urothelial carcinoma. Urothelial carcinomas of these two lesions are proved histologically after surgery. Note small sizes of both kidneys, which are consistent with end-stage renal disease of the patient.
Key Diagnostic Features
Dialysis patients may develop urothelial carcinomas, especially in Taiwan and China. The diagnosis of urothelial carcinomas on CT and MRI in dialysis patients is similar to that in non-dialysis patients. On RP, filling defects with irregular profiles or papillary appearances should raise the suspicion of urothelial carcinomas. However, in dialysis patients, RP could fail by difficulty in catheterized atrophic ureters. On CT and MRI, urothelial carcinomas appear as enhancing soft tissue mass or wall thickening in the renal collecting systems and ureters. Because the small sizes of the kidneys and ureters in dialysis patients, the detection of urothelial carcinomas within these anatomical structures is much more difficult than that in non-dialysis patients.
12.3 Urothelial Carcinomas in Kidney Transplant Recipients
Case 5
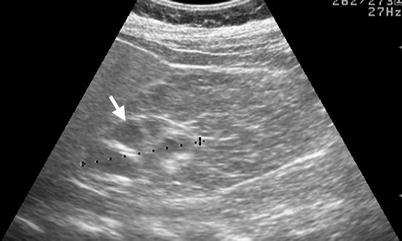
Fig. 12.6
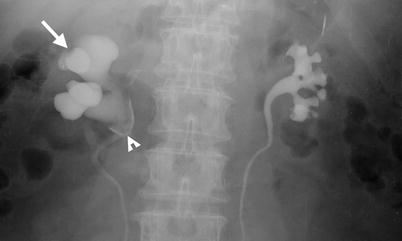
Fig. 12.7
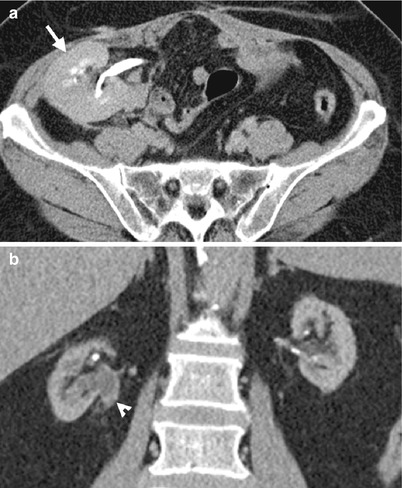
Fig. 12.8
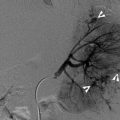
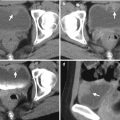
Renal ultrasound (US), retrograde pyelography (RP), and computed tomography (CT) show imaging characteristics of urothelial carcinomas at the right native renal pelvis near the ureter junction of a kidney transplant recipient. Right native renal ultrasound (Fig. 12.6) shows very small size of the right native kidney with hydronephrosis (arrow). Bilateral RP (Fig. 12.7) shows right native hydronephrosis (arrow) with a faint filling defect (arrowhead) at the right renal ureteropelvic junction. The left native renal pelvicalyceal system is small without dilatation. Enhanced axial CT at pelvic cavity (Fig. 12.8a) shows an allograft kidney (arrow) with contrast opacification in its renal collecting system, suggestive of good renal function. Enhanced coronal CT at bilateral native kidney level (Fig. 12.8b) shows focal wall thickening in the right ureteropelvic junction (arrowhead) with resultant right hydronephrosis. Histological examination of surgical specimen of right native nephroureterectomy reveals urothelial carcinoma of right native renal pelvis near the ureteral junction.
Case 6

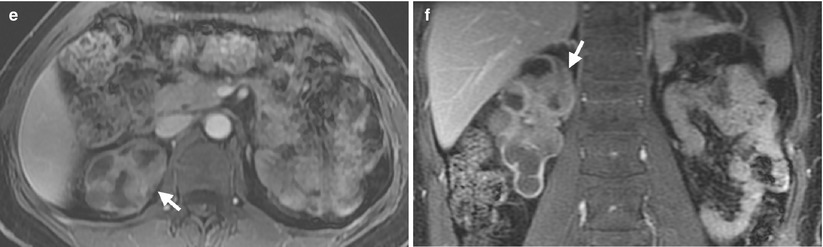
Fig. 12.9
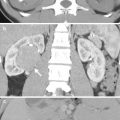
Magnetic resonance imaging (MRI) shows a urothelial carcinoma of the right native kidney in a renal transplant recipient. Unenhanced coronal T2-weighted image at the native kidney level (Fig. 12.9a) shows native right hydronephrosis with internal soft tissue areas. Note absence of the native left kidney due to left nephrectomy for a ureteral urothelial carcinoma 10 years ago. Unenhanced coronal T2-weighted image at the allograft level (Fig. 12.9b) shows normal appearance of the allograft kidney. Unenhanced axial T1-weighted image (Fig. 12.9c) shows the right renal pelvis tumor (arrow) with isointensity to the muscle. Unenhanced axial T2-weighted image (Fig. 12.9d) shows intermediate signal intensity of the right renal pelvis tumor (arrow), slightly higher than that of the muscle. Enhanced axial (Fig. 12.9e) and coronal (Fig. 12.9f) T1 fat-suppressed images show enhancement of the right renal pelvis tumor (arrows), making it distinguishable from normal parts of the right kidney.
Key Diagnostic Features
Urothelial carcinomas in kidney transplant recipients most commonly occur in native kidneys and ureters [2]. Renal ultrasound could detect hydronephrosis but seldom detect urothelial carcinomas themselves. On RP, urothelial carcinomas in native kidneys usually appear as filling defects of irregular profile. On computed tomography and magnetic resonance imaging, contrast medium enhancement of the tumors makes them more conspicuous for detection.
12.4 Sclerosing Encapsulating Peritonitis
Case 7
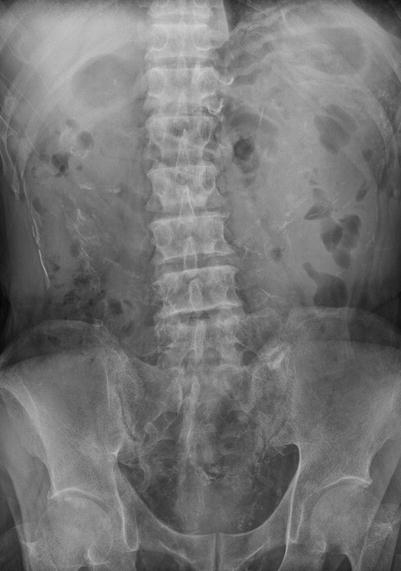
Fig. 12.10
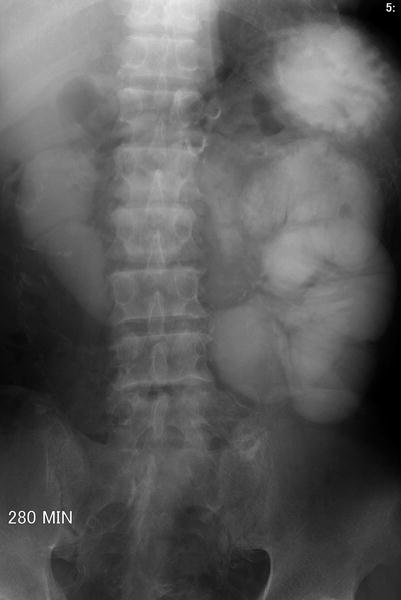
Fig. 12.11
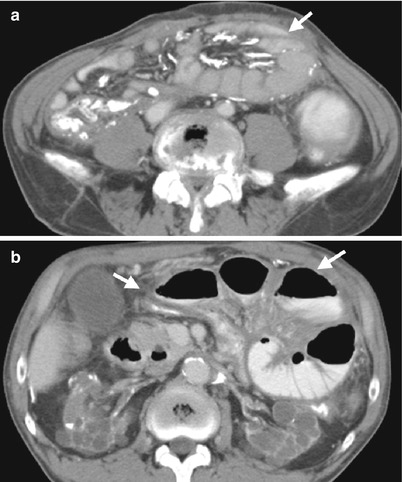
Fig. 12.12
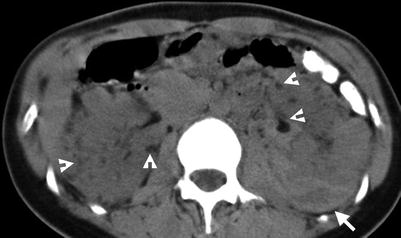
Plain radiography of the kidney, ureter, and bladder (KUB), small bowel study, and computed tomography (CT) show imaging characteristics of sclerosing encapsulating peritonitis in a patient undergoing continuous ambulatory peritoneal dialysis (CAPD). KUB (Fig. 12.10) shows extensive linear calcifications throughout the abdomen and pelvic cavity. Small bowel study (Fig. 12.11) shows dilatation of small bowel loops in the upper abdomen without contrast passage to distal small bowel loops up to 280 min, suggestive of bowel obstruction. Enhanced CT images at the pelvic cavity (Fig. 12.12a) and renal level (Fig. 12.12b), respectively, show linear calcifications in the bowel wall and mesentery. Note abdominal cocoons (arrows) enveloping the small bowel loops without resultant bowel obstruction.
Key Diagnostic Features
Sclerosing encapsulating peritonitis is one complication of CAPD, and its occurrence is related to CAPD duration [3]. On images, sclerosing encapsulating peritonitis is characterized by bowel wall thickening, bowel wall or peritoneal calcification, loculated fluid collection, and abdominal cocoon due to bowel loops encapsulated in a thick fibrosis membrane with resultant partial or complete bowel obstruction [3, 4]. Small bowel study may show bowel obstruction by increased transition time, abnormal dilatation of small bowel loops, and no passage of contrast medium to distal bowel loops in complete obstruction [3]. When there are extensive calcifications of the peritoneum and bowel walls, plain radiography of the kidney, ureter, and bladder could recognize these calcifications. However, computed tomography (CT) is much more sensitive to detect calcifications, even in their early stage [3]. Furthermore, CT could identify peritoneal wall and bowel wall thickening as well as abdominal cocoon and dilated bowel loops suggestive of bowel obstruction [3]. Therefore, CT is the most commonly used and most useful tool for diagnosing sclerosing encapsulating peritonitis.
12.5 Nephrotic Syndrome
Case 8
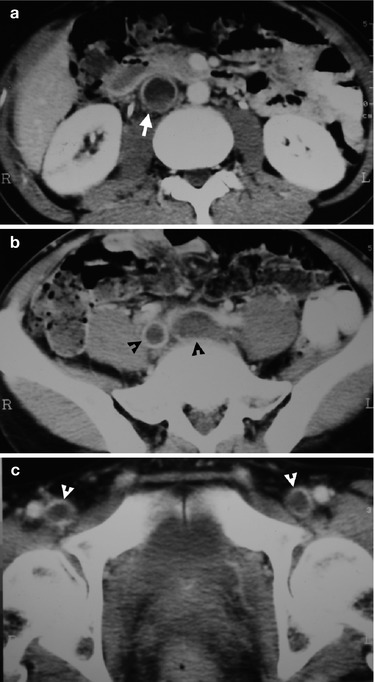
Fig. 12.13
Computed tomography (CT) illustrates imaging findings of thrombosis in inferior vena cava (IVC), common iliac vein, and femoral vein found in a patient with nephrotic syndrome. Enhanced renal axial CT image (Fig. 12.13a) shows a filling defect (arrow) in IVC, representing thrombosis. Enhanced axial CT image at the upper pelvic cavity (Fig. 12.13b) shows thrombosis (black arrowheads) in bilateral common iliac veins, respectively. Enhanced axial CT image at the lower pelvic cavity (Fig. 12.13c) reveals filling defects in bilateral femoral veins (white arrowheads) as thrombosis. The IVC thrombosis is an extension from iliofemoral thrombosis.
Case 9

Fig. 12.14

Fig. 12.15
Renal ultrasound and computed tomography (CT) illustrate imaging findings of left renal vein thrombosis in a patient with nephrotic syndrome and membranous glomerulonephritis. Right (Fig. 12.14a) and left (Fig. 12.14b) renal ultrasound show swollen appearance of the left kidney as compared to the right one. Enhanced axial CT images (Fig. 12.15a, b) show thrombosis (arrowheads) in a segment of the left renal vein. The nephrogram of the left kidney is delayed as compared with the right kidney. The left kidney has a globular shape by edematous change. There is increased perinephric stranding (arrows) as well.
Key Diagnostic Features
Nephrotic syndrome is associated with hypercoagulable state, which may result to renal vein thrombosis [5]. The most common underlying cause of nephrotic syndrome is membranous glomerulonephritis [5]. In severe hypercoagulable state, venous thrombosis could be found not only in the renal veins but also in the inferior vena cava and other veins. Renal Doppler ultrasound, magnetic resonance imaging, and enhanced computed tomography could be used to diagnose thrombosis of renal vein caused by nephrotic syndrome [5]. On enhanced CT or MRI, venous thrombosis appears as an intraluminal filling defect.
12.6 Tuberous Sclerosis Complex
Case 10