(1)
Department of Medical Imaging, Linkou Chang Gung Memorial Hospital, Taoyuan, Taiwan
(2)
Department of Medical Imaging and Radiological Sciences, Institute of Radiological Research Chang Gung University, Taoyuan, Taiwan
6.1 Multiple Renal Arteries
Case 1
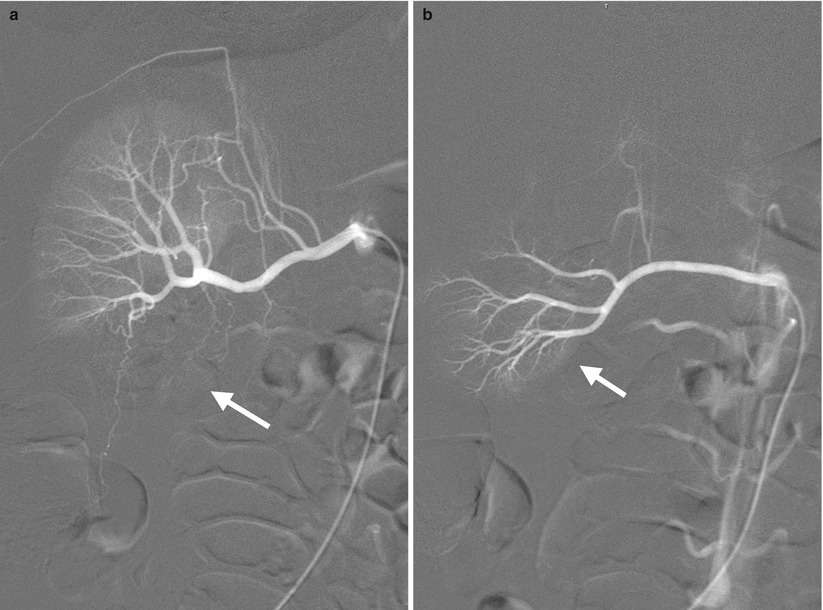
Fig. 6.1
Right renal arteriography (RA) shows two right renal arteries. Figure 6.1a, right renal arteriography of the main right renal artery shows renal upper pole and midportion supplied by this renal artery. Note the absence of blood supply to the renal lower pole (arrow) on this image. Figure 6.1b, right renal arteriography from an accessory right renal artery caudal to the main artery shows lower pole (arrow) instead of upper pole and midportion supplied by this accessory artery.
Case 2
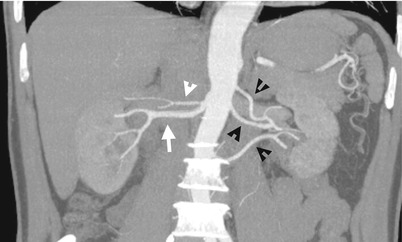
Fig. 6.2
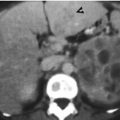
Figure 6.2, computed tomography angiography (CTA) shows two right renal arteries including one caudal main artery (white arrow) and another cranial accessory artery (white arrowhead). There are three left renal arteries (black arrowheads) depicted.
Case 3
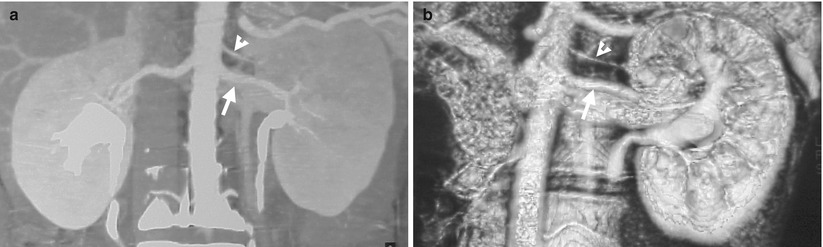
Fig. 6.3
Key Diagnostic Features
Multiple renal arteries are a normal variant and found in about 25–40 % of patients [1]. On conventional renal arteriography, a parenchymal perfusion defect should alert the operator about the possibility of the presence of another accessory renal artery. On modern imaging modalities such as computed tomography angiography (CTA) or magnetic resonance angiography (MRA), multiple renal arteries could be displayed by either magnetic intensity projection or volume-rendering techniques. Nonetheless, each renal artery regardless of main or accessory renal arteries should be traced from its origin to its supplying renal parenchymal areas to confirm its nature as a true renal artery. It is because overlying vessels anterior or posterior to the kidney could mimic renal arteries on three-dimensional images. All renal parenchymal perfusion areas of multiple renal arteries are enhanced on CTA and MRI. In contrast, renal parenchymal perfusion defects are depicted on coventional renal arteriography which catheterize only one of multiple renal arteries.
Main Differential Diagnoses
1.
Occlusion in a polar branch of the renal artery on conventional renal arteriography
When a polar branch of the renal artery is occluded, loss of renal parenchymal perfusion is depicted on conventional renal arteriography, mimicking findings of multiple renal arteries. Nonetheless, careful assessment and recognition of the occluded branch itself with cupping appearance at the occlusive site or abrupt nonvisualization of distal part beyond the occlusive point suggest its nature as vascular occlusion by thromboembolism. Furthermore, the remaining opacification of the proximal part of an occlusive vessel is usually recognized at the same time.
2.
Avascular mass lesion located in a renal pole depicted on conventional renal arteriography
A mass lesion of avascular nature located in a renal pole could appear as lack of contrast medium enhancement in the corresponding part of the kidney. Nonetheless, the anatomical location of a mass lesion is, in general, not consistent with the vascular territory of the renal arteries but occupying an oval or round region in the renal parenchyma. Furthermore, a mass lesion of considerate sizes would have mass effect on the adjacent renal arterial branches as well as on the renal pelvicalyceal system, which could be usually depicted on conventional renal arteriography.
6.2 Two Right Renal Veins
Case 4
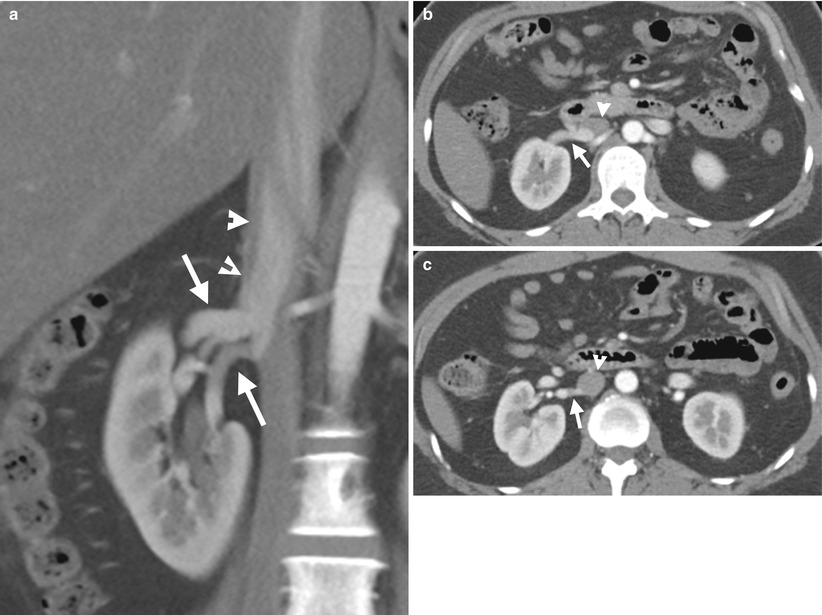
Fig. 6.4
Two right renal veins are depicted on enhanced computed tomography (CT) of corticomedullary phase. Figure 6.4a, coronal CT image shows two right renal veins (arrows): main renal vein cranially located and accessory renal vein caudally located. Note the anatomical closeness of the two right renal veins. Both right renal veins drain into the inferior vena cava (IVC) (arrowheads) separately. Figure 6.4b, axial CT image shows the main right renal vein (arrow) entering into the inferior vena cava (arrowheads). Figure 6.4c, axial CT image, 0.3 cm caudal to Fig. 6.4b, shows the accessory right renal vein (arrow) draining into the inferior vena cava (arrowhead). Note the larger size of the main renal vein as compared to that of the accessory renal vein.
Case 5
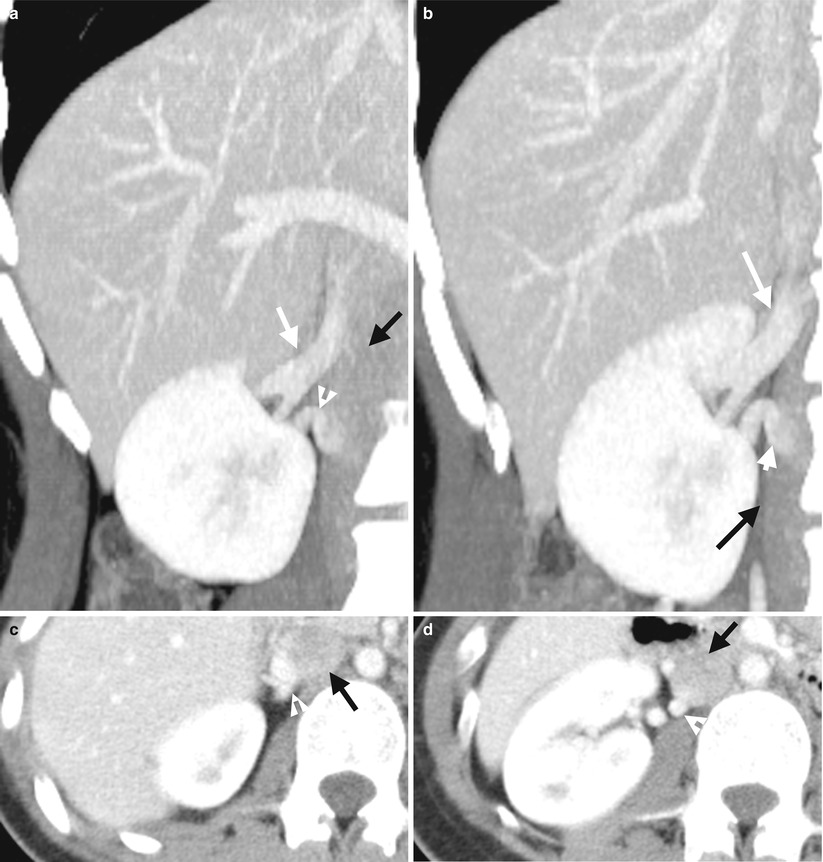
Fig. 6.5
Enhanced computed tomography (CT) of corticomedullary phase shows two right renal veins in another patient. Figure 6.5a, oblique coronal enhanced CT image shows a cranially (white arrow) and another caudally (arrowhead) located right renal vein draining into the inferior vena cava (IVC (black arrow). Figure 6.5b, coronal enhanced CT image shows similar imaging findings of two right renal veins: main cranial (white arrow) and accessory caudal (arrowhead) ones. Both renal veins entered into the IVC (black arrow). Figure 6.5c, axial enhanced CT image shows the main cranial right renal vein (arrowhead) entering into the IVC (black arrow). Figure 6.5d, axial enhanced CT image shows the entrance point of the caudal accessory right renal vein (arrowhead) into the IVC (black arrow).
Key Diagnostic Features
Similar to multiple renal arteries, the diagnosis of two right renal veins on images depends on the depiction of two right renal veins draining on different parts of the right kidney and entering into the inferior vena cava (IVC) at different entry points. A careful assessment to confirm absence of any venous connection between the kidney and the IVC should be done to make a correct diagnosis. On the other hand, two right renal veins could be undetected or ignored if they are anatomically close to each other. A coronal reformat image is usually helpful to confirm that they are two separate veins. A thin reconstruction section thickness on CT or magnetic resonance imaging (MRI) is also necessary to depict two renal veins running in parallel of small vertical distance.
6.3 Retroaortic Left Renal Vein
Case 6
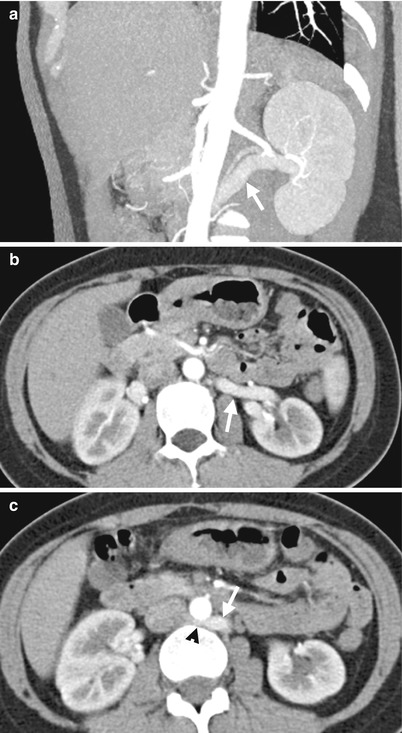
Fig. 6.6
Enhanced computed tomography (CT) shows features of retroaortic left renal vein. Figure 6.6a, oblique coronal CT image with contrast medium enhancement shows the left renal vein (arrow) from the left renal hilar area toward the abdominal aorta with a superior-lateral to inferior-medial course. Figure 6.6b, enhanced axial CT at the left renal hilar level shows the left renal vein (arrow) more posteriorly located than normal. Figure 6.6c, enhanced axial CT, 1 cm caudal to Fig. 6.6b, shows the retroaortic part (arrowhead) of the left renal vein (arrow) when it enters into the inferior vena cava.
Key Diagnostic Features
Retroaortic left renal vein is diagnosed on images by identifying the retroaortic course of the left renal vein in contrast to its normal anteroaortic course. The retroaortic part of the left renal vein is usually more caudally located than a normal preaortic left vein, which drains to the inferior vena cava at the lower lumbar portion and occasionally into the iliac vein [1]. Retroaortic left renal vein occurs in about 2–3 % of patients [1]. Most left retroaortic veins are asymptomatic and are found as incidental findings.
Main Differential Diagnoses
1.
Circumaortic left renal vein
The difference between circumaortic left renal vein and retroaortic left renal vein lies on whether there is another anteroaortic left renal vein accompanying a retroaortic left vein. If there is an additional anteroaortic left renal vein, then circumaortic left renal vein should be diagnosed instead of retroaortic left renal vein.
6.4 Circumaortic Left Renal Veins
Case 7
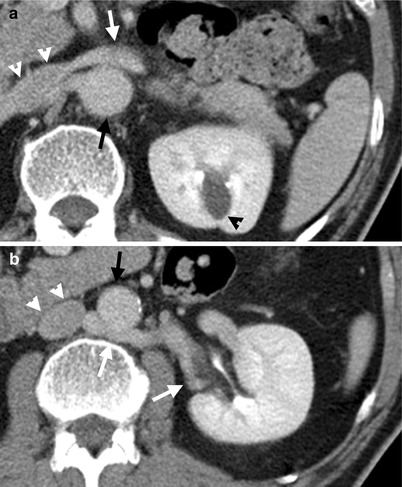
Fig. 6.7
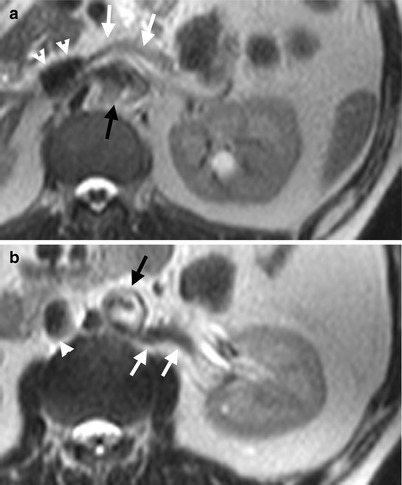
Fig. 6.8
Circumaortic left renal veins are depicted on enhanced computed tomography (CT) and magnetic resonance imaging (MRI) of T2-weighted images (T2WI). Figure 6.7a, axial CT image shows a left renal vein (white arrow) going into the inferior vena cava (white arrowheads) crossing anteriorly to the aorta (black arrow). There is a left renal cyst (black arrowhead). The course of this renal vein is identical to that of a normal left renal vein. Figure 6.7b, axial CT image, caudal to Fig. 6.7a, shows another left renal vein (white arrows) going into the inferior vena cava (white arrowheads) beneath the aorta (black arrow). Figure 6.8a, axial T2WI MRI shows similar pictures as that of Fig. 6.7a. The left main renal vein (white arrows) goes anterior to aorta (black arrow) before its entrance into the inferior vena cava (white arrowheads). Figure 6.8b, axial T2WI MRI shows an accessory left renal vein (white arrows) located posterior to the aorta (black arrow) before its entrance into the inferior vena cava (white arrowhead).
Key Diagnostic Features
Circumaortic left renal veins are diagnosed on images by the presence of two renal vein components: one has a preaortic course as that of a normal left renal vein and another has a retroaortic course [1]. The aorta is thus surrounded by two left renal vein components as the name “circumaortic left renal veins” implies. The presence of an additional left renal vein is easily ignored when reading images because of depicting the presence of a normal left renal vein anterior to the aorta. Axial images of CT and MRI are usually more useful in illustrating anterior or posterior relationships and the courses of the two left renal veins to the aorta than coronal or sagittal images do.
6.5 Nutcracker Phenomenon and Syndrome
Case 8
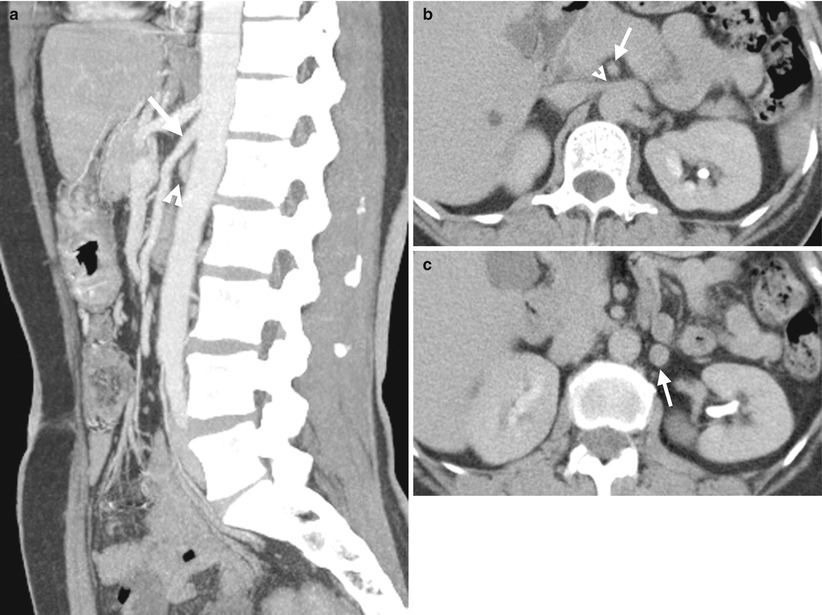
Fig. 6.9
Computed tomography (CT) images illustrate narrowed aortomesenteric angle (AMA) in a patient of nutcracker syndrome. Figure 6.9a, enhanced sagittal CT images show a small angle formed by the superior mesenteric artery (SMA) (arrow) and aorta. The left renal vein (arrowhead) is of small caliber in this angle. Figure 6.9b, enhanced axial CT image shows narrowing (arrowhead) of the left renal vein going through the superior mesenteric artery (arrow) and aorta. Figure 6.9c, axial CT image shows dilatation of the left gonadal vein (arrow).
Case 9
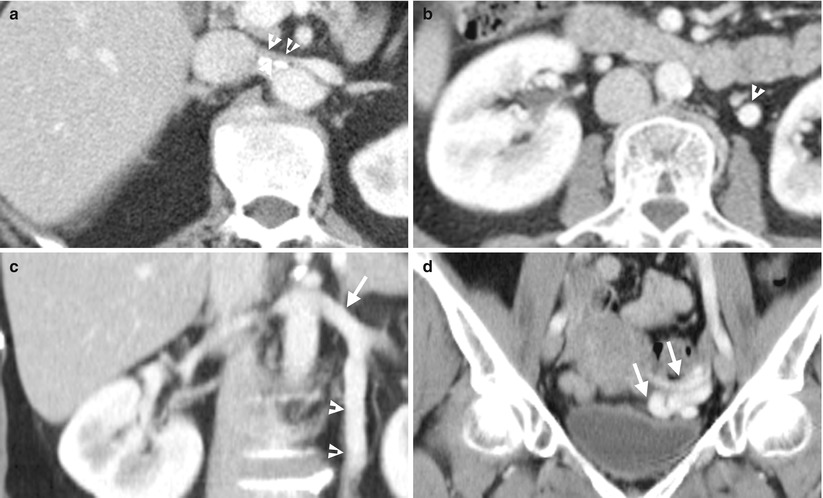
Fig. 6.10
Enhanced computed tomography (CT) shows imaging features of nutcracker syndrome in a woman. Figure 6.10a, enhanced axial CT image shows obvious narrowing (arrowheads) of the lumen of the left renal vein between and after passing through the aorta and superior mesenteric artery. Figure 6.10b, enhanced axial CT image shows a dilated left ovarian vein (arrowheads). Figure 6.10c, enhanced coronal CT image shows the lumen size of the left ovarian vein (arrowheads), which is similar to that of left renal vein (arrow). Figure 6.10d, enhanced coronal CT image shows a tuft (arrows) of dilated left ovarian vein.
Case 10
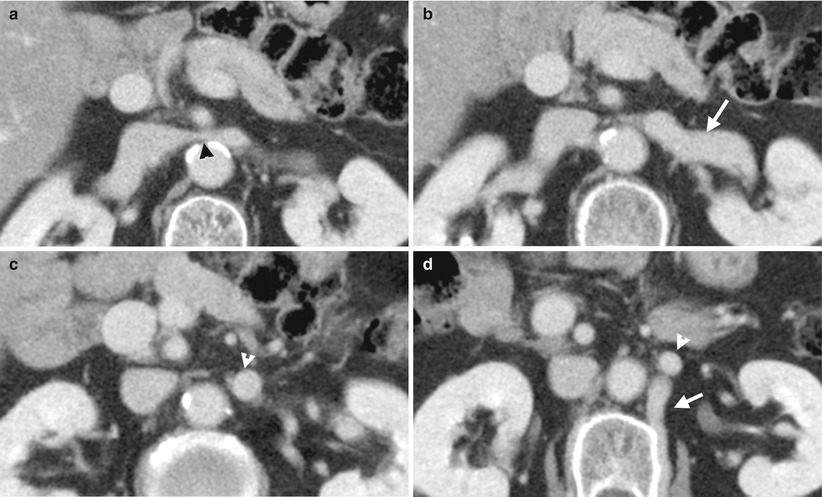
Fig. 6.11
Enhanced computed tomography (CT) illustrates imaging characteristics of nutcracker syndrome. Figure 6.11a, axial CT image shows abrupt narrowing (black arrowhead) of the left renal vein between the superior mesenteric artery and aorta. Figure 6.11b, axial CT image shows large caliber of the left renal vein (white arrow) before its passing through the superior mesenteric artery and aorta. Figure 6.11c, axial CT image shows large size of the left ovarian vein (white arrowheads). Figure 6.11d, axial CT image shows the left ovarian vein (white arrowheads). The lumbar collateral vein (white arrow) is dilated.
Key Diagnostic Features
Nutcracker phenomenon describes narrowed caliber of the left renal vein between the aorta and the superior mesenteric artery (SMA) [2]. However, many patients undergoing CT have an imaging appearance of nutcracker phenomenon and are asymptomatic. The aortomesenteric angle (AMA) is the angle between aorta and superior mesenteric artery. Smaller AMA has been thought to be associated with nutcracker phenomenon, despite the high variability of AMA reported in patients with nutcracker phenomenon and normal controls. If the patient is symptomatic, then nutcracker syndrome is called [2]. The compression effect on the left renal vein may result in left renal vein hypertension and cause hematuria, flank pain, or back pain. Compression is more common in very skinny patients. An elicitation of the patient’s history is important for clarification of symptoms and signs. By imaging studies, the presence of a dilated gonadal vein or varicoceles in addition to nutcracker phenomenon implies high probability of left renal vein hypertension. Measurement of a pressure gradient ≧3 mmHg via left renal venography may diagnose left renal vein hypertension [1].
6.6 Left Side Inferior Vena Cava
Case 11
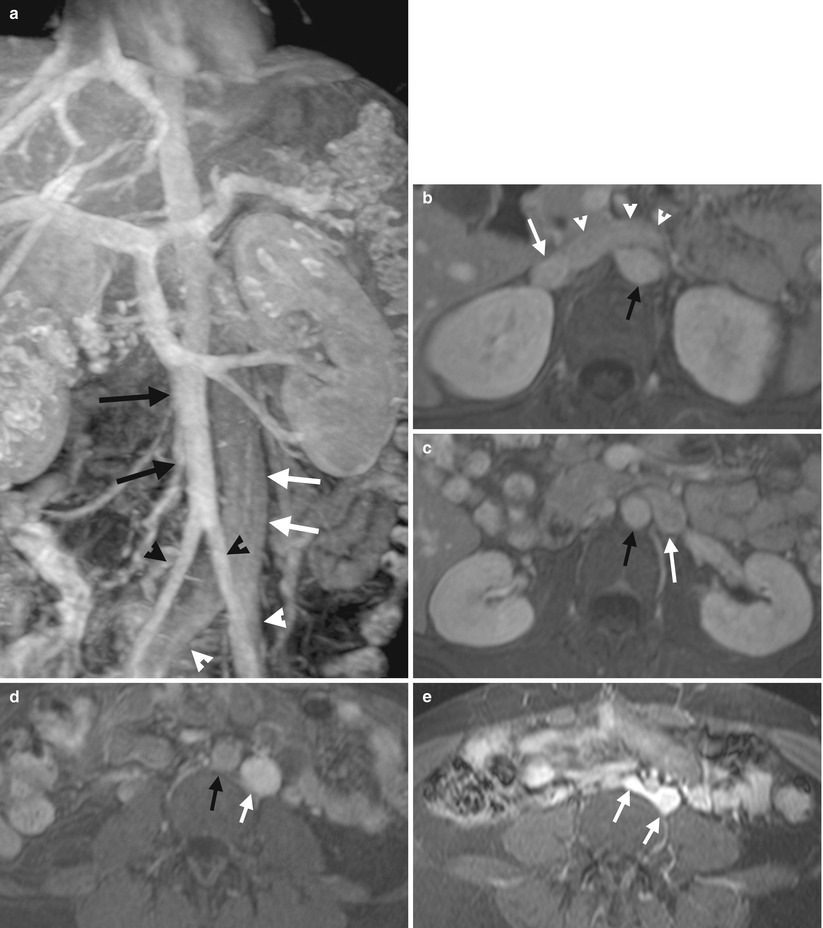
Fig. 6.12
Coronal and serial axial enhanced magnetic resonance imaging (MRI) shows a left side inferior vena cava (IVC). Figure 6.12a, coronal enhanced MRI of T1-weighted image (T1WI) with fat suppression (T1FS) shows an IVC (white arrows) parallel and left side to the abdominal aorta (black arrows). Both common iliac veins (white arrowheads) join to form the IVC. The abdominal aorta divides into bilateral common iliac arteries (black arrowheads). Note the right common iliac artery is located at the right side of the right common iliac vein and similarly for the left common iliac artery. Figure 6.12b, axial enhanced MRI with T1FS shows left renal vein (white arrowhead) from IVC (white arrow), which crosses midline and anterior to the abdominal aorta (black arrow). Figure 6.12c, enhanced T1FS MRI, caudal to the left renal vein level, shows a IVC (white arrow) left lateral to the aorta (black arrow) without visualization of a normal right-sided IVC. Figure 6.12d, enhanced T1FS MRI of the lower abdomen shows the IVC (white arrow) remaining parallel to and left side to the abdominal aorta (black arrow). Figure 6.12e, enhanced T1FS MRI at the level of iliac vascular bifurcation shows bilateral common iliac veins (white arrows) forming the left IVC.
Case 12
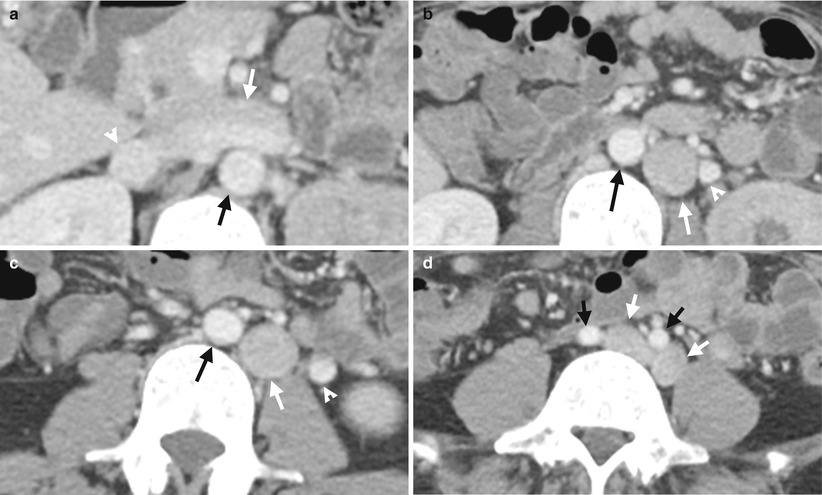
Fig. 6.13
Serial computed tomography illustrates features of the left side inferior vena cava (IVC). Figure 6.13a, axial CT image at the left renal upper pole level shows a left renal vein (white arrows) going into the inferior vena cava (white arrowhead), which is right sided to the aorta as normal. Note the large size of the left renal vein. Figure 6.13b, axial CT image, caudal to Fig. 6.13a, at midportion of the left kidney level shows an IVC (white arrow), which is located left side of the aorta (black arrow). Figure 6.13c, axial CT image at the left renal lower pole shows the IVC (white arrow) remaining left lateral to the aorta (black arrow). Note the left gonadal vein (arrowheads) has a parallel course as that of IVC in Fig. 6.13b, c. Figure 6.13d, axial CT image at the iliac crest level shows bilateral common iliac veins (white arrows) which are left to ipsilateral common iliac arteries (black arrows), respectively.
Key Diagnostic Features
Left side IVC is diagnosed based on its left-sided location relative to the aorta upon imaging. The IVC is normally located right side of the aorta. As bilateral common iliac veins enter into the IVC, recognition of their anatomical relationships to the IVC is important for confirming the true presence of left side IVC. Furthermore, recognition of the absence of a normal right side IVC on images alerts the readers to search the exact location of IVC. Reading serial images is usually necessary and sufficient to localize a left side IVC by confirming its continuation and route. Both CT and MRI are useful for making a correct diagnosis.
Main Differential Diagnoses
1.
A prominent left gonadal vein
A left gonadal vein having a large size is sometimes confused with a left side IVC on images. However, there are several key points for their differentiation. First, left gonadal vein drains from the left ovary or left testis, and left side IVC continues with bilateral common iliac veins. Second, recognition of a normal right side IVC excludes the diagnosis of a left side IVC, although double IVC is another differential diagnosis in this situation.
6.7 Double Inferior Vena Cava
Case 13
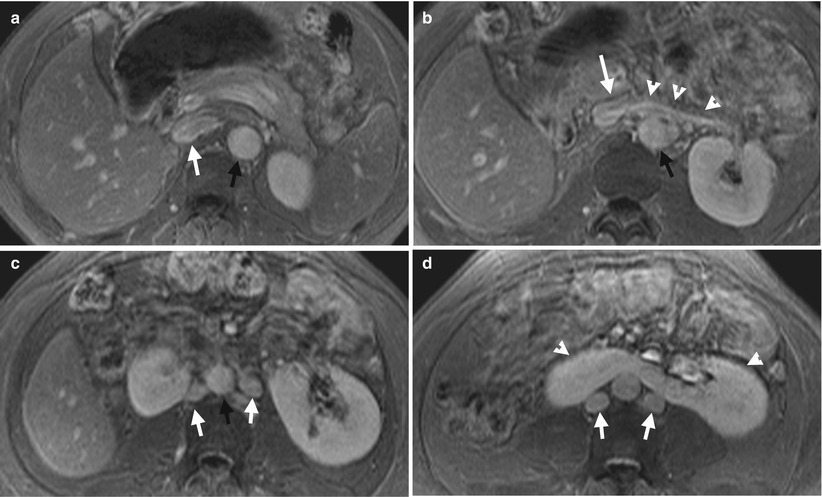
Fig. 6.14
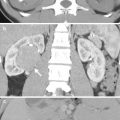
Serial enhanced magnetic resonance imaging (MRI) using fat-suppressed T1-weighted images (T1FS) illustrates double inferior vena cava (IVC) and horseshoe kidney. Figure 6.14a, axial T1FS MRI at the left renal upper pole level shows an IVC (white arrow) located at the right side of the abdominal aorta (black arrow). Figure 6.14b, axial T1FS MRI, at the left renal vein level, shows the left renal vein (white arrowheads) going into the right side IVC (white arrow). Figure 6.14c, axial MRI of T1FS at midportion of the left kidney level shows two IVCs (white arrows) paralleling to the abdominal aorta. Figure 6.14d, axial MRI of T1FS, at the left renal lower pole level, shows medial fusion of both kidneys (white arrowheads) at lower poles. Two IVCs (white arrows) are located posterior to the horseshoe kidney.
Case 14
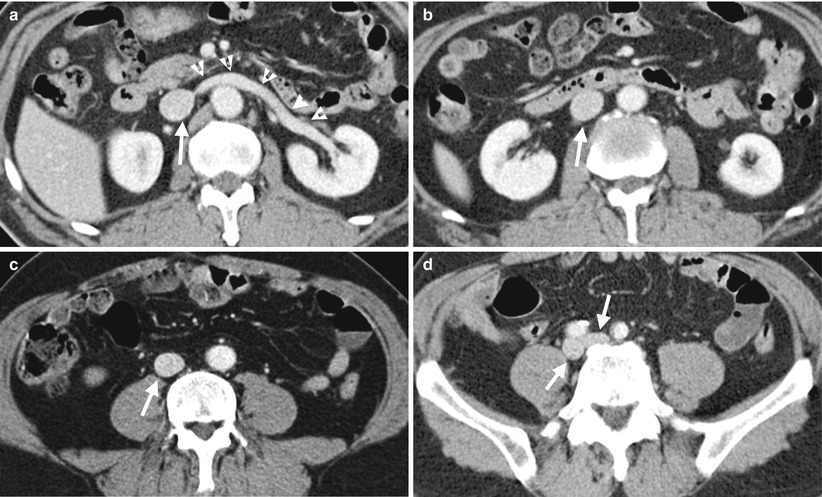
Fig. 6.15
Serial enhanced computed tomography (CT) shows a normal location of IVC at the right side of the abdominal aorta. Figure 6.15a, enhanced CT shows left renal vein (arrowheads) draining the IVC (white arrows). Figure 6.15b, enhanced CT at the left renal midportion level shows a normal right side IVC (white arrow). Figure 6.15c, enhanced CT at the lower abdominal level shows a normal right side IVC (white arrow). Figure 6.15d, enhanced CT at the iliac fossa level shows bilateral common iliac veins (white arrows) located right posteriorly to the ipsilateral common iliac arteries, respectively.
Key Diagnostic Features
Double IVC is diagnosed by the presence of two IVCs: one located at the right side of the aorta and another at the left side of the aorta. The right IVC is in continuity with the right common iliac vein and left IVC to the left common iliac vein. By recognition of the presence of two IVCs with continuity to the ipsilateral common iliac veins on serial axial or coronal images of computed tomography or MRI, one could make a correct diagnosis without difficulty. In short, double IVC is the presence of a left side IVC in addition to a normal right side IVC. If readers are familiar with normal anatomy and pictures of IVC, renal veins and common iliac veins, then indentification of double IVCs on images could be achieved. Horseshoe kidney is associated with vascular abnormalities.
Main Differential Diagnoses
1.
A prominent left gonadal vein
A left gonadal vein having a large size is sometimes also confused with double IVCs on images. Nonetheless, the identification of left gonadal vein draining from the left ovary or left testis provides the clue for differentiation from the left side IVC part in a patient having double IVCs.
6.8 Circumcaval Ureter (Retrocaval Ureter)
Case 15
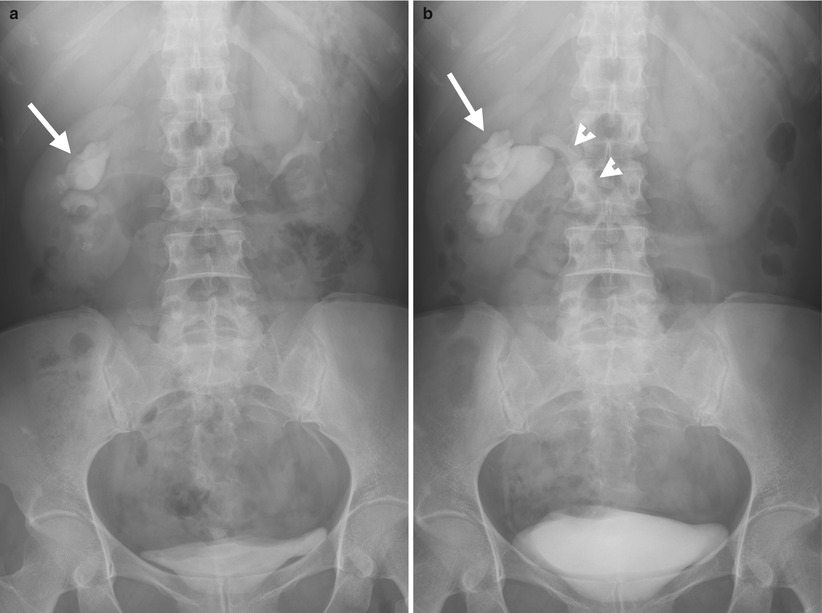
Fig. 6.16
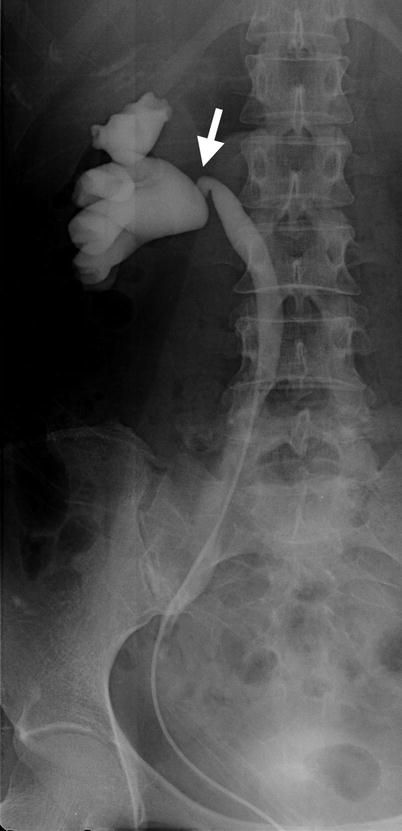
Fig. 6.17
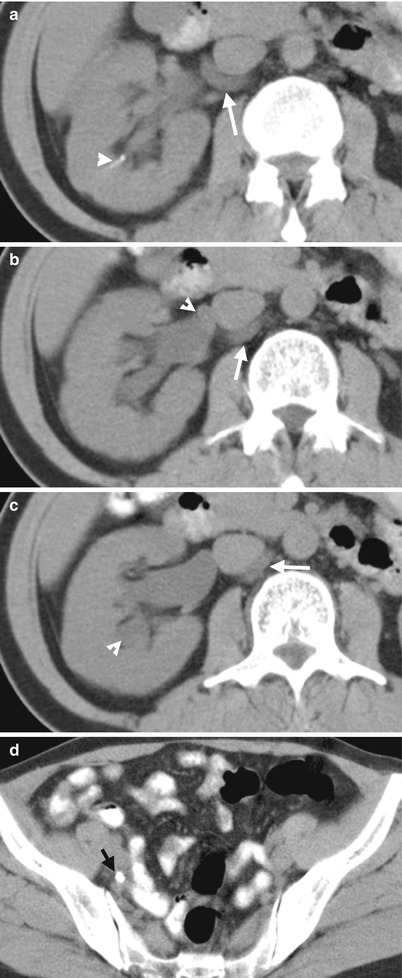
Fig. 6.18
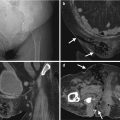
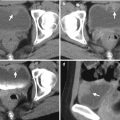
Excretory urography (EU), retrograde pyelography (RP), and computed tomography (CT) illustrate imaging features of a circumcaval ureter. Figure 6.16a, EU at 10 min after contrast medium administration shows delayed opacification of the right urotract with right hydronephrosis (arrow). The right ureter is not opacified. Figure 6.16b, EU at 30 min after contrast medium administration shows opacification of the dilated right renal collecting system (arrow) and right proximal ureter (arrowhead). Note the right proximal ureter has an abrupt medial deviation course. Figure 6.17, right RP shows an abnormal course (arrow) of the most proximal part of the right ureter before its passage behind the inferior vena cava (IVC). The right proximal ureter then goes medially abruptly and becomes medial to the right pedicle at the L4 body level. Figure 6.18a, unenhanced axial renal CT image shows the right proximal ureter (arrow) coursing from a medial position to a posterior position of the inferior vena cava (IVC). There is a right renal calyceal stone (arrowhead). Figure 6.18b, unenhanced axial renal CT image, 0.5 cm caudal to Fig. 6.18a, shows the most proximal segment of the right ureter (arrow) located medial to the IVC and another segment (arrowhead) going from posterior to posteromedial position relative to the IVC. Figure 6.18c, unenhanced axial renal CT shows the right proximal ureter (arrow) coursing from the posteromedial to medial side of the IVC. There is dilatation of right calyces (arrowhead). Figure 6.18d, unenhanced axial CT at the pelvic cavity shows a right middle ureteral stone (arrow), accounting for right urotract obstruction.
Related posts:
Stay updated, free articles. Join our Telegram channel

Full access? Get Clinical Tree


