Criteria
Measurement
Score
Heterogeneity (HET)
None
0
Mild
1
Moderate
2
Marked
3
Cyst formation/necrosis (CN)
None
0
Equivocal
1
Yes
2
Hemorrhage (HEM)
None
0
Equivocal
1
Yes
2
Crossing midline (CM)
None
0
Equivocal
1
Yes
2
Edema and/or mass effect (EM)
None
0
Mild
1
Moderate
2
Severe
3
Definition of border (BD)
Well defined
0
Poorly defined
1
Flow void (FV)
None
0
Equivocal
1
Yes
2
Degree of contrast enhancement (CE-D)
None
0
Slight
1
Moderate
2
Marked
3
Heterogeneity of contrast enhancement (CE-HET)
None
0
Homogenous
1
Heterogeneous
2
Response Assessment Criteria
The best evaluation for the treatment of tumors is based on patient survival. In those with recurrent disease, progression-free survival (PFS) through radiologic assessment serves as a reliable marker. Any recorded change in tumor size as a result of treatment typically corresponds with duration of survival. With the emergence of anticancer therapies, standardization of radiographic assessment became essential to reliably monitor therapeutic response.
In 1979, the World Health Organization (WHO) published the first major set of criteria to measure the response rate that was subsequently followed by the Response Evaluation Criteria in Solid Tumors (RECIST) in 2000 and RECIST 1.1 in 2009 [20]. In general, the response rate is based on how the tumor shrinks anatomically. However, this requires serial measurements of tumor burden that can be both costly and tedious for both patient and investigator. As found in both WHO and RECIST, this change is defined by either having a complete response, partial response, stable disease, or progressive disease. Unfortunately, interpretation of these findings remains challenging because certain therapies may not shrink tumor size, but may be successful in preventing progression associated with good outcome (i.e., patient survival).
World Health Organization (WHO) Criteria
In 1979, the WHO attempted to standardize treatment response assessment [21]. The WHO criteria entail measuring the tumor size based on the product of the bidimensional measurement of tumors (i.e., greatest perpendicular dimensions; Fig. 10.1a–d), summing these dimensions over all tumors, and then categorizing changes in these summed products as follows:
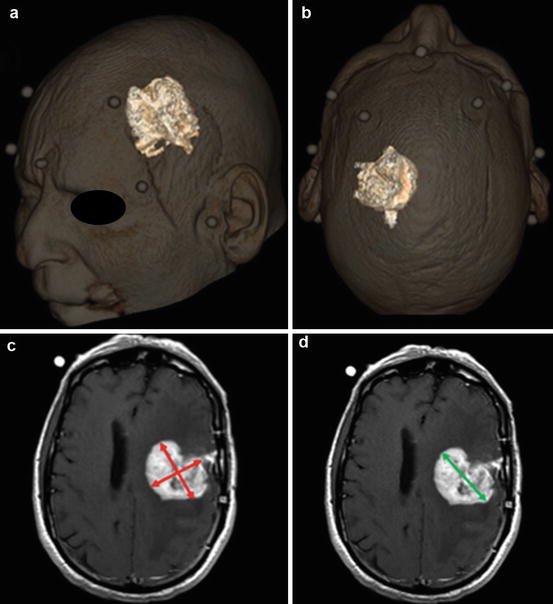
Fig. 10.1
Measurement of tumor size in a patient with a glioblastoma. (a, b) 3D volume rendered measurement of tumor volume. Measurement can be done manually by selecting or “painting” the tumor on multiplanar sequential images or by semiautomated methods by manually placing a seed within the tumor and using a seed growing algorithm to determine tumor volume. (c) WHO criteria uses a 2-dimensional measurement, i.e., the maximum cross product of perpendicular measurements (red lines). (d) RECIST use a unidirectional measurement, i.e., the longest axis (green line)
Complete response: Tumor has disappeared for at least 4 weeks.
Partial response: 50 % or greater reduction in sum of tumor size products from baseline, confirmed at 4 weeks.
Stable disease: Neither partial response nor complete response nor progressive disease.
Progressive disease: At least a 25 % increase in tumor size in one or more lesions, with no complete response, partial response, or stable disease documented before increase in size, or development of new tumor sites.
With the WHO criteria there is a slight bias toward categorizing the response as “progressive disease” because small (11 %) increases in the perpendicular dimensions will yield a 25 % increase in the product. Additionally, the WHO criteria are ambiguous regarding how many tumor foci should be measured, how small a lesion could be measured, and how progression should be defined. Still, the WHO criteria are used currently in some trials and were used to define clinical response rates for two decades. While the criteria is not commonly used today, understanding the WHO response criteria is essential for comparing current studies with ones from the past.
RECIST 1.0
The RECIST 1.0 were originally published in 2000 in recognition of the limitations of the WHO criteria [21]. The criteria were designed to serve as an end point for clinical trials that assess tumor treatments. RECIST provides guidelines regarding how many lesions to assess. The most significant difference is the use of a unidimensional measurement as opposed to the bidirectional cross product stated in the WHO criteria. RECIST 1.0 specifies assessment of up to ten target lesions (no more than five per organ) by measuring the single longest dimension of the tumor (Fig. 10.1a–d). The sum of these unidimensional measurements is used as the metric for determining response [21].
RECIST also distinguishes “measurable” and “nonmeasurable” tumors. Using spiral CT with 5 mm or thinner slices, the minimum “measurable” lesion to be assessed is 1 cm (using conventional CT the minimum is 2 cm). Lesions of adequate size for measurement are described as “measurable.” RECIST also use the designations “target” and “nontarget” lesions. All “target” lesions are measurable while only some nontarget lesions are measurable (Fig. 10.2a–c). However, both types of lesions can contribute to disease progression and to complete response. Target lesions are to be selected based on their size and suitability for accurate repeated measurements up to a total of ten lesions, but no more than five per organ. All other lesions or sites of disease should be identified as “nontarget” lesions and recorded at baseline. For RECIST 1.0, measurements of these “nontarget” lesions are not required, but the presence of each should be noted throughout the follow-up.
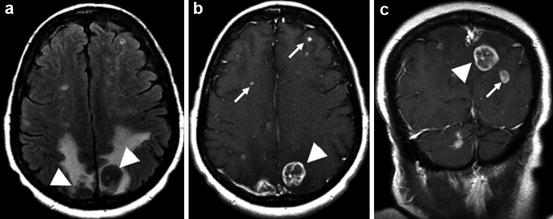
Fig. 10.2
Example of metastatic disease. (a) T2 FLAIR; extensive vasogenic edema surrounds two posterior parietal metastases (arrowheads). (b, c) Post-gadolinium T1WI; examples of target lesions that are measurable (arrowheads) and nontarget lesions (arrows) that are not measurable, but should be followed
The RECIST categories for response include:
Complete response: Disappearance of all tumor foci for at least 4 weeks
Partial response: A decline of at least 30 % in tumor diameters for at least 4 weeks
Stable disease: Neither partial response nor progressive disease
Progressive disease: At least a 20 % increase in the sum of all tumor diameters from the lowest tumor size
The RECIST are much more stringent than the WHO criteria for progressive disease. As a result, the time to disease progression can be shorter with the WHO criteria than with RECIST using the same data. In other instances, such as when new lesions are noted, the WHO and RECIST 1.0 yield the same conclusions.
RECIST 1.1
In 2009, the RECIST were modified based on data and outcomes from a variety of clinical trials [22]. In RECIST 1.1, fewer lesion assessments were found to yield better concordance of response classifications. In randomized studies for tumor progression, RECIST 1.1 suggests that as few as three lesions may be used. This potentially reduces the number of measurements by as much as much as 70 % compared to RECIST 1.0.
Notable revisions in RECIST 1.1 include [22]:
Measurability: Longest dimension in the plane of measurement with a minimum size of 10 mm by CT and MRI (no less than double the slice thickness).
Lymph node assessment: Normal if short axis <10 mm, “measurable” if short axis ≥15 mm, and “nonmeasurable” if short axis is 10–15 mm. (RECIST 1.0 made no specific recommendations for lymph nodes.)
Cystic lesions: Simple cysts are not considered malignant. Complex cystic lesions are “nonmeasurable” lesions. Cystic metastases can be considered “measurable” lesions. (In RECIST 1.0 all cystic lesions were considered non measurable.)
Measurable disease at baseline: In studies where the primary end point is tumor progression, the protocol must specify if entry is restricted to those with measurable disease or whether patients having nonmeasurable disease only are also eligible.
Baseline: All lesions up to a maximum of five lesions (2 per organ) are target lesions. (RECIST 1.0 states a maximum of 10 lesions, 5 per organ.)
Complete response: Pathologic lymph nodes must reduce to <10 mm. (RECIST 1.0 did not address lymph nodes.)
Progressive disease: There must be a 20 % increase in size and a minimum of 5 mm increase over the smallest recorded size since the treatment started. (RECIST 1.0 did not require an absolute increase in size.)
Too small to measure: Target lesions that become difficult to assess on CT are reported as “too small to measure” and a value of 5 mm should be assigned (not addressed in RECIST 1.0).
Lesions that split: The longest diameters of the fragmented portions should be added together to calculate the target lesion sum (not addressed in RECIST 1.0).
PET: FDG-PET can complement CT scanning to assess new lesions (not addressed in RECIST 1.0).
Lesion reappearance: In the setting of complete response, reappearance of a lesion would be considered progressive disease (not addressed in RECIST 1.0).
Currently, RECIST 1.1 will be used in virtually every clinical trial of new solid tumor therapeutics because regulatory agencies have accepted RECIST as the standard in response assessment for clinical trials [20, 22]. It is important to note that response measurements using the WHO, RECIST 1.0, and RECIST 1.1 are not identical and therefore do not produce identical results. However, there exists good concordance among one-dimensional measurements of RECIST, two-dimensional measurements (e.g., WHO), and volumetric measurements (Fig. 10.1a–d). Three-dimensional measurements appear to be inferior to these other criteria.
Macdonald Criteria
While RECIST has become an almost universal standard for solid tumor response, an exception exists for high-grade gliomas. Currently, the Macdonald criteria remain the most widely used standard to evaluate tumor response in clinical studies of high-grade gliomas [23].
In 1990, the Macdonald criteria were published for the response assessment of high-grade gliomas [24]. The Macdonald criteria was developed using the same two-dimensional WHO measurements of tumor size (i.e., the product of the maximal cross-sectional enhancing diameters of the tumor). Although the criteria were originally developed for CT, they have been extended for use in MRI that is the current methodology of choice for tumor assessment.
The response assessment in neuro-oncology (RANO) working group has recently proposed a 2010 updated response criteria to enhance the interpretation of clinical trials involving novel agents [23]. The RANO working group recognized that there is a great deal of heterogeneity of high-grade gliomas and difficulty in measuring some lesions. As a result, the proposed update recommends that between two and five lesions be measured with emphasis put on selecting the largest lesions that allow for reproducible and repeated measurements. Readers should refer to the review by Wen [23] for a detailed description of the proposed updated response criteria. The following is a brief summary of the proposed changes:
Updated definitions of radiographic response [23]:
Complete response: Requires all of the following:
Complete disappearance of all enhancing measurable and nonmeasurable disease sustained for at least 4 weeks
No new lesions
No corticosteroids
Stable or improved clinically
Partial response: Requires all of the following:
50 % decrease compared with baseline in the sum of products of perpendicular diameters of all measurable enhancing lesions sustained for at least 4 weeks
No new lesions
Stable or reduced corticosteroid dose
Stable or improved clinically
Stable disease: Requires all of the following:
Does not qualify for complete response, partial response, or progression
Stable clinically
Progression: Defined by any of the following:
25 % increase in sum of the products of perpendicular diameters of enhancing lesions
Any new lesion
Clinical deterioration
Updated criteria for entry into clinical trials for recurrent high-grade glioma [23]:
Patients are required to have a 25 % increase in the sum of the products of perpendicular diameters of contrast-enhancing lesions while on stable or increasing doses of corticosteroids.
New contrast-enhancing nonmeasurable disease in trials for which progression-free survival is the primary end point.
Criteria for determining first progression [23]:
Patients should be excluded from clinical trials for recurrent disease if they received radiotherapy within 12 weeks unless the progression is outside the radiation field (i.e., beyond the high-dose region or 80 % isodose line) or the disease is confirmed by pathology.
12 weeks after chemoradiotherapy completion, progressive disease is defined by:
New contrast-enhancing lesion outside the radiation field
Increase ≥25 % in the sum of the products of the perpendicular diameters between scans 12 weeks apart on stable or increasing doses of corticosteroids
Clinical deterioration not attributable to medication or comorbid conditions
Sufficient to declare progression
Not valid for entry into clinical trial
Significant increase in T2/FLAIR non-enhancing lesions for those receiving antiangiogenic therapies on stable or increasing doses of corticosteroids. Cannot be the result of comorbid events
Limitations of Response Criteria
Each of the response criteria suffers from limitations. For example, irregularly shaped tumors are difficult to measure. Furthermore, there are no guidelines on how to select lesions or assess multifocal tumors which greatly affects inter-rater reliability. Each criteria published does not assess non-enhancing tumors. There is also a bias to classify disease as progressive because any significant increase in size of the contrast-enhancing component signifies a tumor progression, which will alter therapy. However, contrast enhancement is nonspecific and can be influenced by medications such as corticosteroids and antiangiogenic agents. Additionally, postsurgical changes, radiation effects, and inflammation all increase enhancement but do not signify an increase in tumor burden. The most commonly experienced limitations for standardization of response criteria are discussed in the following sections.
Pseudoprogression
Radiotherapy with concurrent and adjuvant chemotherapy such as temozolomide is currently part of the standard treatment for GBMs [25]. In 20–30 % of patients, MRI following the first radiotherapy session will show increased contrast enhancement that eventually subsides without any change in therapy [25]. This phenomenon is termed pseudoprogression (Fig. 10.3a–f). It is thought to arise from a transient increase in the permeability of tumor vasculature following radiotherapy. Identifying pseudoprogression is critical to prevent the premature discontinuation of effective therapy. In clinical trials of patients with progressive disease, failure to identify and exclude patients with pseudoprogression will result in a falsely high response rate. That is, the therapy being investigated will be considered incorrectly to be active. PET utilizing 18F-FDG can be used to assist in differentiating tumor from radiation necrosis by determining relative glucose metabolism [26]. Potentially, MR perfusion showing elevated rCBV values may be indicative of recurrent tumor.
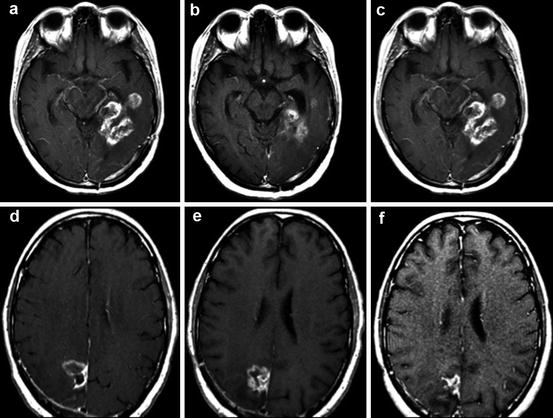
Fig. 10.3
Post-gadolinium T1WI images demonstrate a pseudoresponse (a, b, c) and pseudoprogression (d, e, f). (a) GBM prior to bevacizumab therapy; (b) after bevacizumab therapy demonstrating a pseudoresponse; (c) follow-up 3 months later demonstrating biopsy-proven true progression of disease; (d) GBM prior to temozolomide therapy; (e) after temozolomide therapy demonstrating pseudoprogression; (f) follow-up 3 months later showing regression of tumor off therapy
Enhancement as a Result of Therapy
Surgery often causes marginal enhancement 48–72 h after tumor resection making it difficult to distinguish postoperative changes from residual enhancing disease. Given the time window of postoperative enhancement, a baseline MRI scan should ideally be obtained within 24–48 h after surgery. This MRI scan should include diffusion-weighted imaging to determine whether new enhancement found in subsequent scans is the result of ischemia or tumor recurrence. Similar transient enhancements can be caused by chemotherapy wafers, immunotoxins delivered by convection-enhanced delivery, regionally administered gene and viral therapies, immunotherapies, focal irradiation with brachytherapy, and stereotactic radiosurgery. Unfortunately, no imaging modality, even diffusion-weighted MRI, has the specificity to conclusively differentiate recurrent tumor from treatment effects. If making this distinction were critical to clinical trials, surgical sampling would be necessary to obtain a definitive diagnosis.
Pseudoresponse/Pseudoregression
Pseudoresponse typically occurs after administration of antiangiogenic agents, such as those targeting vascular endothelial growth factor (VEGF) or VEGF receptor. These agents can produce a decrease in contrast enhancement between 24 and 48 h after administration. The decrease in enhancement is currently thought to be related to the normalization of permeable tumor vessels and it should not be mistaken to be a true anti-glioma effect. As a result, falsely interpreted high response rates due to pseudoprogression may yield only modest survival benefits. Treatments with therapies such as bevacizumab produce a dramatic improvement in tumor enhancement on MRI [27]. The effect is mostly on the blood-brain barrier as opposed to a true tumor response. The rapid speed of the response is suggestive of a change in vascular permeability as opposed to a reduction in tumor size. Studies demonstrate that agents that target VEGF or VEGF receptor may initially produce a reduction in tumor contrast enhancement, but subsequently these tumors have increasing non-enhancing signals on T2 FLAIR [23, 28]. Even though enlarging areas of non-enhancing tumor is indicative of infiltrative disease, current response criteria fail to measure non-enhancing components. Still, there are emerging data suggesting that the degree of initial response due to vascular normalization may also correlate with survival [28] (Fig. 10.3a–f).
Failure to Measure Non-enhancing Tumor
Because high-grade gliomas are infiltrative, they often contain regions without disruption of the blood-brain barrier and thus no enhancement on MRI. Unfortunately, most criteria do not account for the non-enhancing component of the tumor, which is particularly challenging for WHO grade II and grade III gliomas that frequently contain non-enhancing components. In higher-grade gliomas, patients that have an initial reduction in tumor enhancement may develop an increase in non-enhancing infiltrative tumor as visualized on T2-weighted scans. Abnormal T2 signal in the brain parenchyma is difficult to interpret because it may be caused by a host of factors including radiation effects, demyelination, changes in medication (e.g., decreased corticosteroids), ischemic injury, infection, postoperative changes, or other treatment effects. T2 signal changes that are suggestive of infiltrating tumor include associated mass effect (as determined by sulcal effacement, ventricular compression, and thickening of the corpus callosum), infiltration of the cortical ribbon, and location outside of the radiation field [23].
Neuroimaging of High-Grade Gliomas
Gliomas account for about half of all primary brain tumors in adults with an annual incidence of about five per 100,000 people [29]. They typically occur supratentorially in adults and infratentorially in children. There exists a simple histological grading system for gliomas based on nuclear atypia, mitoses, endothelial proliferation, and necrosis. High-grade gliomas have at least two of these features. High-grade gliomas are expansive and frequently extend beyond the tumor margins. Additionally, all high-grade gliomas show some amount of anaplasia and are subdivided into WHO grade III anaplastic astrocytomas (AA) and WHO grade IV glioblastoma multiforme (GBM) [29]. While CT can be used to differentiate tumor grade in some cases, MRI is the modality of choice due to better tissue contrast that aids in the assessment and grading of all brain neoplasms.
Anaplastic astrocytomas (AA) are infiltrating lesions in which about 75 % arise from low-grade gliomas while the remainder forms as a new primary neoplasm. Unlike GBMs, AAs lack necrosis and vascular proliferation. Instead, the presence of pleomorphic astrocytes and mitosis are characteristic of most AAs [29]. On imaging, AAs present as poorly defined heterogeneous lesions. On CT scans, typically there exists a hypodense area of peritumoral edema. When enhancement is present, it is nodular or heterogenous. On MRI, AAs can present with a range of findings better reflecting the variability in histology of AAs. T1WI shows a heterogenous isointense to hypointense lesion. High-signal areas on T2WI represent the tumor itself and a peritumoral vasogenic edema. On T1-weighted contrast scans there is usually patchy enhancement [30] (Fig. 10.4a–d).
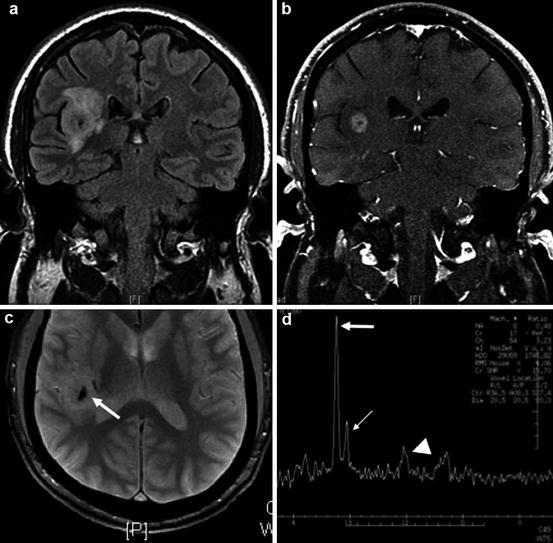
Fig. 10.4
Example of a grade III astrocytoma. (a) Coronal T2 FLAIR showing mass-like infiltrative T2 signal abnormality involving the insular cortex and subcortical white matter. (b) Post-gadolinium T1WI demonstrates central enhancement. (c) Foci of internal calcification are noted on the gradient-echo image (arrow). (d) MRS demonstrates an elevated choline to creatine (Cho:Cr) ratio of 3:1 characteristic of malignancy and a marked reduction of NAA, a normal neuronal marker (Cho, thick arrow; Cr, thin arrow; NAA, arrowhead)
GBMs are primary neoplasms in 60 % of cases, while the remainder arises from AAs. These tumors usually occur in subcortical white matter of the temporal (31 %), parietal (24 %), frontal (23 %), and occipital (16 %) lobes [31]. Brainstem gliomas can also occur, but they are rare and usually found in children secondary to transformation from a low-grade glioma. On imaging, necrosis is the hallmark of GBMs. On CT, GBMs appear as low-density lesions that are heterogenous due to necrosis, hemorrhage, and increasing cellularity. Additionally, edema can be found surrounding the tumor and extending along adjacent white matter tracts causing a mass effect. On contrast-enhanced CT, GBMs appear with heterogeneous ringlike enhancement and an irregular and nodular wall. On T1-weighted MRI, GBMs appear heterogenous and characteristically have a necrotic center, peritumoral edema, and a thick irregular margin. As with CT, post-contrast T1-weighted imaging shows irregular infiltrative enhancement. On T1WI, the necrotic center will appear hypointense, while an enhanced irregular border surrounds the mass. Any peripheral non-enhancing areas most likely represent vasogenic edema. It is important to note that the enhanced ring-like structure is not the true border of the tumor since malignant glioma cells can be found beyond a 2-cm margin. On T2WI, GBMs also appear heterogeneous due to necrosis, hemorrhage, or tumor vascularity. The rim of vasogenic edema is better appreciated on T2WI. Unfortunately, distinguishing tumor from edema is challenging due to similar signal characteristics on T2 [30] (Fig. 10.5a–d).
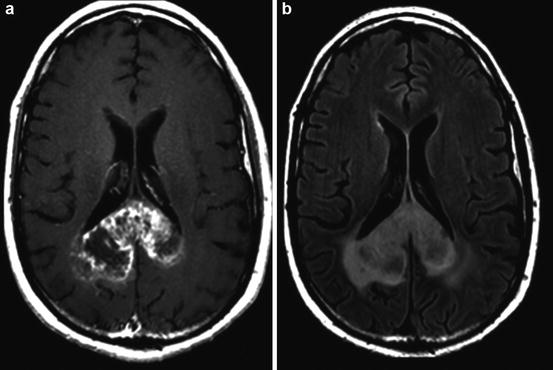
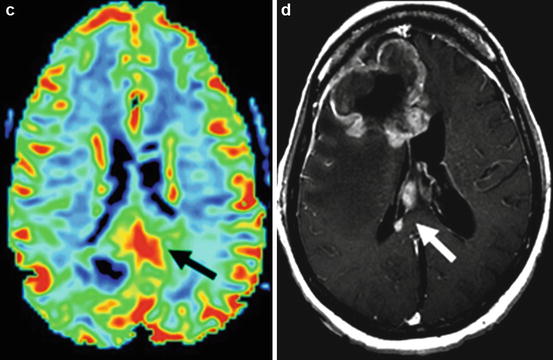
Fig. 10.5
Example of a grade IV glioblastoma. (a) Post-gadolinium T1WI shows a heterogeneously enhancing mass centered on the splenium of the corpus callosum; (b) T2W FLAIR imaging of the same patient demonstrates the corresponding mass-like T2 signal abnormality; (c) MR perfusion rCBV function map clearly shows elevated rCBV within the neoplasm (black arrow) indicating marked tumor neovascularity; (d) post-gadolinium T1WI of a different GBM patient demonstrates secondary leptomeningeal dissemination along the septum pellucidum (white arrow)
On DWI, ADC values have been shown to correlate with tumor cellularity and tumor grade. GBMs have high cellularity compared to lower-grade gliomas. The increased cellular density causes restricted diffusion in the extracellular space, which produces low ADC values. As a result, high-grade gliomas present as hyperintense lesions on DWI.
Anatomically, GBMs can spread along white matter tracts and cross hemispheres via the corpus callous (Fig. 10.5a–d). Other common pathways for dissemination include the optic radiations, the internal capsule, the anterior commissure, and posterior commissure. GBMs remain solitary lesions 99 % of the time. Rare multicentric tumors commonly spread via the meningeal-subarachnoid space and appear widespread throughout the brain without evidence of intracranial connections (those with some continuity are multifocal) [32]. They can also disseminate throughout the brain via subependymal, intraventricular, or direct penetration routes through white matter. To support its own tumor growth, GBMs undergo angiogenesis, which is a critical parameter to classify tumor grade.
Determination of the regional vascularity is an important parameter to grade gliomas. While contrast enhancement can indicate a disruption in the blood-brain barrier, it cannot reveal the vascularity of the tumor. Furthermore, as many as 33 % of high-grade gliomas demonstrate no significant contrast enhancement and 20 % of low-grade gliomas demonstrate contrast enhancement. Perfusion-weighted imaging can be used to assess the underlying vascularity of the tumor. Regional cerebral blood volume (rCBV) calculated from perfusion-weighted imaging is a sensitive marker of the microvasculature of tumor (Fig. 10.5a–d) [33]. Numerous studies show that rCBV correlates positively with tumor grade [33, 34]. Low-grade gliomas typically have rCBV value that range between 1.11 and 2.14, while high-grade gliomas range between 3.54 and 7.32 [35]. CBV mapping also has the added benefit of directing stereotactic biopsy sites to highly vascular areas so as to reduce sampling errors in histopathologic diagnosis of gliomas [33].
Studies suggest that MRSI through the calculation of metabolite ratios and levels can be helpful in grading tumors (Fig. 10.5a–d). Choline (Cho) is a cell membrane marker that increases during high rates of cell membrane turnover or proliferation; elevations in Cho commonly represent high-grade tumors. It is important to note that while low levels of Cho are typically associated with low-grade tumors, in GBMs with extensive necrosis, Cho levels may be low. Creatine (Cr), a marker for energy metabolism, is commonly low in high-grade tumors that consume energy due to increased metabolic activity. N-acetylaspartate (NAA), a marker for neuronal integrity, is also commonly low when high-grade tumors are present. In high-grade gliomas, lactate levels are increased after the tumor outgrows the blood supply and begins to utilize anaerobic glycolysis. Myoinositol, a glial cell marker, can also be used to distinguish high-grade and low-grade gliomas because GBMs tend to have low levels of this metabolite. Ratios of these metabolites, namely, Cho/Cr, NAA/Cr, and NAA/Cho, can aid in the grading of tumors [12, 18]. Table 10.2 summarizes MRSI findings useful in grading tumors.
Table 10.2
 Radiation Risks and Dosimetry Assessment
 Defining the Radiological Blinded Read and Adjudication
Imaging in Musculoskeletal, Metabolic, Endocrinological, and Pediatric Clinical Trials
Defining the Radiological Blinded Read and Adjudication
Imaging in Musculoskeletal, Metabolic, Endocrinological, and Pediatric Clinical Trials
 Nuclear Medicine: An Overview of Imaging Techniques, Clinical Applications and Trials
 The Metrics and New Imaging Marker Qualification in Medical Imaging Modalities
 Body Composition


MRSI in tumor grading
Related posts:
Radiation Risks and Dosimetry Assessment
Defining the Radiological Blinded Read and Adjudication
Imaging in Musculoskeletal, Metabolic, Endocrinological, and Pediatric Clinical Trials
Nuclear Medicine: An Overview of Imaging Techniques, Clinical Applications and Trials
The Metrics and New Imaging Marker Qualification in Medical Imaging Modalities
Body Composition
Stay updated, free articles. Join our Telegram channel
Full access? Get Clinical Tree
