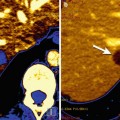
Fig. 5.1
Lung carcinoma in a 53-year-old man treated with VEGFR agent combined with platinum-based chemotherapy. New therapies may induce central necrosis and cavity formation. Tumor response assessment would change if one took into account loss of tumor volume as a result of cavitation because RECIST does not capture this feature. Pre-therapy CT shows a lung mass in the left upper lobe (arrow). Post-therapy CT images demonstrate extensive cavitation
5.2.1 Tumor Angiogenesis
Neoangiogenesis, the formation of new blood vessels, is a critical event in tumor growth [14]. Angiogenesis is a multistep process regulated by pro- and antiangiogenic factors. In cancer, genetic mutations, inflammatory processes, and hypoxia are able to tilt and sustain the angiogenic balance towards a pro-angiogenic form [14–16]. Angiogenesis is initiated when cells experience low oxygen tensions and develop adaptive responses mediated by the hypoxia-inducible factor-1a (HIF-1a), which activates the expression of vascular endothelial growth factor (VEGF), the key central mediator of tumor angiogenesis. Upregulation of VEGF pathways has been shown in many different tumors [14–17]. Other angiogenic activators such as placental growth factor (PlGF), fibroblast growth factor (FGF), hepatocyte growth factor (HGF), and matrix metalloproteinases also facilitate the tumor angiogenic process.
Tumor angiogenesis is sustained and uncontrolled and lacks remodelling, ultimately resulting in the development of a heterogeneous and disorganized network of tortuous and dilated vessels with characteristically show increased microvessel permeability. Tumor microvessel hyperpermeability to macromolecules is a direct contributor to raised hydrostatic interstitial fluid pressure which itself acts as a barrier to successful therapy [18].
Structural microvessel abnormalities also exacerbate the already precarious oxygen supply to tumors causing further tumor hypoxia [14–19]. Tumors attempt to overcome oxygen deficiency by further overexpressing pro-angiogenic factors thus creating a vicious feedback cycle of hypoxia-abnormal angiogenesis. This abnormal cycling via HIF-1a also promotes the development an aggressive tumor phenotype prone to spread via metastasis pathways [2].
Tumor angiogenesis is a proven target for anticancer therapy (ACT). In this setting, two distinct approaches for antiangiogenesis therapy (AAT) in tumors have emerged: inhibition of growth factors/signalling pathways necessary for endothelial cells growth and proliferation and therapies that directly target the established tumor vasculature. In the latter group, we can include vascular disruptive agents (VDAs) but also radiotherapy. Antiangiogenic target therapies act via the inhibition of angiogenesis often mediated by VEGF-action blockade. In the short term, they may also act through vascular normalization, which results in reduction in interstitial fluid pressure and temporary improved tumor oxygenation. VDAs selectively target endothelial cells and pericytes of the tumor vasculature [18] producing an acute vascular shutdown and tumor necrosis but have not yet been approved for clinical use [6, 7, 16–21]. Radiation-induced tumor cell death is usually attributed to DNA damage to tumor cells, thus triggering cell death by apoptosis and/or necrosis. However, radiation may also cause damage to endothelial cells. Stereotactic radiotherapy (SRT), which maximizes radiation dose/fraction, can lead to rapid endothelial apoptosis and to the obliteration of the tumor vasculature [21].
5.2.2 Tumor Metabolism and Proliferation
Different intracellular pathways are involved in tumor proliferation and metabolic activity regulation. The majority of human epithelial cancers are noted for upregulation of cell surface receptors capable of activation by growth factors including those of the epidermal growth factor receptor (EGFR) family, such as EGFR and HER2 [22, 23]. Given the importance of the EGFR pathway in cancer development, both anti-EGFR monoclonal antibodies and small-molecule EGFR tyrosine kinase receptor inhibitors (TKIs) have been developed. KIT receptor also plays critical oncogenic roles in a broad spectrum of hematologic and solid tumors controlling various cellular processes such as proliferation and differentiation, apoptosis, and metabolic tumor activity [24]. Imatinib mesylate inhibits KIT kinase activity and represents the front-line drug for the treatment of unresectable and advanced gastrointestinal stromal tumors (GISTs). Beside this, a variety of human malignancies have anaplastic lymphoma kinase (ALK) translocations. In lung cancers, the presence of a fusion gene, EML4-ALK, activates ALK overexpression, which contributes to increased cell proliferation and survival signalling via a number of intracellular pathways. Lung cancer cell lines harboring ALK gene rearrangements are sensitive to ALK inhibitor crizotinib [25, 26].
Different pathways mediate downstream effects of EGFR, ALK, or KIT pathways, including the phosphoinositide-3-kinase/Akt/mammalian target of rapamycin (mTOR) (PI3K/AKT/mTOR) pathway, which activates cellular survival signals [27], and the RAS-RAF-MAPK pathway [28] that affects cell proliferation, tumor invasion, and metastasis. Downstream pathways are also viable oncologic targets. Several drugs such as everolimus or temsirolimus specifically target the downstream signalling pathway PI3K/Akt/mTOR in renal carcinoma [27]. This strategy has merit for breast cancer also [29]. Beside this, approximately 40–60 % of malignant melanomas contain a BRAF mutation. The RAS family members act as critical mediators in cellular growth and survival. BRAF inhibitors have shown notable activity in patients with melanoma with BRAF gene mutations [28].
Hormonal therapy (HT) constitutes a different type of therapy for modulating tumor proliferation. Steroid hormone growth factors interact with nuclear receptors to activate the transcription of genes whose products stimulate the growth and viability of hormone-dependent malignancies [30, 31]. HT blocks the effects of hormones in tumors, mainly in breast cancer (BC) and in prostate tumors. A number of novel hormonal therapies have recently been introduced for the treatment of metastatic breast and prostate cancers including drugs targeting the endogenous production of estrogen/testosterone and selective estrogen/androgen receptor degraders (SERDs/SARDs).
5.2.3 Tumor Invasiveness
The receptor tyrosine kinase MET and its ligand, hepatocyte growth factor (HGF), regulate multiple cellular processes that stimulate cell proliferation, invasion and angiogenesis. Abnormal MET activation and causes por clinical outcomes. Abnormal MET activation correlates with poor prognosis in patients with cancer. Thus, MET has emerged as an attractive target for cancer therapy. Several MET inhibitors have been introduced into the clinic [32]. Cabozantinib (XL184) is a small-molecule kinase inhibitor with potent activity towards MET and VEGF receptor 2. It is currently being evaluated in a number of tumor types with encouraging results in prostate cancer (PC) [33, 34].
5.2.4 Avoid Immune Surveillance
Tumor cells are able to evade immune recognition and suppress immune reactivity despite the fact that many tumors elicit a strong immune response [35]. Nevertheless, the immune system can respond to some types of tumors that display highly immunogenic cancer cell-related antigens. It is also possible to activate the immune system into an antitumor state [5]. Immunotherapy has been successfully introduced into the clinic for treatment of metastatic prostate and breast tumors, lymphoma, and melanoma.
5.3 Assessment of New Oncologic Therapies by Functional and Molecular Imaging
When considering therapy effects on tumors, there appear to be differences in imaging observations between therapies [6–13, 36–41]. In each case, imaging findings appear to depend on anatomic sites and on interactions between specific tissue microstructure and the mechanism of action of therapy given. Traditional oncologic therapies, such as chemotherapy or radiotherapy, do not selectively attack malignant cells, but affect proliferating cells regardless of their malignant status. These therapies cause cellular lysis often via necrosis or apoptotic mechanisms. Tumor cell loss will lead to difference changes depending on the imaging technique applied. On DW-MRI, cellular lysis results in increased water diffusion, which increases apparent diffusion coefficient (ADC) values [36–38]. Chemotherapy and radiotherapy have also been shown to have an indirect antivascular effect via tumor cell killing and subsequent withdrawal of angiogenic cytokines; the latter is needed as a survival factor for immature vessels. On DCE imaging, a favorable tumor response to chemotherapy results in decreases in the rate and magnitude of enhancement for a number of tumor types [38, 39]. Such decreases in DCE-MRI kinetic parameters may be delayed after radiation therapy when an initial hyperemic response is often seen [42]. Concomitantly, FDG-PET shows reductions in glucose metabolism activity of tumors in response to therapy [40]. Applying this knowledge to novel biologic targeted drugs, hormonal therapy, advanced forms of radiation therapy, and interventional techniques, such as embolization or ablation, is not always straightforward. These aspects are considered more fully below.
5.3.1 Antiangiogenic and Antivascular Therapies
The structure and function of tumor vasculature is distinct compared to normal vessels. Malignant tumors show vessels with spatial heterogeneity, chaotic structure, and increased perfusion, capillary permeability to macromolecules, and volume of extravascular-extracellular space [41]. These abnormalities of new tumor vessels permit distinction of malignant vascularity from benign vascularity using FI techniques. In clinical practice, indirect measurements of angiogenesis can be performed noninvasively using different imaging techniques, including dynamic contrast-enhanced MRI (DCE-MRI), dynamic susceptibility-enhanced MRI (DSC-MRI), diffusion MRI (intravoxel incoherent motion), PET with oxygen-labeled water, perfusion CT (PCT), and dynamic microbubble-enhanced ultrasound; but DCE imaging with CT and MRI seems to be the most useful clinical tools [39, 41, 43–46]. DCE techniques are based on the acquisition of serial images through a region of interest before, during, and after the intravenous injection of a contrast agent. DCE images can be analyzed by quantitative model-dependent or semiquantitative (non-model-dependent) means to obtain different functional parameters, which can be related to vascular properties: blood flow (BF), blood volume (BV), microvessel permeability, extraction fraction, and plasma and interstitial volumes [38, 39, 44, 45] (Fig. 5.2a–c). Data acquisition and analysis are comparable despite inherent differences between imaging techniques in signal production and mechanism of tissue contrast enhancement [47].
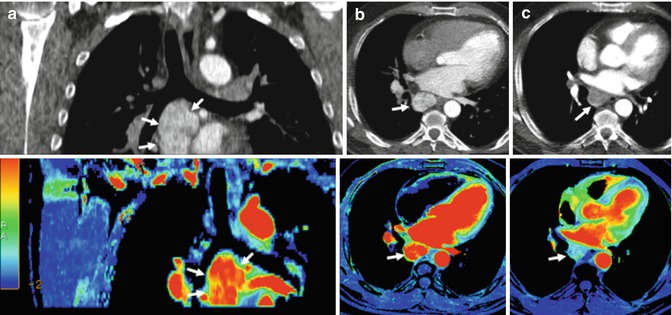
Fig. 5.2
Renal carcinoma with metastatic mediastinal lymph nodes treated with an anti-VEGFR agent. Pretherapy coronal (a) and axial (b) reformatted conventional CT images (top row) and perfusion blood volume (BV) parametric maps (bottom row) show a conglomerate of hypervascular metastatic nodes in the subcarinal area (arrows). Perfusion BV parametric maps show high BV suggesting intense active angiogenesis. Functional map evidences a mean BV value = 43.9 mil/100 g. (c) Posttherapy with an anti-VEGFR agent (c), axial CT image and perfusion BV parametric map show early angiogenic tumor response with marked decrease in tumor enhancement and BV value (arrows). Functional map evidences a mean BV value = 10.2 mil/100 g
DCE parameters allow the monitoring of changes in tumor vascularity. Many of the calculated kinetic parameters have physiological significance, are repeatable, and have clear clinical uses in diagnosis, guiding therapy, predicting patient outcome, and evaluating response to different therapies [6, 39, 43–45]. The effects of antiangiogenic drugs and VDAs on DCE kinetic parameters have been found to be similar with the dominant effect of successful therapy being reductions in BF and permeability. However, there are clear differences in the timing of the onset and duration of vascular changes. The effects of AAT are not immediate, arising at least 1–2 days post-drug administration. On the other hand, VDAs cause rapid shutdown of the vasculature within minutes to hours of drug administration, and reversibility of effects can be visible in the short term (24–48 h) [6, 39, 43, 48]. The vascular pruning of “normalization” induced by AAT can be detected on DCE by a combination of findings including reductions in vascular permeability and leakage space and regional increases in BF [18, 19, 49].
There is a clear need to establish thresholds for change that can be considered as significant for change and response. For example, in DCE-MRI, a reduction in transfer constant (K trans) of >40 % is usually considered a true difference caused by drug effect [50], while Petralia et al. [51] evidenced using PCT that decreases between scans of patients with hepatocellular carcinoma of more than 35 % for BF and 43 % for BV, or an increase of more than 55 % for mean transit time, could be considered beyond the analysis variability. Such thresholds often seem to depend on anatomic regions being evaluated but also on imaging acquisition parameters and on analysis [52]. It should be remembered that thresholds for true changes are not necessarily the same as thresholds for change that result in clinically significant alterations in tumor vasculature when in generally larger reductions in vascular kinetic parameters are needed. Finally, there has been an emerging interest in the development of imaging biomarkers for identifying patients who will likely respond favorably to inhibition of angiogenesis. However, no validated imaging biomarker signature has yet emerged [53, 54]. What is known is that the greater the magnitude of enhancement, the greater is the change following AAT. However, the latter observation has not translated into a predictive imaging biomarker of AAT [55].
DW-MRI may also; evaluate AAT directed towards VEGF pathway. These agents cause reductions in tumor ADC values, secondary to antivascular effects (reducted tissue perfusion) and via reductions of the extravascular-extracellular space secondary to vascular normalization and the lowering of vascular permeability. Reductions of ADC values due to reduction of tissue perfusion are not always notable using antiangiogenic and antivascular therapies. On the contrary, succesful treatment with AVT increases ADC values can be detected, particularly when causes significant tumor necrosis [37, 38]. PET has also been used to evaluate the effects of AAT. There seem to be no systematic effects on FDG uptake [41, 56]. However, AAT induces tumor hypoxia, which causes increased HIF-1a levels. HIF produces an upregulation of cell membrane glucose transporters and secondary increases in FDG uptake by tumors. Finally, direct PET-perfusion measurements of BV and BF or direct PET imaging of angiogenesis may allow a specific PET evaluation of angiogenesis in the clinic [41].
5.3.2 Target Therapies Blocking Tumor Proliferation
FDG-PET has demonstrated efficacy in the assessment of tumor response to anti-EGFR/HER-2 drugs [57–59]. However, tumor proliferation changes may be directly evaluated using 18F-3-deoxy-3-fluorothymidine (FLT)-PET (Fig. 5.3a, b). This thymidine analogue is retained within cells by thymidine kinase 1 (TK1); the latter is specifically active during DNA synthesis. Intracellular trapping of 18F-FLT that presumably gives a measure of the TK1 activity is increased in malignant cells and correlated with cellular proliferation [58, 59]. In this setting, preclinical observations have found that FLT-PET but not FDG-PET imaging may be a robust early indicator of erlotinib response in EGFR-dependent tumor models [60, 61]. However, on the contrary, different studies found that a marked decrease in FDG uptake preceded changes in FLT uptake and cell death in gefitinib-sensitive cell lines [62] and that the results of FDG scans were more informative than FLT scans in NSLC patients [63]. A practical limitation for using FLT in NSCLC patients is that FLT has relatively low uptake compared with FDG in many lesions [63]. It is anticipated that direct PET imaging of EGFR/HER2 expression and activity will eventually be able to predict which patients will likely respond to therapy and monitor tumor response [64].
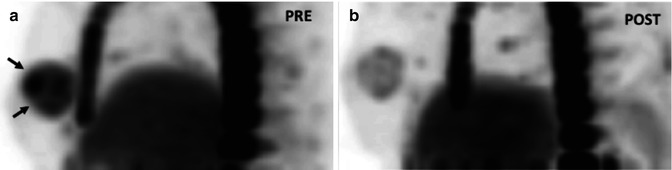
Fig. 5.3
FLT-PET in a patient with HER-2-positive locally advanced breast cancer treated with chemotherapy and anti-EGFR agent. Pre-therapy (a). Sagittal FLT-PET image shows an increased uptake in the breast (arrows) corresponding to tumor involvement. SUV max = 5.6. Post-therapy (b). Sagittal FLT-PET image 9 days post-therapy shows early decreased FLT uptake in the breast. SUV max = 2.5 (Courtesy of JA Richter, MD, PhD. Department of Nuclear Medicine, Clínica Universitaria de Navarra, Pamplona, Spain)
There is very limited evaluation of EGFR inhibitors with perfusion techniques [6, 39]. DCE-MRI did not show a significant change in quantitative parameters in patients with advanced colorectal cancer treated with vandetanib (an inhibitor of VEGFR, EGFR, and RET signalling pathways) [65] or with nasopharyngeal cancer treated with combined therapy including cetuximab [66]. There are no published reports on the DW-MRI evaluation of anti-EGFR/HER-2 agents. It seems rational to expect increases in ADC values with therapies that cause cell death [37, 38]; however, the magnitude of ADC increases will depend on the mechanism of cell death (necrotic versus apoptotic) and whether there is an inflammatory response to tumor cell kill.
5.3.2.1 Anti-ALK Drugs
Genetic alterations of ALK are associated with a number of cancers, including anaplastic large cell lymphoma (ALCL) and a subset of NSCLC (Fig. 5.4a, b). Small-molecule inhibitors of ALK kinase activity have been developed in the recent years, and crizotinib (combined c-MET and ALK inhibitor) has been clinically approved [25, 67]. There are scarce reports in the literature of the use of FMI in ALK-positive tumors, which suggest the possible role of FDG-PET for detecting response to crizotinib [26, 68].
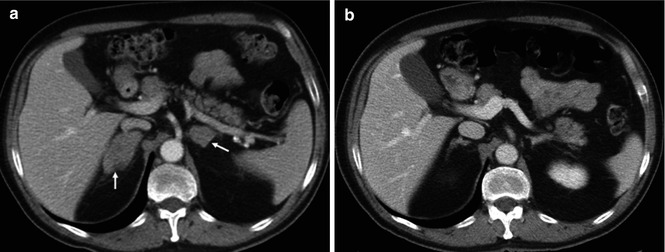
Fig. 5.4
(a) Non-small cell lung carcinoma with adrenal metastases in a 53-year-old man treated with an ALK inhibitor. Pre-therapy (a). CT image shows bilateral adrenal metastatic deposits (arrows). Post-therapy (b). CT image shows a marked response with almost complete resolution of the adrenal masses
5.3.2.2 Drugs Inhibiting c-KIT Pathway
Drugs targeting c-KIT pathway has been mainly focused in GISTs treated with imatinib. FDG-PET has a significant value in assessing treatment response to imatinib in GIST patients with dramatic decreases in glucose metabolism in responder patients. FDG-PET allows an early assessment of treatment response and is a strong predictor of clinical outcome [69] (Fig. 5.5). Further evaluation of new candidate markers of treatment response, such as quantitative perfusion or DW-MRI, may be the key for optimized monitoring of targeted therapies in GIST. In this setting, preliminary results show that DW-MRI may predict tumor response. A low pre-therapy ADC and marked ADC increase at 1 week after therapy is associated with good response [70].
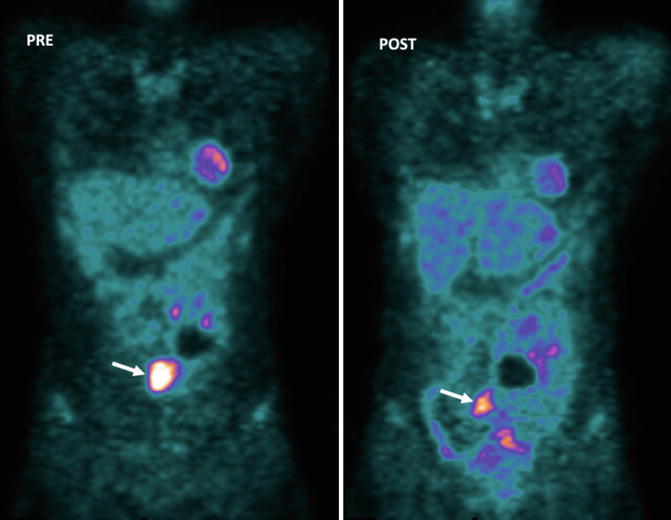
Fig. 5.5
GISTs in a 53-year-old woman. Pre-therapy. Coronal MIP FDG-PET image (left) shows an FDG-avid mass (arrow). PET image obtained 72 h after therapy with imatinib mesylate shows an early partial response with a decrease in tumor uptake (arrow-right)
5.3.2.3 Pathways Mediating Downstream Effects of EGFR, ALK, and c-KIT
PI3K/Akt/mTOR Pathway
PI3K/Akt/mTOR pathway is a commonly used pipeline for many growth stimuli and regulates key tumor processes by promoting protein synthesis, glucose metabolism, cellular migration, cell survival, and angiogenesis [27]. PI3K/Akt/mTOR pathway inhibitors include rapamycin and its analogues (everolimus and temsirolimus), which target a distal pathway component, mTOR. FDG-PET studies show decreases in metabolic activity and tumor proliferation with mTOR inhibitors [71–73]. mTOR signalling plays a specific role in the control of angiogenic pathways in renal cancer. mTOR inhibitors act by reducing the levels of HIF-1a. However, HIF-2 alpha is most active in the subtype of clear cell cancers, explaining the limited response of these tumors to mTOR inhibitors [74].
RAS-RAF-MAPK
The BRAF proto-oncogene activates RAF/MEK/ERK signaling, a major driver of carcinogenesis in various malignancies, most notably in melanoma [28]. The BRAF inhibitor, vemurafenib, has been approved for the treatment of metastatic melanoma in patients harboring BRAFV600 mutations. Tumors containing RAS mutations displayed enhanced FDG uptake, and vemurafenib reduces FDG uptake in tumors with BRAFV600 mutation that are successfully treated. On the other hand, FDG may predict acquired drug resistance. An increase in FDG uptake observed of a specific lesion in a patient on vemurafenib treatment suggests the development of drug resistance [75, 76].
5.3.3 Drugs Inhibiting Tumor Invasiveness: The MET Pathway
There is a limited experience evaluating the HGF/MET pathway using FMI. However, although FLT-PET is not a direct measure of MET activity itself, preliminary results suggest the possibility of FLT-PET as a clinical biomarker for monitoring tumor response to MET inhibition with crizotinib [77]. On the contrary, no significant change in DCE-MRI parameters was observed after 7 days of tivantinib treatment [78]. Recently, it has been noted that metastatic PC patients treated with the c-MET inhibitor XL-184 (cabozantinib) show dramatic decreases in bone scan agent technetium-99m-methylene diphosphonate. It is not clear why such dramatic changes in technetium uptake in the majority of patients is accompanied by only a littel proportion of patients responding clinically to therapy [34]. However, a possible explanation could be based on the overexpression of MET within bone osteoblasts and osteoclasts, which action could be inhibited by cabozantinib. Skeletal uptake of technetium-99m occurs as a function of skeletal osteogenic activity, being consequently affected by cabozantinib. This observation serves as a reminder that changes seen on FMI may represent bystander effects on adjacent tissue within or beside tumor masses and should not only be ascribed to antitumor targeting action.
5.3.4 Hormonal Therapy
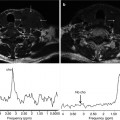
Steroid hormones play important roles in hormone-receptor-positive BC and PC due to their effects on cell growth, differentiation, and function. These hormone effects are mediated via activation of cell surface receptors, which are often upregulated. Hormonal therapy (HT) represents a powerful therapeutic option in hormone-receptor-positive breast and prostate cancers (Fig. 5.6). Androgen deprivation therapy (ADT) has shown antivascular and metabolic effects in PC. HT reduces perfusion and permeability of both malignant tumors and normal prostate gland within a month after starting therapy [79, 80]. Metabolic glandular atrophy reduces citrate peaks in tumor and in normal glandular tissues, but there is only slow loss of choline and creatine in tumor foci on H-MRSI [80]. These data seem to be contradicted by Røe et al. [81] who showed an increased tumor vascularization after ADT. Initial data using DW-MRI evaluation in PC treated with HT suggests minimum change in ADC values, although there is limited experience in this field [80, 82].
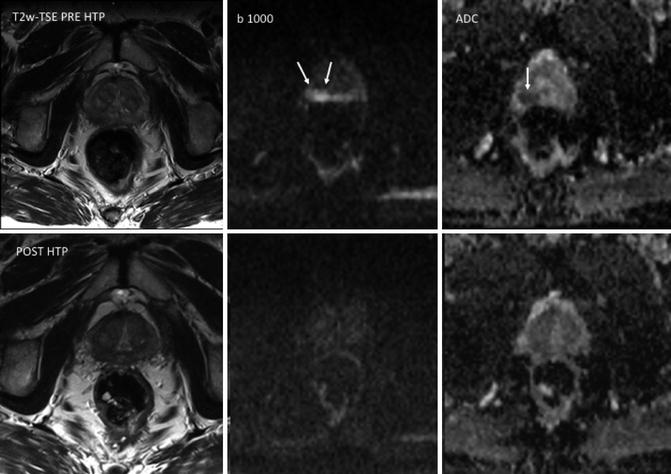
Fig. 5.6
Prostate cancer in a 72-year-old man. T2-weighted TSE, b1000 diffusion-weighted imaging (DWI), and ADC map obtained pre-therapy (top row) and before hormonal therapy (HTP) (bottom row). Images show a focal area in the right peripheral zone with increased signal on b1000 DWI and low ADC values (mean, 0.83 × 10⁻³ mm2/s) (arrows). ADC maps obtained 3 months after hormonal therapy (bottom row) show increased ADC values (mean, 1.32 × 10⁻³ mm2/s) in the same area. The tumor is not depicted on b1000 DWI
Metastatic BC and PC frequently remain confined to the skeleton. In these tumors, metastatic disease is often first treated with HT. FDG-PET shows only a limited value in evaluating bone response in metastatic PC, because osteoblastic bone lesions only show low FDG uptake [83]. However, FDG-PET scans tend to be positive in higher-grade disease, and baseline specific uptake values (SUV) do correlate with prognosis in some tumor types. In BC, tamoxifen and aromatase inhibitors demonstrated a paradoxical increases in tumor FDG uptake at early time points after treatment in some patients, the so-called metabolic flare. FDG metabolic flare has been correlated with positive tumor response to HT in BC and if observed is associated with better overall survival [84].
A number of tumor-specific PET tracers have been evaluated for their ability to predict and monitor bony therapy response, including 18F-FES (fluoroestradiol) for BC and 18F-FDHT (fluorodihydrotestosterone) for PC [85]. These ligands report on tumor cell expression of estrogen and androgen receptors. 18F-DHT uptakes have been correlated with androgen receptor (AR) expression levels in castrate-resistant prostate cancer, and it has been noted that spatial distribution of 18F-DHT is often different to that of 18FDG scans. As a result, different imaging phenotypes are recognizable at the patient and lesion level (AR predominant, glycolysis predominant, and AR/glycolysis concordant). This differential expression related to the total tumor burden maybe a predictive biomarker for response to novel therapeutics targeting these receptors and their intracellular pathways (SERDs/SARDs).
The effect of hormonal on metastatic bone disease in BC and PC patients is incompletely described. In our experience, decreases in bone marrow disease signal intensity on high-b-value images are generally observed with successful treatments. Effective tumor cell death should result in greater water diffusivity manifested as higher ADC values [36–38, 86, 87]. However, the extent of ADC increases seems to depend on the type of treatment given with greater ADC increases for cytotoxic chemotherapy and radiation. These treatments cause tumor cell death via a number of mechanisms (apoptosis, necrosis, mitotic catastrophe, autophagy, and senescence), many of which lead to tumor necrosis with an inflammatory component [36–38, 86, 87]. When patients are treated successfully with HTs, ADC value increases seem to be less marked possibly because cell death is less likely to be associated with inflammation [87].
5.3.5 Immunotherapy
Ipilimumab, an anti-CTLA-4-blocking antibody, is licensed for the treatment of melanoma (Fig. 5.7) and is currently undergoing trials for the treatment of lung cancer and castrate-resistant PC. Therapy assessment of soft tissue disease using this treatment is problematic because initial increases in tumor burden or the appearance of new lesions can be seen. That is, RECIST criteria cannot be readily applied for therapy assessments. Novel criteria for the evaluation of antitumor responses with immunotherapeutic agents are required. New morphologic criteria have recently been suggested [88], but these remain unsatisfactory for clinical use at the individual patient level.
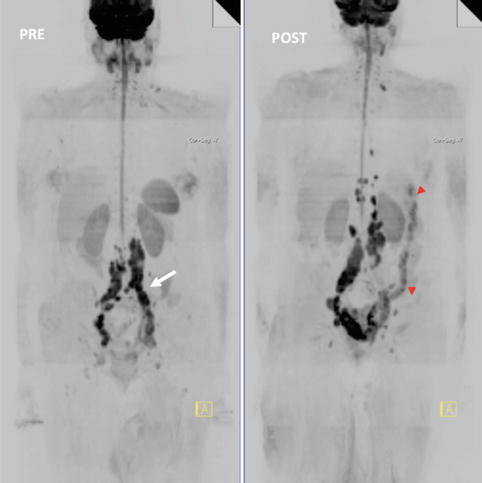
Fig. 5.7
Whole-body MRI (WB-MRI) tumor evaluation in a 68-year-old female with melanoma treated with ipilimumab. WB-MRI images pre (left)- and post (right)-administration of ipilimumab. Note background bone marrow atrophy. Post-therapy exam evidenced disease progression (nodes are bigger and more regions are involved) but left common iliac region (white arrow) responded. The patient also had colitis (red arrowheads). The anti-CTLA4 antibody, ipilimumab, may cause severe side effects. Diarrhea due to immune-related colitis is the most frequent serious toxicity and, if untreated, may lead to intestinal perforation
Related posts:
 Overview of Functional MR, CT, and US Imaging Techniques in Clinical Use
 Perfusion CT: Principles, Technical Aspects and Applications in Oncology
 Spectroscopy of Cancer
 DCE-US: Evaluation of Angiogenesis
 Dual-Energy and Spectral Energy Computed Tomography: Oncological Body Applications in Clinical Use
 Medical Image Computing for Oncology: Review and Clinical Examples
Stay updated, free articles. Join our Telegram channel

Full access? Get Clinical Tree


