Fig. 13.1
(a) Schematic illustration of the DCE-MRI technique in tumor tissue. Intravenously injected MRI contrast agent arrives from arteries in the capillary bed of the tumor tissue and extravasates into the tumor extracellular space. The kinetics of MR signal changes observed in the tumor can be analyzed qualitatively or quantitatively to provide characterization of tissue perfusion, capillary permeability, exchange kinetics, and the volume of extracellular extravascular space. Lower panel displays contrast-enhanced T1w images of a slice through the pelvis of a patient with rectal tumor before (b) and after chemoradiotherapy (c). The primary tumor, which is delineated with the blacked dashed line, displays high enhancement (b), whereas residual tissue after chemoradiotherapy, defined by the white dashed line, is poorly enhancing (c)
Although Gd chelates are able to pass the normal endothelium, generating contrast in normal tissue, specific features of tumor vessels enable their differentiation from the surrounding tissue. The degree of signal enhancement depends on the tissue perfusion, the arterial input function (AIF, i.e., the concentration–time course of contrast agent in the artery supplying the tissue), the capillary surface area, the capillary permeability, and the volume fraction of the extracellular extravascular space (EES). The hyperpermeability and, usually, large volume of the tumor vascular bed are key factors, which contribute to strong DCE-MRI contrast in the tumor (Fig. 13.1b). However, after (chemo)radiotherapy, this high enhancement may decrease considerably as a result of the replacement of well-vascularized tumor by poorly vascularized scar tissue (Fig. 13.1c). The magnitude and dynamics of contrast enhancement can be expressed either in a qualitative or in a (semi)quantitative manner. The former method involves the visual assessment of an obviously enhancing tumor area, and it is commonly performed in the radiological practice. Furthermore, the temporal profile of tumor enhancement can be assigned into one of three qualitative categories: (1) progressive enhancement pattern (washin), which shows continuous increase in signal intensity throughout time; (2) persistent enhancement pattern, displaying initial uptake followed by plateau phase; and (3) washout pattern, which has a relatively rapid uptake followed by reduction in enhancement towards the latter time points [1]. This method is predominantly exploited in breast cancer diagnostics and considers the type three enhancement pattern as strongly suggestive of malignancy. Importantly, DCE-MRI can deliver quantitative and (patho)physiologically meaningful vascular parameters. In order to assess these kinetic parameters, signal changes following the administration of a Gd chelate should be converted into the contrast agent concentration–time curves. To this aim, baseline T1 values are measured in the tumor before DCE-MRI acquisition or the reference tissue method is applied [2]. Alternatively, unconverted relative MR signal intensity curves can serve the determination of semiquantitative kinetic parameters. The descriptive or semiquantitative kinetic parameters, such as the initial amplitude of MRI signal enhancement (A), initial area under the contrast agent concentration–time curve (IAUC), and initial slope or time to peak (TTP) of the concentration–time curve, are derived without using pharmacokinetic modeling. These parameters are straightforward; however, they are highly influenced by the experimental setup [3]. In contrast, pharmacokinetic parameters, such as the endothelial transfer coefficient (K trans), the exchange rate constant (k ep), and the EES fractional volume (v e), assessed by using mathematical models to fit the data [4], are considered to be more physiologically meaningful, and they are less sensitive to the experimental conditions [3]. An example of the sensitivity of K trans and k ep to chemoradiotherapy-induced changes in the tumor vasculature is displayed in Fig. 13.2.
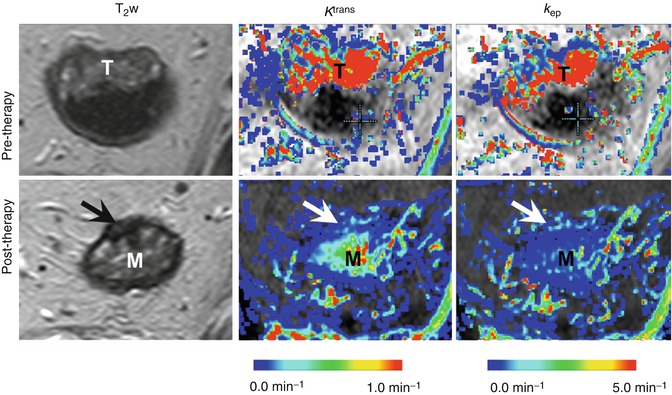
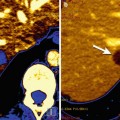
Fig. 13.2
DCE-MRI assessment of chemoradiotherapy-induced changes in the tumor vasculature. Representative T2-weighted images (T 2 w) and maps of the endothelial transfer coefficient (K trans ) and the exchange rate constant (k ep ) obtained for a rectal cancer patient at the primary staging (upper panel) and after 8 weeks’ interval following the neoadjuvant chemoradiotherapy (lower panel). The tumor location in the pre-therapy state is indicated by “T.” In the lower panel, arrows point to the potential residual tumor tissue after chemoradiotherapy, whereas the symbol “M” indicates the edematous mucosa. Both types of pharmacokinetic maps show a dramatic decrease in the parameter values after chemoradiotherapy, which indicates the vascular regression
An important feature of the tumor vasculature is its heterogeneity. Therefore, pixel-by-pixel analysis of DCE-MRI data is the preferred method, providing parameter maps [5]. The analysis of the parameter distribution provided better prediction of the therapeutic response in breast cancer patients [6] and tumor recurrence after radiotherapy in patients with cervical carcinoma [7], as compared to mean or median value.
Dynamic contrast-enhanced MRI with macromolecular contrast agent s is a novel vascular imaging method, which exploits macromolecular contrast agents (MMCAs) to assess the tissue vascular characteristics. The pharmacokinetic properties of MMCAs differ considerably from those of the low molecular weight Gd chelates. Their macromolecular size, ranging from a few to a few hundred nanometers, does not allow them to cross the endothelial layer of normal vessels. Moreover, generally, they are designed as long-circulating agents with a blood circulation half-life of the order of several hours. In the tumor microenvironment, the enhanced endothelial permeability enables extravasation of macromolecular agents. However, this process is much slower than in the case of low molecular weight contrast agents. Therefore, the separate assessment of vascular parameters, such as blood volume and vascular permeability, is considered to be more accurate [8]. So far, neither of the MMCAs is routinely used in the oncological diagnostics. Examples of MMCAs that have entered clinical trials include the Gd-cascade polymer (Gadomer-17) and P792 (Vistarem). Furthermore, an interesting group of MMCAs are Gd complexes, which bind reversibly to endogenous albumin, such as Gd-BOPTA (MultiHance) or gadofosveset (AngioMARK/Vasovist/Ablavar). Ultrasmall iron oxide particle s (USPIOs), such as feruglose (Clariscan) or ferumoxtran-10 (Resovist S), belong to the MMCAs as well. Delayed imaging after intravenous injection with USPIOs has been employed to detect metastatic spread in lymph nodes, liver, and bone marrow [9, 10]. Interestingly, in addition to the blood volume and vascular permeability, the USPIO-based readout also provides estimates of the vessel diameter [11], which can serve as a valuable marker of the antiangiogenic effects.
Dynamic-susceptibility contrast (DSC) MRI, also known as bolus-tracking MRI, is a dynamic MRI method that provides estimates of perfusion and other hemodynamic parameters. It exploits T2* sequences to monitor the passage of contrast material through a capillary bed, which presents as decrease in MR signal intensity [12]. The degree of signal loss is dependent on the vascular concentration of the contrast agent and microvessel size and volume. DSC-MRI can therefore provide quantitative indicatives of relative blood volume (rBV), relative blood flow (rBF), and mean transit time (MTT) derived from the first pass of contrast agent through the microcirculation [13]. DSC-MRI is most reliably used for normal brain and non-enhancing brain lesions, e.g., low-grade gliomas, because the contrast medium is retained within the intravascular space [13, 14]. In contrast, it cannot readily be applied to areas of marked blood–brain barrier breakdown or to extracranial tumors with very leaky blood vessels. This is because the T1 enhancing effects of Gd chelates can counteract the T2* signal lowering effects, resulting in falsely low blood volume values in very leaky vessels [15]. A solution to overcoming this problem is to use non-gadolinium susceptibility contrast agents, which have a strong T2* effect but a weak T1 effect. The signal loss observed with T2*-weighted sequences has been used qualitatively in clinical studies to characterize liver, breast, and brain tumors [16–18].
13.2.2 Noninvasive Vascular MR Imaging
Arterial spin labeling (ASL) is a completely noninvasive vascular MR method, which exploits arterial water as an endogenous tracer. It is therefore very desired for the longitudinal patient follow-up. Importantly, ASL yields absolute measurements of blood flow at high spatial and temporal resolution [19]. In ASL, the proton spins of the arterial water are magnetically labeled, i.e., undergo either saturation or inversion, prior to reaching the imaged volume. Blood flowing into the imaging slice exchanges with tissue water, altering the tissue magnetization. A perfusion-weighted image can be generated by the subtraction of a “labeled” image from a control image, in which spin labeling has not been performed. ASL has been clinically applied in the assessment of cerebral blood flow in various pathological states, including cerebrovascular disease, neurodegenerative disease, and epilepsy. In oncology, the ASL application has been mainly limited to brain tumors [20, 21]. In extracranial tumors, however, technical challenges limit the ability to label the supplying vessels of the tumor [22]. Moreover, it is sometimes difficult to differentiate the tumor-feeding artery. Nevertheless, some preclinical and clinical studies have shown potential of ASL for cancer diagnosis and therapy evaluation at peripheral locations [23, 24].
13.2.3 Perfusion CT
Computed tomography (CT) is currently one of the most commonly used imaging modalities because of widespread availability, reasonable costs, fast image acquisition, whole-body 3D coverage, and high spatial resolution. On the other hand, CT has several important disadvantages, including the use of ionizing radiation, poor soft tissue contrast, and limited functional information. In clinical oncology, contrast-enhanced CT plays an important role, being the imaging method of choice for monitoring of pulmonary, hepatic, mediastinal, and retroperitoneal lymph node metastases [25]. Perfusion CT, a dynamic contrast-enhanced CT method, also aspires for the position in cancer diagnostics, by generating (patho)physiologically relevant hemodynamic parameters. Although perfusion CT can be readily incorporated into existing CT protocols, clinical experience has largely comprised preliminary studies and few large-scale clinical trials have been performed [26].
A perfusion CT measurement consists of a dynamic series of images acquired before, during, and after an intravenous bolus of iodinated contrast material. The first pass of contrast agent through the vascular system typically comprises the first 45–60 s post-contrast. Over time, increasing amounts of contrast material pass into the extravascular space until equilibrium is reached at approximately 2 min post-contrast. The resulting temporal changes in contrast enhancement can be used to assess a range of parameters that reflect the functional status of the tissue vasculature. As a consequence of the two-compartment kinetics of a contrast agent, there are two categories of (patho)physiological data that are obtained from perfusion CT data. The intravascular phase of enhancement provides estimation of the perfusion, i.e., blood flow per unit volume or mass of tissue, and the relative blood volume. The extravascular phase can be used to evaluate vascular permeability exploiting the fact that tumor blood vessels are abnormally permeable to circulating molecules [27].
Vascular function of the imaged tissue can be expressed by means of semiquantitative and quantitative parameters. Semiquantitative parameters, such as the enhancement peak or enhancement rate, are obtained from tumor time–attenuation curves and have been shown to correlate with MVD in lung and renal cancer [28, 29]. Compartmental analysis and deconvolution represent the two most widely used quantitative analysis methods for determination of perfusion and other vascular parameters from dynamic CT data. Compartmental analysis for first-pass studies considers the intravascular and extravascular spaces as a single compartment, which can be done prior to the moment when contrast medium appears in the draining veins of the tissue of interest. Perfusion is calculated either from the maximal slope of the tissue concentration–time curve or from its peak height, normalized to the arterial input function. A two-compartment model is used for measurements of capillary permeability and blood volume [27]. Deconvolution method uses arterial and tissue time–attenuation curves to calculate the impulse residue function (IRF) for the tissue of interest, where the IRF is a theoretical tissue curve that would be obtained from an instantaneous arterial input [27]. Compartmental analysis and deconvolution methods have both been validated against other reference standards both in animals and humans, showing high accuracy and reproducibility [30–32].
13.2.4 Contrast-Enhanced Ultrasonography (CEUS)
Contrast-enhanced ultrasonography (CEUS) imaging emerges as the most popular medical imaging modality, which can be attributed to the low cost per examination and high safety profile. Due to poor scattering of ultrasonic waves by blood, the US contrast agents have been developed to assess the functional tissue status. The US contrast agents consist of micron-sized gas bubbles encapsulated in biodegradable shells. In contrast to both CT- and MRI-based methods, CEUS enables the visualization of tissue capillary network. This unique feature is due to a high sensitivity of US to very small amounts of contrast agent, even to a single bubble. Furthermore, because sonography is a dynamic method that is performed in real time, the tissue perfusion properties can be deduced from both the influx and washout of the contrast media. In addition, signals from the microbubbles enable the visualization of slow flow in microscopic vessels. CEUS is now routinely used for diagnosis, particularly for the detection and characterization of various liver tumors [33]. More detailed description of the methodological principles of CEUS and its clinical applicability can be found in the recent review by Postema and Gilja [34]. In addition to conventional CEUS, double contrast-enhanced ultrasound (DCUS) has been recently developed to improve the assessment of gastric cancer [35]. In clinical application of this methodology, the use of an oral US contrast agent reveals the three-layered structure of the gastric wall, while the application of an intravenous contrast reveals the dynamic features of tumor vascularity. DCUS is considered as superior to the traditional staging methods for gastric cancer since it can assess the depth of tumor penetration and the presence of lymph node metastases. In addition, a few research groups proposed blood flow measurements by Doppler ultrasonography for therapy monitoring in different malignancies [36–38].
13.3 Cellular Viability/Density Imaging with Diffusion MRI
Diffusion-weighted MR imaging (DWI) is a technique that is increasingly gaining ground within the field of oncology. The contrast in DWI is derived from differences in the microscopic movement (“diffusion”) of water protons between different tissues. The degree of water diffusion is mainly dependent on a tissue’s cellular density, the presence of intact cell membranes, and the viscosity of fluids. In tissues with a dense cellular structure, with many intact cell membranes, or within fluids with a highly viscous content, the movement of water protons is restricted. In contrast, the loss of cellularity, e.g., as a result of chemotherapy, is associated with an increase in the water diffusion and can be measured by DWI (Fig. 13.3) [39]. Diffusion weighting is typically obtained by applying two bipolar diffusion sensitizing gradients to a T2-weighted spin echo sequence. The gradient duration, the amplitude, and the interval between the two gradients together determine the degree of diffusion weighting (referred to as the “b-value”). On high b-value (e.g., b800–1000) diffusion images, the signal from most soft tissues is suppressed, and the only signal that remains is that of high cellular structures, such as malignant tumors, but also some normal anatomical structures such as nerves and lymphoid tissues. Traditionally, DWI was mainly used in neurologic imaging to detect areas of brain ischemia, an indication for which DWI has proven itself invaluable. In the early years, body DWI was not deemed feasible due to artifacts caused by limitations in the scan technique, the presence of air-filled spaces (lungs, bowels), and respiratory motion. Nowadays, however, these limitations have been largely overcome, and extracranial applications of DWI are rapidly emerging. One of the current cornerstones of DWI is the evaluation of malignancies. Numerous studies have shown the value of diffusion for the detection of malignant tumors within specific organs such as the liver and prostate [40, 41] but also in the whole-body setting to assess the extent of disease in patients with lymphoma or to screen for metastases from, for example, prostate and breast cancer [42, 43]. One of the main strengths of DWI is that it not only allows for a visual assessment but also enables the acquisition of quantitative data. When plotting the degree of signal attenuation obtained at two or more b-values logarithmically, the slope of this line can be used as a quantitative measure of diffusion: the “apparent diffusion coefficient” (ADC). ADC has been shown a useful parameter to help distinguish between benign and malignant lesions. For example, in the liver study, it has been shown that the ADC of metastatic lesions (1.05 × 10⁻³ mm2/s) and hepatocellular carcinoma (1.22 × 10⁻³ mm2/s) was significantly lower compared to benign lesions such as focal nodular hyperplasia (1.40 × 10⁻³ mm2/s), hemangiomas (1.92 × 10⁻³ mm2/s), and cysts (3.02 × 10⁻³ mm2/s) [44]. Moreover, ADC has been suggested as a potential imaging biomarker to assess and monitor the behavior of tumors after onset of cancer treatment. When a tumor responds to treatment, this is reflected by a change in its cellular microstructure, which can readily be detected as a change in its diffusion characteristics (Fig. 13.4). The use of ADC as an imaging biomarker is an appealing option; because DWI is a noninvasive technique, acquisition is relatively fast and can easily be incorporated into any clinical MRI protocol. Moreover, DWI does not require the use of exogenous contrast agents or ionizing radiation. Hence, the use of ADC as a noninvasive tumor biomarker is now frequently being explored, and successful results have been reported in various types of malignancies such as colorectal cancer, primary and metastatic liver tumors, bone tumors, and lymphoma [45–48].
 New Therapies and Functional-Molecular Imaging
 Perfusion CT: Principles, Technical Aspects and Applications in Oncology
 Spectroscopy of Cancer
 DCE-US: Evaluation of Angiogenesis
 Dual-Energy and Spectral Energy Computed Tomography: Oncological Body Applications in Clinical Use
 Medical Image Computing for Oncology: Review and Clinical Examples


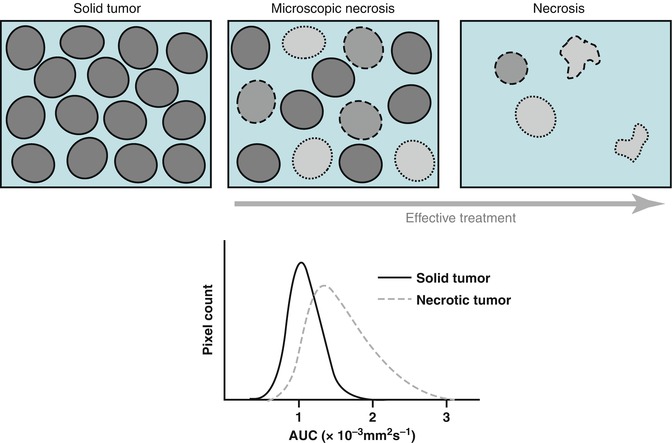
Fig. 13.3
Schematic representation of therapy-induced changes in tumor cellularity and water mobility measured as an apparent diffusion coefficient (ADC). The increase in extracellular space and membrane permeability associated with cell death (upper panel) results in greater water mobility, which is observed as a shift of tumor ADC distribution towards higher ADC values (lower panel). (Inspired by [39])
Related posts:
New Therapies and Functional-Molecular Imaging
Perfusion CT: Principles, Technical Aspects and Applications in Oncology
Spectroscopy of Cancer
DCE-US: Evaluation of Angiogenesis
Dual-Energy and Spectral Energy Computed Tomography: Oncological Body Applications in Clinical Use
Medical Image Computing for Oncology: Review and Clinical Examples
Stay updated, free articles. Join our Telegram channel
Full access? Get Clinical Tree
