(1)
Departments of Anesthesiology and Radiology, University of Colorado Cancer Center Animal Imaging Core, Anschutz Medical Center, Aurora, CO 80045, USA
18.1 Introduction
18.2 In Vivo MRS and MRSI
18.2.3 Prostate Cancer by 1H-MRS
18.2.4 Other Cancers by 1H-MRS
18.3.2 Magic Angle Spinning 1H-NMR
Abstract
Nuclear magnetic resonance (NMR) was initially described as a physical phenomenon and initially was developed and used exclusively for chemical and structural analyses [1, 2]. Nowadays, the most commonly used NMR methodologies in biomedicine are based on studying the physical properties of hydrogen nuclei (protons) in tissue water (which is commonly known as magnetic resonance imaging, MRI) followed by proton NMR spectroscopy (or MRS) on other endogenous metabolites and, less frequently, other “magnetically active” nuclei such as 31P, 13C, 19F, and 23Na. The strong external magnetic field aligns the magnetic moments of protons (with spins −½ and ½) parallel and antiparallel to the magnetic field. The population of spins in the parallel orientation (which are of a slightly lower energy level) is larger than in the antiparallel orientation as described by the Boltzmann distribution. This results in a net “magnetization” in the sample aligned with the direction of the external magnetic field. When a radiofrequency (rf) pulse is applied to the sample, the magnetization orientation is changed, and after the pulse is gone, the system relaxes to its original status. Hydrogen nuclei in different tissues have different relaxation properties, which can be detected by rf MR receivers. MR tissue relaxation characteristics following an excitation rf pulse reveal information about the concentration, mobility, and chemical bonding of hydrogen and, less frequently, other tissue elements. The strongest NMR signals in a living system arise from hydrogens in water and fat protons due to their metabolic abundance (water compromises up to 66 % of the body weight). Other endogenous and exogenous metabolites also give signals on 1H-NMR but with much weaker signal-to-noise ratios due to lower concentrations. A significant number of endogenous metabolite signals are usually obscured by the water signal (both in vivo and in vitro), and their detection requires adequate techniques for water suppression (and often lipid or macromolecule suppression).
Abbreviations
CLL
Chronic lymphatic leukaemia
DNP
Dynamic nuclear polarization
EIC
Extensive intraductal component
FLT
18F-Fluorothymidine
GPC
Glycerophosphocholine
HR-MAS
High-resolution magic angle spinning
Lac
Lactate
MRS
Magnetic resonance spectroscopy
MRSI
MRS and spectroscopic imaging
NAA
N-acetyl aspartate
NACT
Neo-adjuvant chemotherapy
NMR
Nuclear magnetic resonance
PC
Phosphocholine
PK
Pharmacokinetics
18.1 Introduction
Nuclear magnetic resonance (NMR) was initially described as a physical phenomenon and initially was developed and used exclusively for chemical and structural analyses [1, 2]. Nowadays, the most commonly used NMR methodologies in biomedicine are based on studying the physical properties of hydrogen nuclei (protons) in tissue water (which is commonly known as magnetic resonance imaging, MRI) followed by proton NMR spectroscopy (or MRS) on other endogenous metabolites and, less frequently, other “magnetically active” nuclei such as 31P, 13C, 19F, and 23Na. The strong external magnetic field aligns the magnetic moments of protons (with spins −½ and ½) parallel and antiparallel to the magnetic field. The population of spins in the parallel orientation (which are of a slightly lower energy level) is larger than in the antiparallel orientation as described by the Boltzmann distribution. This results in a net “magnetization” in the sample aligned with the direction of the external magnetic field. When a radiofrequency (rf) pulse is applied to the sample, the magnetization orientation is changed, and after the pulse is gone, the system relaxes to its original status. Hydrogen nuclei in different tissues have different relaxation properties, which can be detected by rf MR receivers. MR tissue relaxation characteristics following an excitation rf pulse reveal information about the concentration, mobility, and chemical bonding of hydrogen and, less frequently, other tissue elements. The strongest NMR signals in a living system arise from hydrogens in water and fat protons due to their metabolic abundance (water compromises up to 66 % of the body weight). Other endogenous and exogenous metabolites also give signals on 1H-NMR but with much weaker signal-to-noise ratios due to lower concentrations. A significant number of endogenous metabolite signals are usually obscured by the water signal (both in vivo and in vitro), and their detection requires adequate techniques for water suppression (and often lipid or macromolecule suppression).
In 1971, Raymond Damadian discovered that the proton relaxation times of a normal tissue and a tumor differed, which motivated physicians and scientists to consider MRI as a tool for oncologic imaging. Subsequently, in 1973, Paul Lauterbur demonstrated the MRI phenomenon on small test tubes (filled with liquids) using a gradient approach for spatial localization. In 1975, Richard Ernst proposed Fourier Transform, which became the basis for MR phase and frequency encoding allowing for actual image and spectrum creation. The first commercially available MR scanners were introduced to clinical practice in the 1970s, most of them operated at 0.6 Tesla (T, external magnetic field strength). During the following decade, stronger 1.5 T MR systems became available. In 2002, the US Food and Drug Administration approved the use of 3 T for the brain and the whole body. Nowadays, human 7 T brain and whole body scanners are available for human (nonclinical) MRI research. With all technological improvements, it became clear that MR has a great potential in visualizing biochemistry noninvasively (in a precise anatomical location as defined by MRI). This dual ability to provide images as well as highly localized chemical “snapshots” of a lesion noninvasively and in the same experiment is the most unique feature of MR among all other imaging techniques (see as examples Figs. 18.1 and 18.2 for anatomical localizations of MR spectra). The altered tumor metabolic phenotype with its high glucose utilization, high glycolytic activity, and increased membrane biosynthesis can be observed noninvasively by magnetic resonance spectroscopy (MRS), since the hydrogens of different endogenous metabolites (tissue-own small molecules) resonate at slightly different frequencies [6–8]. In general, translational and clinical research intensively utilizes MR spectroscopic approach for biochemical characterization of the tissue of interest either in vivo (using MRS single-voxel or multi-voxel spectroscopic imaging, MRSI) or ex vivo (so-called NMR-based metabolomics) [9, 10]. Other metabolic imaging techniques include positron emission tomography (PET) and single-photon emission computed tomography (SPECT) [11, 12]; with the recent development of integrated PET/MR scanner, new horizons of metabolic and molecular imaging are being recently explored. This review is focused on noninvasive MRS and spectroscopic imaging (MRSI) and their roles in clinical decision-making for cancer diagnosis, staging, and treatment response.
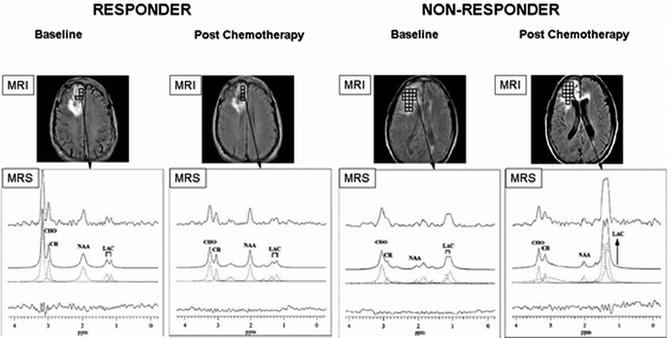
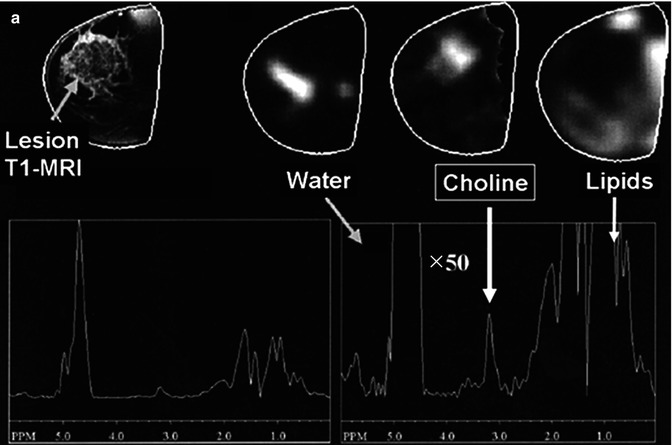
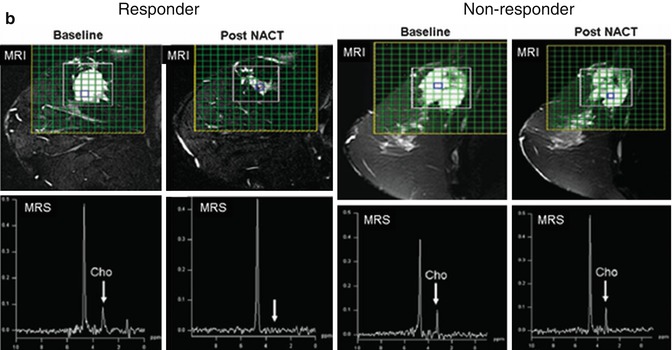
Fig. 18.1
1H-MRS on brain cancer patients with anatomical localization from gadolinium-enhanced T1-weighted MRI (top panel). (a) A responder with a mildly enhanced anaplastic oligodendroglioma showed a significant decrease in [tCho/tCr] and a slight improvement in [NAA/tCr] on posttreatment scans (4 months after chemotherapy); (b) A nonresponder with an anaplastic astrocytoma revealed unfavorably low NAA levels at the baseline and highly increased [Lac/tCr] levels 4 months after treatment (recurrent disease was confirmed 2 months later by gadolinium-enhanced T1-weighted MRI) (Adapted from [3])
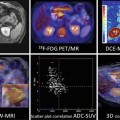
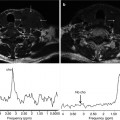
Fig. 18.2
Anatomical MRI and metabolic 1H-MRS/MRSI on patients with breast cancer. (a) A patient with infiltrating ductal carcinoma of the breast with spatial co-localization of malignant margins by contrast-enhanced T1-weighted MRI and tCho-1H-MRSI (Adapted from [4]). (b) Changes in the lesion size by T2-weighted MRI (top panel) and in tCho peak by 1H-MRS (low panel) prior and 3 cycles after NACT in a responding and nonresponding patients (Adapted from [5])
18.2 In Vivo MRS and MRSI
In vivo magnetic resonance spectroscopy (MRS) and spectroscopic imaging (MRSI) have been used for the noninvasive prognosis and diagnosis of tumors for over two decades. Overtime, MRS advanced with the rate of technological improvements such as higher magnetic field, coil design, and advanced pulse sequences. Nowadays, clinical MRS data are still most commonly acquired at the field strength of 1.5 T, but the trend is increasing toward the use of clinical 3 T machines (allowing for higher spatial and spectral resolution, doubling of the signal-to-noise, and reducing acquisition times). In order to acquire MR spectra, clinically available MR scanners usually need to be equipped with a set of specifically designed surface coils for precise voxel localization. In some cases, even more sophisticated coil design is required such as endorectal coils for prostate gland MRS or multinuclear resonance channels for 31P- or 13C-MR detection. In clinical applications of MRS, the 1H nuclei have played a dominant role, mainly because proton hydrogens (1H, the most “magnetic sensitive” nucleus) are present in most tissue metabolites and therefore can be detected with high sensitivity. In addition, proton MRS protocols can be employed relatively easily on common clinical MR scanners, which are dedicated to observe the protons of tissue water and fat for conventional MRI. The waste majority of clinically available 1H-MRS protocols has been developed for noninvasive metabolic assessments of brain, breast, and prostate cancers. Modern MRS techniques – such as the point resolved spectroscopy, PRESS – allow for volume localization of 1 μL of tissue (1 × 1 × 1 mm3) at the 3 T for, for example, brain MRS scans.
18.2.1 Brain Metabolic 1H-MRS Imaging
Due to its intrinsic soft tissue contrast, MRI is the method of choice for brain imaging. Brain MRI, including gadolinium contrast-enhanced MRI, is the “gold standard” in diagnostic management and treatment planning for brain cancer patients. Historically, 1H-MRS research has been focused mainly on neurological disorders, in part because use of the technique in the brain imposes fewer technical challenges than in other organs. Brain MRS has also pioneered clinical metabolic imaging in oncology by providing unique metabolic information of the lesion to help the diagnosis of tumor type and grade or detection of recurrence [13, 14]. A dedicated brain phased-array coils are used for single-voxel 1H-MRS or multi-voxel 1H-MRSI in the brain. To measure a viable tumor lesion, the voxel is placed by MRI guidance using the well-enhanced part of the tumor (see Fig. 18.1 as an example).
In brain tumors, a relatively high signal is observed at 3.2 ppm on the MRS chemical shift scale, which has been identified (back in the 1990s) as the methyl group of choline-containing compounds (often referred as total choline, tCho, in 1H-MRS). The choline compounds are involved in the biosynthesis and degradation of phospholipids such as phosphatidylcholine, which is required for the buildup and maintenance of cell membranes. A working hypothesis is that elevated tCho is a reflection of increased cellular proliferation and fast membrane turnover in replicating cells. In addition to tCho (increased in most brain tumors), two other brain metabolites – N-acetyl aspartate (NAA, a neuronal marker) and total creatine (tCr, energy metabolism) – are usually easily seen in water- and fat-suppressed 1H-MRS of the brain. Changes in tCho, tCr, and NAA can be seen in gliomas, astrocytomas, meningiomas, as well as neuroblastomas. As mentioned above, the most characteristic metabolic feature of brain and CNS tumors is the increase level of tCho as compared to unaffected tissues [14–16]. A reduction in the tCr signal also occurs in gliomas but less consistently than increased tCho. A reduction in NAA is a general observation in adult gliomas. An appearance of lactate (Lac) signals (together with lipids) is often seen in glioblastomas. Recent implementation of high-field magnets (3 T) into a clinical setting allows for expanded metabolic imaging in the brain: Lac [17] and glycine MRSI [18] can easily be performed in glioblastoma patients at a reasonable acquisition time, where significantly increased Lac and glycine might be of a diagnostic value.
Beside diagnostic features with increased tCho/decreased NAA levels, another useful application of 1H-MRS is in stereotactic procedures to obtain biopsies from proper (most malignant) tumor location and to delineate the tumor lesion for surgery planning or radiation treatment [19]. Indeed, 1H-MRS markers have proven of being highly sensitive in assessing the treatment response. An earlier study by UCSF group [15] reported on the treatment response to radiation in glioma patients. Before radiation, there was elevated tCho and decreased tCr and NAA, with a small peak corresponding to Lac + lipids. This characteristic MRS signature was seen for most cases of adult glioma with some level of necrosis. Immediately after radiation, the levels of tCho, tCr, and NAA decreased and the Lac + lipids increased – a typical signature for tumor reduction and radiation-induced necrosis 4 months after radiation. Six months after radiation, all recurrent gliomas were presented with a typical metabolic profile characterized by the high tCho and Lac + lipid levels and the low levels of NAA and tCr [15]. Another 1H-MRSI study was performed on 14 patients with low-grade brain tumors in order to assess the response to chemotherapy [3]. Longitudinal changes of regional levels of tCho, NAA, and Lac relative to tCr were assessed before and after chemotherapy treatment. At baseline, a low [NAA/tCr] was associated with decreased progression-free survival time, as was an increase in [tCho/tCr] during chemotherapy. In responders, a dramatic decrease of tCho and a slight decrease in NAA were seen 4 months after treatment (Fig. 18.1). In nonresponders, an increase in [tCho/tCr] and [Lac/tCr] was noted as a predictor for recurrent disease (2 months before MRI confirmed progressive disease) (Fig. 18.1). 1H-MRS was also applied in animal models for brain tumors, mostly nude rat orthotopic xenograft models of human neuroblastoma and glioblastoma. Animal brain showed a similar metabolic pattern of brain malignancy including increased tCho and decreased NAA and tCr levels [16]. When treated with irinotecan or cisplatin (two commonly used chemotherapeutic drugs), 1H-MRS displayed an abnormal accumulation of mobile neutral lipids and Lac with a simultaneous decrease in tCho in drug-sensitive xenografts [20, 21].
Recent technological advances allow for a multimodality approach for better staging and treatment response assessment. The combination of quantitative MRS/MRSI and highly sensitive PET biomarkers has a lot to offer for brain imaging. Indeed, recent studies showed the correlation between high uptake of 18F-fluoroethyl-tyrosine (FET)-PET (a marker for tumor infiltration) and neuronal loss by NAA in patients with cerebral gliomas grades II–IV [22]. Conventional FDG-PET and NAA 1H-MRSI detected similar regions in pediatric brain tumors as metabolically active, but (because of high background in glucose uptake in the brain) MRSI proved to be more sensitive [23]. In summary, 1H-MRS remains the most sensitive noninvasive method that can provide the metabolic profile and metabolite levels of a particular brain tumor region. In addition, 1H-MRSI can also be used to establish the spatial distribution of a particular metabolite (with tCho and NAA being the most useful metabolic markers) in the metabolically heterogeneous brain and brain lesions.
18.2.2 Choline 1H-MRS in Breast Cancer
The waste majority of breast 1H-MRS studies so far have been performed at 1.5 T clinical scanners using dedicated multichannel phased-array breast coils (with a patient being in the prone position). Most groups have used single-voxel 1H-MRS to localize metabolite signals, and some groups have explored the use of 1H-MRSI for the spatial distribution of breast metabolites. In both cases, the MRS studies are usually performed immediately after gadolinium-based dynamic contrast-enhanced (DCE)-MRI with fat suppression [24]. 1H-MR spectra from normal breast tissue and breast cancer lesions reveal fewer resonances than generally detected in the brain. Large fat and water resonances are present in the breast tissue and vary in amplitude depending on the amount of fibroglandular and adipose tissues in the voxel. But – as for the brain – one of the metabolic hallmarks of breast cancer is an appearance of choline-containing compounds (tCho) at 3.2 ppm, indicating that this is a general neoplastic phenomenon [24]. Several groups have successfully shown that increased tCho was co-localized with malignant margins on anatomical T1- and T2-weighted MRI (Fig. 18.2a) and the tCho levels that statistically differed between malignant and benign patients (p < 0.0008) [4]. Choline-based discrimination of malignant from benign lesions has been reported in various clinical studies with ranges of sensitivity 70–100 % and specificity 67–100 % [24, 25]. A recent 1.5 T clinical 1H-MRS study on 184 breast cancer patients has reported characteristic changes in tCho characterized by different molecular cancer subtypes [26]. The tCho integrals were significantly higher for invasive ductal carcinomas, high-grade cancers, and extensive intraductal component (EIC)-negative cancers than for in situ invasive carcinomas, low-grade cancers, and EIC-positive cancers. Another recent study by Sah et al. [27] has showed that nontriple negative breast cancer patients as well as triple positive have significantly higher tCho levels by 1H-MRS when compared to triple negative cancers, such indicating a potential diagnostic use of tCho-MRS for molecular classification.
Several groups have also shown that the disappearance of tCho is a sensitive indicator for the response success to neoadjuvant chemotherapy (NACT) [5, 28]. In one of these studies, 30 patients with locally advanced breast cancers undergoing three cycles of NACT were monitored by 1H-MRS. The MR response was compared with the clinical response. A strong correlation between the decrease in the lesion size on T2-weighted MRI (average 84 % in responders) and decline in tCho signal (from baseline level of 7.8 to 3.6) was observed for responders at cycle III of NACT (Fig. 18.2b) [5]. The sensitivity and specificity for tCho1H-MRS to detect responders from nonresponders were 86 and 91 %, respectively, while 100 % sensitivity but reduced 73 % specificity were seen for tumor volumes by MRI [5, 28]. Preclinical 1H-MRS studies on cells and animal models of breast cancers have further explored the treatment response to a variety of anticancer drugs in regard to choline metabolism. A significant decrease in tCho was seen for cytotoxic chemotherapeutic drugs (docetaxel), signal transduction inhibitors (MAPK inhibitor), as well as for nonsteroidal antiinflammatory drugs (NSAID, indomethacin) [29–31]. Choline metabolism has also received attention as a therapeutic target – animal studies with choline kinase inhibitors have been performed revealing a moderate inhibition of tumor growth and a significant decrease in tCho and phosphocholine peaks by 1H- and 31P-MRS, respectively, in treated tumor-bearing animals [32].
In summary, the evidence for abnormal choline metabolism, especially in breast cancer, is so overwhelming that tCho is believed to be a potential biomarker in cancer diagnosis (detection, grading, and staging) and for treatment response [8, 24]. This attracted much attention to develop yet another choline-based imaging platform using a highly sensitive positron emission tomography (PET) approach with 11C- and 18F-choline tracers (such as with 18F-fluoromethyl-choline) [33]. Although still being developed, existing studies of breast tCho1H-MRS/MRSI have shown promising results with the growing number of clinical research groups incorporating these metabolic techniques along with their breast MRI protocols. As for the brain, high fields (3 and 4 T) can potentially improve the quality of breast cancer MRS and provide ability for precise metabolite quantification [34].
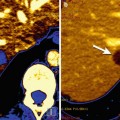
18.2.3 Prostate Cancer by 1H-MRS
Since the prostate gland is of a relatively small size and, similarly to the breast, is embedded in adipose tissue, advanced pulse sequences and special endorectal coils need to be used for prostatic 1H-MRS. Multidimensional MRSI and three-dimensional MRS acquisitions can be performed at 1.5 T in about 10–15 min at a spatial resolution down to 0.4 mL. Using these protocols, several groups have demonstrated that 1H-MR spectra of the prostate gland contain tCho and tissue-specific metabolite citrate. As for breast and brain cancers, the increased levels of tCho are indicators of malignancy and disease recurrence in the prostatic gland [35]. Because the prostate gland has physiologic and metabolic functions unique from the rest of the body, the normal prostate gland accumulates remarkably high levels of the metabolite citrate relative to other tissues. This is achieved by the ability to accumulate high cellular levels of zinc in secretory epithelial cells that inhibit citrate oxidation. Citrate can be seen by MRSI [36] and its decreased levels correlate with the Gleason score. The ratios of [citrate/tCho] were also predictive for recurrent prostate cancers after external beam radiation therapy with sensitivity of 89 % and specificity of 82 % [37].
Nowadays, the rapid implementation of 3 T scanners allows for improved multiparametric MRS prostate imaging with faster scans, increased signal-to-noise, and better quantification [38–40]. While the use of an endorectal coil is indispensable at 1.5 T, external phased-array coils might provide adequate signal-to-noise and sufficient spatial and spectral resolution at 3 T [41].
18.2.4 Other Cancers by 1H-MRS
As mention above, increased tCho levels is rather a general neoplastic phenomenon for a variety of cancers. Indeed, extracranial head-and-neck tumors and metastatic lymph nodes have demonstrated increased [Cho:Cr]-ratios at 1.5 T [42]. Patients with head-and-neck squamous cell carcinoma showed not only changes in choline and lipid peaks but also in lactate [43, 44]. In vivo 1H-MRS is still in its infancy for detection of abdominal and pelvic lesions in gynecological cancers. However, a recent study by Italian colleagues has provided an encouraging evidence that three-dimensional 1H-MRS is clinically feasible in ovarian cancer patients even at 1.5 T [45]. A tCho peak was detected in 17 out of 19 malignant tumors (sensitivity 89 %) and absent in 20 out of 21 apparently healthy pelvic tissues. In addition, 3 out of 4 benign lesions revealed a tCho peak resulting in overall specificity of 84 % (21 out of 25 for nonmalignant and benign together) [45].
18.2.5 Introduction of Hyperpolarized 13C Carbon MRS
Unlike hydrogens (100 %), the natural abundance of 13C nuclei is low (1.1 %) which provides this technique with low intrinsic sensitivity. However, it also allows for the use of isotopically enriched tracers. The use of [1-13C]glucose allowed for 13C-NMR observation of glucose fluxes in perfused cells and organs [46]; however, the low sensitivity of 13C results in very long acquisition times in humans and constitutes a problem for clinical application of 13C-MRS. Yet another technique, called dynamic nuclear polarization (DNP), came to rescue. The technique increases signal-to-noise of the 13C-signal by 50,000-fold by producing hyperpolarized 13C-labeled substrates [47]. Hyperpolarized 13C-tracers have short lifetime, meaning that hyperpolarized 13C-MRS must be completed within a few minutes after preparation of an injectable hyperpolarized 13C-tracer. This technique is still in its infancy and has been almost exclusively used in animals; only selected MR groups have all necessary hyperpolarizer equipment for on-site tracer production. Nevertheless, the approach has its promising features.
The first and, as of today, the major substrate to be proved useful for in vivo 13C-MRS of cancer was [1-13C]pyruvate[48, 49]. Pyruvate is rapidly taken up in the body and its metabolic fate depends on the nature of the organ. In the tissue with high mitochondrial activity (where pyruvate is primarily feeding into the TCA cycle), pyruvate is decarboxylated and produces acetyl-CoA. In tissue with high glycolytic rates (such as the muscle and, of course, in cancerous tissues), [1-13C]pyruvate is metabolized to [1-13C]alanine and, subsequently, to [1-13C]lactate, the end product of glycolysis. Increased aerobic glycolysis and lactate accumulation is the main metabolic hallmark of oncogenesis. As such, using 13C-MRS, the conversion rate of [1-13C]pyruvate to [1-13C]lactate has been shown associated with tumor grade [48]. [1-13C]pyruvate studies have been conducted in prostate, liver, and brain cancer and carcinoma animal models. An elegant study from an established UCSF group [50] has recently reported on metabolic glycolytic changes in cMyc-induced liver cancer in the mouse. Metabolic switch to a highly glycolytic profile happened early in tumorigenesis and preceded tumor formation in the liver as seen in increased lactate and alanine formation from pyruvate even during the pre-tumor stage (Fig. 18.3, top panel). Moreover, a metabolic response with decreased pyruvate-to-lactate conversion was detectable as early as 3 days of doxycycline treatment in cMyc-tumor-bearing animals (Fig. 18.3, low panel) [50]. The similar findings have been reported for temozolomide and radiotherapy treatment in glioma brain tumor models with [1-13C]pyruvate [51, 52]. Decreased lactate-to-pyruvate ratios were seen in temozolomide-treated brain tumors at day 1 of treatment, while no reduction in tumor volume was present until day 5–7 of treatment [51]. In a rat C6 glioma tumor model, the ratio of hyperpolarized lactate to pyruvate was decreased from 0.38 to 0.23 (p < 0.05) by 72 h following whole brain irradiation with 15 Gy [52]. 13C-MRSI measurements of the conversation of hyperpolarized [1-13C]pyruvate into lactate have been used to image tumor LDH activity and its inhibition upon chemotherapy and AKT/PI3K/mTOR pathway inhibition [53–55].
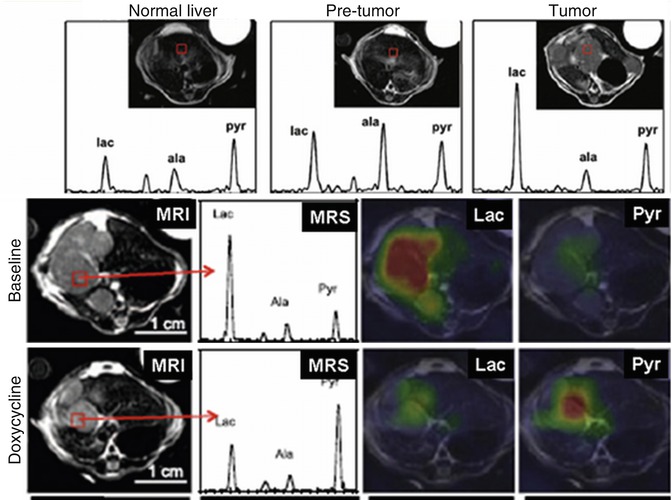
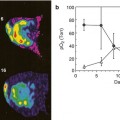
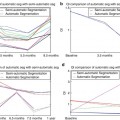
Fig. 18.3
Hyperpolarized in vivo 13C-MRS on mouse xenografts with cMyc-liver cancers. Conversion of hyperpolarized [1-13C]pyruvate to alanine and lactate is increased even in the pre-tumor stage (top panel). Doxycycline treatment reverses this glycolytic transformation already 3 days after treatment (low panel) (Adapted from [50])
Other 13C hyperpolarized tracers have been recently used. Anti-VEGF therapy in mouse HT29 and LoVo colorectal carcinoma xenografts led to significantly decreased 13C fluxes between hyperpolarized pyruvate and lactate as well as increased production of [1,4-13C]malate from hyperpolarized [1,4-13C]fumarate in parallel with tumor necrosis [56]. The use of hyperpolarized [1-13C]glutamate allowed in vivo detection of α-ketoglutarate, an intermediate in the Krebs cycle, with controls HIF1 stability in a variety of tumors [57, 58]. In addition, intravenous injection of hyperpolarized 13C-bicarbonate can be potentially used for noninvasive pH imaging [59]. There is strong resemblance between two metabolic imaging techniques, 13C-MRS and 11C-PET, and the experience gained during development of PET protocols may be useful in accelerating clinical translation of hyperpolarized 13C-MRS [60]. In summary, hyperpolarized 13C-tracers allow for in vivo 13C-MRS assessment of metabolic transformations. The approach has been successfully applied in several preclinical animal models, and first clinical trials have recently been initiated.
18.2.6 Application of 19F Fluorine MRS
19F-MRS has historically been used for in vivo pharmacokinetics (PK) studies since numerous xenobiotics contain fluorine in their structure. 19F-MR has its advantages such as has high gyromagnetic ratio compared to other non-proton nuclei, no background signal (our organs contain no abundant fluorine-based compounds), and 100 % abundance. The disadvantages of 19F-MR for in vivo PK include low-intensity signals, complex peak shapes that result in further signal loss, long T1 spin–lattice relaxation times, as well as long retention times due to low hydrophilicity or water solubility of most fluorinated compounds. Nevertheless, in vivo 19F-MRS has been successfully applied in the brain to assess delivery of trifluorinated neuroleptics (fluphenazine and trifluoperazine) and trifluorinated antidepressants (fluoxetine and fluvoxamine) [61, 62], in the liver to assess drug metabolism offluorinated compounds [63–65], and in the eye to assess the clearance of corticosteroid drug (triamcinolone acetonide phosphate) [66]. A variety of 19F-MRS PK studies have been performed in animal models and in colorectal cancer patients treated with anticancer compounds such as 5-fluorouracil (5-FU), capecitabine, 3-aminobenzamide, and 4-borono-2-fluorophenylalanine (F-BPA) to assess tumor delivery, biodistribution, and metabolism [63, 67–71]. In addition, tumor metabolism and microenvironment can be investigated by 19F-MRS using 19F-labeled biological reporters [72–74]. However, the recent advances in radiochemistry and PET provide more sensitive approached for in vivo PK when compared to 19F-MRS. Indeed, a single injection of 18F-fluoro-BPA has recently been successfully used in a mouse model of human oral carcinoma in order to assess its biodistribution by micro-18F-PET [75]. The changes in tumor uptake of 18F-labeled 5-FU before and after treatment with bevacizumab were observed in patients with newly diagnosed and untreated metastatic colorectal adenocarcinoma [76]. Novel 11C-labeled drug candidates (such as 11C-erlotinib) are under development for noninvasive PET PK studies [77, 78]. Due to its superb sensitivity and specificity to the target, PET has also multiple advantages (compared to 19F-MRS) while using biological reporters in cancer cells in vivo. 18F-Fluorothymidine (FLT) has become a reliable proliferation marker for PET imaging both in animal models as well as in humans [79, 80].
18.3 High-Resolution Ex Vivo NMR Spectroscopy
In vivo MR spectra of cancer patients (as described above) are performed at “moderate” magnetic field strength (usually from 1.5 to 3 T). These relatively low field strengths and the fixed positions of molecules in the living tissues put limitation on the spectral resolution and low limit of detection. As such, only a small number of high-abundant metabolites can be observed. Ex vivo NMR spectral analyses of tissue specimens can be performed at much higher filed using high-resolution vertical bore NMR spectrometers (from 7 to 21 T) resulting in simultaneous detection and quantification of dozens endogenous metabolites in cells, body fluids, and tissues. As such, high-resolution ex vivo 1H-NMR spectroscopy (often referred as “metabolomics” or “metabonomics”) can be seen as a preclinical validation tool and a proof-of-the-principle technique for novel metabolic markers in cancer. Historically, the first pioneering NMR studies on cancer metabolism were performed in cell and tissue extracts. They have confirmed that choline metabolism is significantly altered in a large variety of human [31, 81–86]. Moreover, the well-resolved 1H-NMR spectra of breast cell and tissue extracts have revealed three primary peaks with a trimethylamine moiety [R-(CH2)2-N+-(CH3)3
 New Therapies and Functional-Molecular Imaging
 Overview of Functional MR, CT, and US Imaging Techniques in Clinical Use
 MRI Hypoxia Measurements
 DCE-US: Evaluation of Angiogenesis
 Dual-Energy and Spectral Energy Computed Tomography: Oncological Body Applications in Clinical Use
 Medical Image Computing for Oncology: Review and Clinical Examples


Related posts:
New Therapies and Functional-Molecular Imaging
Overview of Functional MR, CT, and US Imaging Techniques in Clinical Use
MRI Hypoxia Measurements
DCE-US: Evaluation of Angiogenesis
Dual-Energy and Spectral Energy Computed Tomography: Oncological Body Applications in Clinical Use
Medical Image Computing for Oncology: Review and Clinical Examples
Stay updated, free articles. Join our Telegram channel
Full access? Get Clinical Tree
