Fig. 12.1
The oxygen transport from the lung to every cell of the body is described by two mechanisms. Most of the oxygen molecules bind to hemoglobin (Hb), whereas the minority of oxygen molecules dissolve in blood plasma and tissue fluids [46]. Deoxygenated hemoglobin (deoxyHb) and dissolved oxygen molecules are paramagnetic, increasing the R2* and R1 relaxation rates [18, 19]
In pure blood, R2* can be approximated by a simple linear or quadratic function dependent on the concentration of deoxygenated hemoglobin the deoxyHb concentration (i.e. [deoxyHb]) and thus the blood-oxygen saturation (sO2) and the hematocrit level (Hct) [51]. In tissue, direct correlation of sO2 or even pO2 with R2* is poor, though there are distinct trends [22, 32, 47, 50]. The deoxyHb fraction causes a frequency shift that is also dependent on the hematocrit (Hct), the volume fraction of the deoxygenated blood (dBVf), the vessel architecture, and the oxygen saturation in deoxyHb containing vessels (Y):
(12.1)
A variety of approaches (qBOLD) attempt to quantify the frequency shift from the difference in gradient and spin echo signals [48, 52–55]. This adds new uncertainties, since this difference is also influenced by macroscopic field inhomogeneities, T2, and – depending on the sequence – also by water diffusion. Accordingly, preliminary results are encouraging, but the complexity of the model and the examination is hampering the clinical translation of the approach [56].
Likewise, the longitudinal relaxation time T1 (or rate R1 = 1/T1) has been investigated as oxygen marker. Notably, R1 scales with the concentration of “free,” i.e., dissolved oxygen molecules (i.e. [O2]) [19, 57]. This has been applied to oximetry of well-defined microenvironments such as vitreous humor [58], but the separation of the pO2 effects on R1 from other tissue-related effects by simple quantification of R1 is not straightforward, and native T1 mapping has not yet been utilized to assess the oxygenation of tumors.
12.2.2 Oxygen-Enhanced MRI
In the attempt to separate the influence of oxygenation on the MR relaxation rates from other sources, different groups have investigated the change of the relaxation rates R2* and R1 during changes of oxygenation (e.g., induced by inhalation of oxygen) as a marker for blood or tissue oxygenation, respectively. In response to oxygen breathing, the additional oxygen molecules bind to hemoglobin and dissolve in plasma and tissue fluids. In arterial blood, the fraction change of the deoxyHb concentration (i.e. [deoxyHb]) and thus R2* is negligible, but [O2] changes significantly due to a sixfold pO2 increase, causing an R1 increase. In venous blood pO2 doubles causing significant decrease in deoxyHb, which results in a strong R2* drop, whereas [O2], and thus R1, barely changes (Fig. 12.2). Breathing oxygen thus alters R1 and R2*, depending on the composition of a voxel but also dependent on blood flow and volume changes [61].
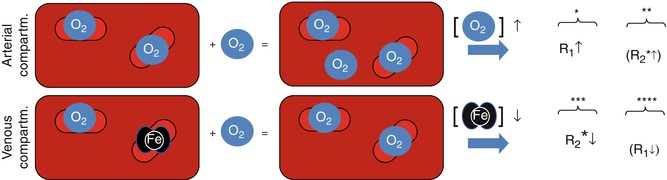
Fig. 12.2
Simplified schematic of the effect of an oxygen breathing challenge on the relaxation rates R2* and R1 (neglecting flow). The size of arrows and letters indicate the strength of the effect (*See Young et al. [57], **see Schwarzbauer and Deichmann [59], ***see Ogawa et al. [18], and ****see Blockley et al. [60])
12.2.2.1 Oxygen-Enhanced MRI Using BOLD Contrast and R2* Quantification
The interest in R2*-weighted OE-MRI was mainly driven by clinical and preclinical results from the 1990s showing that the BOLD response to carbogen (abbrev. Cb and consisting of 95 % O2 and 5 % CO2) breathing differed between tumors and normal tissue [49, 62–64] (Fig. 12.3).
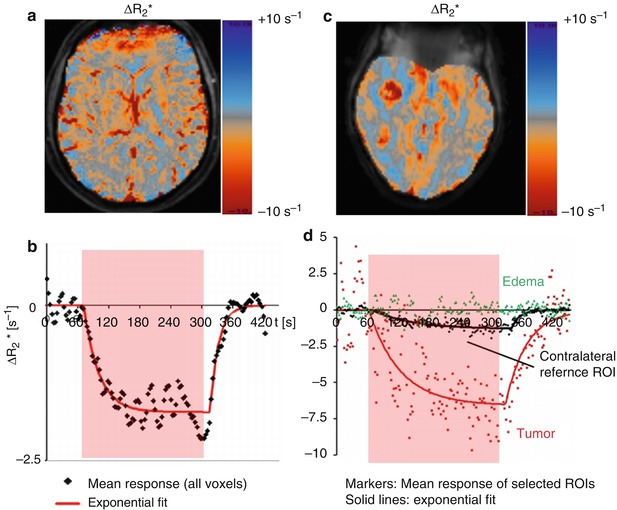
Fig. 12.3
ΔR2* response overlays (a, c) and response curves (b, d) obtained in a healthy volunteer (left) and a patient (right). The response curves represent the average response from all voxels within a ROI. In the volunteer, all voxels are selected; in the patient, ROIs representing enhancing tumor and edema are selected manually. The R2* response amplitude differs between normal and tumor tissue (c). The response in healthy brain parenchyma is well represented by a piecewise exponential function (b). The response in the pathological tissue is more complex (d) (Data: courtesy of Dr. Petra Mürtz, Prof. H. H. Schild, University of Bonn, Germany)
Since then, BOLD MRI has been frequently investigated as a monitoring tool to assess the tumor response to vasomodulation, e.g., using respiratory challenges (Cb) or drugs [21–26, 31, 32, 65–67]. Although here MRI is not directly used to measure tumor hypoxia, it is still a helpful tool in the planning of therapies that aim at elevating the oxygen tension of tissue and by this alleviate the effect of hypoxia on the radioresistance of tumors. Preliminary work showed a good correlation between the changes in pO2 and BOLD measures [22, 32, 67] during Cb breathing (Fig. 12.4), whereas the relationship between the native pO2 of tissue and the BOLD changes remains unclear.
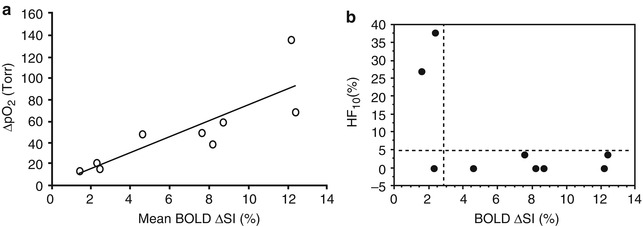
Fig. 12.4
Relationships between pO2 and BOLD responses to oxygen challenge. (a) A significant linear correlation was found between mean increase in tissue pO2 (ΔpO2) and mean spin echo planar BOLD signal increase in nine 13762NF rat breast tumors with respect to oxygen breathing challenge (r 2 < 0.7; p < 0.001). (b) Comparison of the final hypoxic fraction (HF10) with oxygen breathing as a function of BOLD signal response (ΔSI) suggests strong predictive value. For most tumors (6 of 9) a large BOLD response coincided with low residual HF10. A small BOLD response indicated a large residual hypoxic fraction in 2 of 3 tumors (Reproduced with permission from Zhao et al. [32]
On the other hand, there is preliminary but promising evidence – based on basic and mostly preclinical research – that the R2* response to Cb is determined by vascular function and architecture [16, 23] and predicts the responsiveness of a tumor to a radiation treatment [31].
Various scanning techniques have been investigated for oxygen-enhanced BOLD measurements. R2*-weighted gradient-echo signal intensities are not only sensitive to changes of R2* and [deoxyHb] but also to changes of inflow and R1, particularly when using short TR and high flip angles [61]. Likewise, the quantitative ΔR2* estimate can be derived from the logarithmic ratio of the signal intensities at two different time points (e.g., before and during oxygen breathing). The excellent temporal resolution of single gradient-echo sequences, however, makes them well suited for dynamic volumetric experiments. With multi-gradient-echo sequences and a multi-echo fit, it is possible to separate the R2* changes at the expense of either spatial or temporal resolution. Alternatively, R2* can also be derived from the line width of the water resonance peak using spectroscopic imaging. Using high spectral and spatial resolution (HiSS) MRI in a preclinical study, it was shown that the percentage difference in the height and integral of the water peak best correlates with the changes of pO2 during Cb breathing [21, 65, 67, 68]. Dynamic sampling of the R2* response is advisable since the kinetics of the response to an oxygen challenge depends on the underlying vasoreactivity and may differ between normal and pathological tissue (Fig. 12.3). The optimal timing of any single pre and post measurement is thus hardly predictable. In normal tissue, the R2* response to an oxygen-enhanced block challenge is well described by piecewise exponential functions [28], and in pathological tissue diverse kinetics have been observed [26].
12.2.2.2 Oxygen-Enhanced MRI Using TOLD Contrast and R1 Quantification
In T 1-weighted oxygen-enhanced MRI (OE-MRI) sometimes referred to as TOLD (Tissue-Oxygen-Level-Dependant contrast MRI), molecular oxygen is inhaled in the form of either pure oxygen (100 % O2) or as an admixture of oxygen (typically 90–98 % O2) and a small percentage of carbon dioxide (typically 2–5 % CO2). It has been recognized for several decades that when molecular oxygen is dissolved in blood and tissue plasma, the longitudinal relaxation rates of protons (termed R 1) are increased [57, 69], but this contrast mechanism has only been exploited more recently enabled by improvements in MRI scanner hardware and analysis methods. Initial clinical interest has centered on how this tissue contrast mechanism may map regional oxygen tension in normal and diseased lungs [70–72]. Subsequent research has also addressed how this technique may detect, quantify, and map oxygen delivery from the lungs via the blood stream [73] to healthy tissues [20, 74–77] and to tumors [78, 79]. As the method simply uses medical oxygen (or Cb) and standard MRI equipment, with no investigational tracers or devices, it is readily translatable between animal models and humans.
Initial preclinical experiments showed small, but significant increases in tumor R1 in squamous cell cancer murine models on challenge with 100 % oxygen at both hyperbaric conditions [80] and normal pressure [78]. Similarly, significant increased in tumor R1 has been reported in the well-vascularized tumor tissue in Dunning R3327 rat tumors [81], GH3 murine prolactinomas [82], orthotopic murine U87 glioblastoma breathing Cb [83], and in the peripheral zones of the rabbit VX2 carcinoma model induced both by 100 % oxygen and by various admixtures of hyperoxic gas containing up to 9 % CO2 [84]. In this latter study, elevated pO2 was detected using invasive measurements with the OxyLite system. Weak but significant positive relationship between tumor blood flow (measured by DCE-MRI) and magnitude of R 1 increase induced by 100 % oxygen was found.
Consistent data has been provided in three clinical studies of T 1-weighted OE-MRI. An initial report of three patients with non-small cell lung cancer recorded small increases in tumor R 1 following Cb inhalation [85]. Subsequent study in patients with various solid tumors including ovarian, cervical, and gastrointestinal tract cancers showed increases in tumor R 1 induced by 100 % oxygen that had some spatial mismatch with perfusion measured by DCE-MRI [79]. Finally, similar data have been reported in well-vascularized regions of human glioblastoma multiforme [86].
These preclinical and clinical data suggest that in well-vascularized tumors, breathing hyperoxic gas causes an increase in tumor R 1 due to an increased concentration of oxygen dissolved within the tissue plasma. However, not all tumor regions are well oxygenated with near-complete hemoglobin saturation, and little or no increase in tumor R 1 has been reported in some models, for example, in sublines of the Dunning R3327 rat model where larger tumors, and those tumors with poor vascularization, showed distinctly different behavior from the significant changes detected in small well-vascularized lesions [81]. One explanation for these data is that negligible excess oxygen is delivered to some tumor regions and cannot be detected in the plasma and tissue fluid within those tumor regions.
More recently, it has been proposed that the signal changes observed in T 1-weighted OE-MRI may be more subtle than first thought and may provide binary distinction of those tissue regions that are hypoxic and those that are normoxic. Decrease in R 1 following oxygen inhalation in tumors has previously been reported [61, 87], and this may reflect hypoxic tumor regions with suboptimal hemoglobin saturation that show reduced blood R 1 as oxygen molecules bind to deoxygenated hemoglobin molecules and increase the ratio of oxygenated to deoxygenated hemoglobin [60, 88]. Thus, reduction in tumor R 1 may identify those hypoxic regions where available deoxygenated hemoglobin species bind excess delivered tissue oxygen.
Several studies have evaluated how T1-weighted OE-MRI affects tumor voxels that correspond to hypoxic regions. In a subcutaneous murine U87 glioma model, both increase and decrease in R 1 were measured. Increase in R 1 corresponded to well-perfused tumor regions, whereas decrease in R 1 corresponded to poorly perfused areas (Fig. 12.5). Moreover, the decrease in R 1 correlated positively with hypoxic fraction measured by pimonidazole staining [86]. Regional decrease in R1 has also been reported in two studies of human glioblastoma [86, 87] that correspond to poor perfusion and slower R2*.
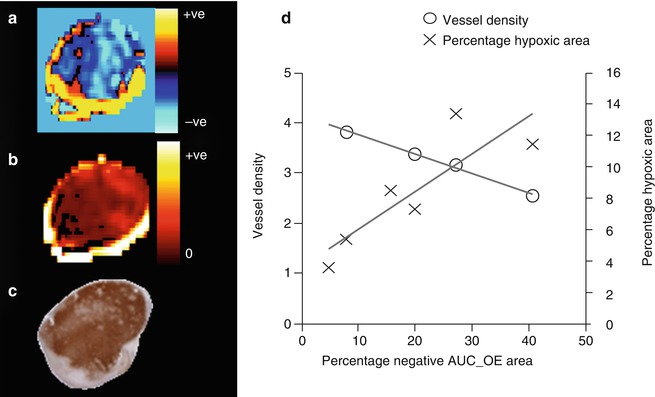
Fig. 12.5
T1-weighted OE-MRI and relationship to histology in a U87 glioblastoma model. (a) OE-MRI shows areas of increased and decreased R1 (s−1). The negative R1 corresponds to (b) negligible perfusion on DCE-MRI and (c) hypoxic tumor on pimonidazole staining. In distinction, a well-perfused vascular rim shows increase in R1. (d) In a cohort of six tumors, the percentage of the tumor with negative R1 changes in the area under the curve (AUC) correlated strongly with the percentage of tumor hypoxic area. There was also negative correlation between negative R1 changes and vessel density measured by CD31 (Data from Linnik et al. [86])
It should be stressed that while T 1-weighted OE-MRI shows promise as a noninvasive method of mapping tumor oxygenation status and identifying tumor hypoxia, the technique is in its infancy and has yet to be validated in multiple animal models and then qualified in clinical data.
12.2.2.3 Simultaneous Approaches
Limitations of the BOLD and TOLD approaches encompass the lack of specificity in the absence of a response. In case of BOLD measurements, this could be either due to the absence of blood or due to a high native blood oxygenation (absence of deoxyHb) [4]. In the case of TOLD, again, a negligible change can be either due to the absence of any O2 delivery or due to a high native deoxyHb concentration and a predominant binding of the additional O2 molecules to hemoglobin. Preliminary studies demonstrate that the joint measurement of R1 and R2* overcomes this lack of specificity as shown in Fig. 12.6 [82, 86, 87, 89].
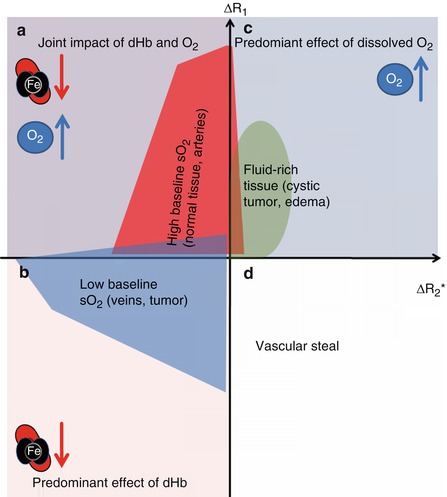
Fig. 12.6
Schematic representation of tumor R1 and R2* induced changes following oxygen or Cb inhalation. (a) In regions that are well oxygenated, excess dissolved oxygen will increase the plasma and tissue fluid R1 but will have negligible effect on hemoglobin (Hb) saturation (hence small effect on R2*). (b) In distinction, hypoxic regions with suboptimal oxygen saturation will show preferential binding of excess oxygen molecules to deoxygenated Hb molecules, which reduces the content of paramagnetic deoxyHb, shortening both R2* and R1. (c) In the absence of deoxyHb (e.g., fluids like in cystic tumor regions or edema), the excess oxygen in solution prolongs both R1 and R2*. (d) Non-oxygenation-related R2* increase and R1 decrease, presumably related to vascular steal (Figure adapted from Remmele et al. [87])
Steady-state short-TR gradient-echo sequences can be used to simultaneously estimate R2* (from the gradient-echo signal at TE) and R1 (from the T1-weighted signal intensity at TE = 0 ms) [87]. Using high flip angles, slice-selective sequences and without outer signal suppression the signal at TE = 0 ms are primarily influenced by inflow. Such a sequence has thus been investigated as simultaneous flow and blood oxygenation level dependent sequence (FLOOD) [90, 91]. In combination with lower flip angles and inflow suppression, the sequence becomes sensitive to both changes of deoxyHb, via R2*, and changes of dissolved oxygen molecules via R1. This approach has been used to detect tissue of non-normoxic characteristics in cerebral tumors [87, 92] (Fig. 12.7).
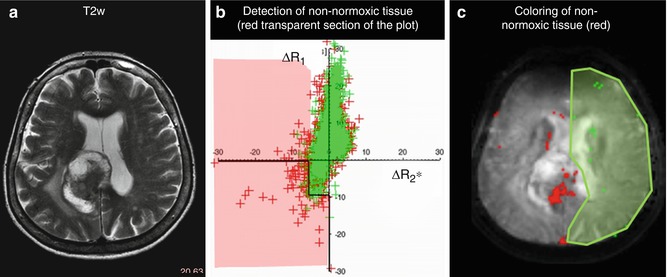
Fig. 12.7
Detection of tissue voxels with non-normoxic characteristics based on the simultaneous measurement of R1 and R2* in response to Cb. (a) T2-weighted image of a patient with a brain metastasis. (b) Non-normoxic voxels are detected based on the position in the ΔR1 over ΔR2* scatter plot respective to the position of voxels from a reference region (green). (c) Coloring of non-normoxic voxels (red) and the selected reference voxels (green) as overlay on an R2*-weighted image (Figure adapted from Remmele et al. [87])
12.2.2.4 Conclusion on Oxygen-Enhanced MRI
The use of standard anesthesia gases and conventional MR sequences makes T2*- and T1-weighted OE-MRI a promising approach towards qualitative oxygenation assessment in clinical oncology. Future work needs to clarify the choice of gas inhaled (100 % oxygen vs. Cb) and the analysis methods employed (which biomarker should be derived). Since physiological changes other than oxygen dynamics can alter the tissue relaxation properties, not all signal changes can be ascribed to the presence of molecular oxygen or deoxyHb in a voxel, and this raises questions over whether an increase in tissue R1 or R2* can be calibrated into a measurement of tissue pO2. Well-designed histological and histographic experiments are required to understand the precise meaning of the signal changes in tumors with a range of vascular and hypoxic status.
12.2.3 19F MR Imaging
BOLD and TOLD MRI have the great advantage of exploiting endogenous contrast, either intrinsic or induced by inhaled oxygen. However, except in well-defined tissue milieux such as vitreous humor of the eye [58, 93], CSF [94] or major blood vessels [95], they do not provide quantitative oximetry. Quantitative in vivo MR oximetry has been demonstrated based on the relaxation rates of perfluorocarbons (PFCs) using 19F MRI, as pioneered by Thomas et al. [17, 96]. Dynamic pO2 measurements may be achieved within minutes from multiple locations within a tissue with a precision of 1–3 Torr in relatively hypoxic regions [17].
PFCs exhibit very high gas solubility, are essentially inert, and are nontoxic. For oximetry the most crucial property is the ideal liquid–gas interaction with oxygen, obeying Henry’s law and providing a linear dependence of the 19F spin–lattice relaxation rate R1 = A + B pO2 (e.g., Fig. 12.8), as reviewed previously [17, 96, 98]. The relationship has been reported across the whole range of pO2 values including hyperbaric conditions [99]. However, there is additional sensitivity to magnetic field and temperature, necessitating appropriate calibration curves [100–102]. PFCs are exceedingly hydrophobic so that oxygen sensitivity is independent of most environmental components, such as metal ion concentrations, pH, and proteins, and therefore calibration curves established in vitro may be applied in vivo [100, 103–105]. MR oximetry has been demonstrated using various PFCs: initially perfluorotributylamine and perfluorooctyl bromide were favored, but these multi-resonant reporters have been largely replaced by hexafluorobenzene (HFB) and perfluoro-15-crown-5 ether (15C5) [17, 106].
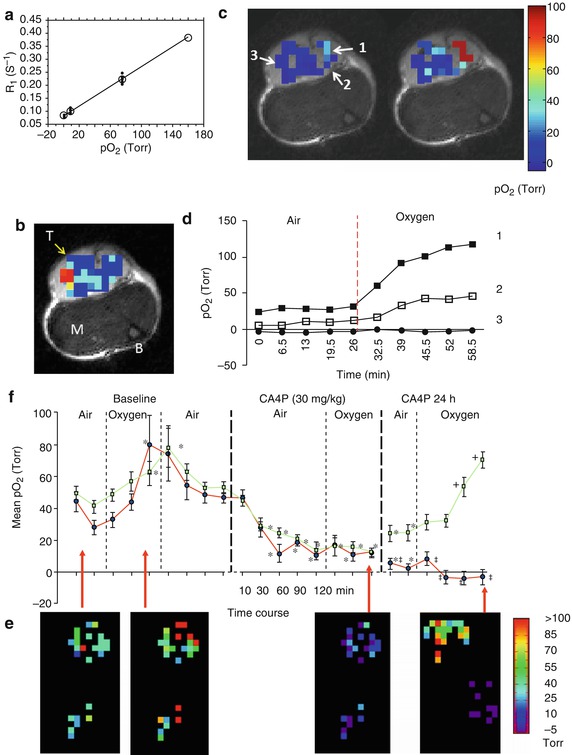
Fig. 12.8
Quantitative oximetry using 19F NMR. (a) The 19F NMR spin–lattice relaxation rate (R1) of HFB (hexafluorobenzene) shows a linear response to pO2: at 37 °C and 4.7 T, R1 (s−1) = 0.0835 × 0.001876pO2 (Torr) (Adapted from Zhao et al. [17]). (b) HFB (50 μl) was injected directly into a Dunning prostate R3327-AT1 tumor (~0.7 cm3) growing in the thigh of a rat in a fan pattern to provide well-distributed signal throughout a plane of the tumor, as shown in the 19F signal density map overlaid on a high-resolution T2*W image (M muscle, B bone marrow, T tumor). (c) pO2 maps were obtained using FREDOM, while the anesthetized rat breathed air (left) and after about 30 min oxygen breathing (right) revealing pO2 heterogeneity. (d) Dynamic changes in pO2 for three specific voxels (indicated by arrows in (c) upon oxygen breathing). Voxels 1 and 2 showed significant pO2 enhancement (p < 0.01) [Rami Hallac (2012), Unpublished data]. (e) Acute response to vascular-disrupting agent observed by FREDOM in a representative subcutaneous 13762NF rat breast tumor. pO2 maps indicated two separated groups of voxels representing central and peripheral tumor regions. Twenty-five individual voxels were traceable from the pretreated baseline to 2 h after administration of the vascular-disrupting agent combretastatin (CA4P, Zybrestat®), and further measurements were possible 24 h posttreatment. Significant decrease in pO2 was evident for all the individual voxels after CA4P, and pO2 no longer responded to oxygen inhalation after 2 h. The 24 h maps showed improved pO2 and significant response to oxygen breathing in the peripheral region, but not in the central region. (f) Mean pO2 curves are shown for the peripheral (□) and central (●) voxels of this tumor. *p < 0.05 from baseline air, +p < 0.05 from 24 h air, ‡p < 0.05 from periphery (Data and or figures adapted from Zhao et al. [97])
Hexafluorobenzene has many virtues as a reporter including high sensitivity to pO2, minimal sensitivity to temperature, a single 19F resonance, and ready availability [17, 101]. HFB does exhibit a particularly long T1 reaching 12 s under anoxic conditions at 4.7 T, potentially making data acquisition slow [17, 107]. To provide effective temporal resolution for dynamic measurements, Zhao et al. developed FREDOM (Fluorocarbon Relaxometry using Echo planar imaging for Dynamic Oxygen Mapping) [17], which typically provides pO2 maps in 6.5 min [107]. Recently Gallez et al. implemented a Look-Locker sequence generating maps in 90 s under similar conditions [108]. Tumor oximetry using HFB has been presented in various tumors growing in rats and mice [32, 107, 109–120]. Extensive intratumoral heterogeneity has been reported (see, e.g., Fig. 12.9a, b) with hypoxic fractions ranging from HF10 = 16 % in small Dunning prostate R3327-H tumors to 83 % in large R3327-AT1 tumors on anesthetized rats breathing air, commensurate with the “gold standard” Eppendorf electrode system [114]. While deposition of reporter molecule requires needle insertion into the tissue, just as with needle electrodes, 19F oximetry has the great advantage of allowing repeat noninvasive pO2 measurements (e.g., Figs. 12.8c and 12.9a, b). The use of a fine sharp needle (e.g., 32 gauge) and small volumes of reporter molecule (typically, 10–100 μl) makes the approach minimally invasive.
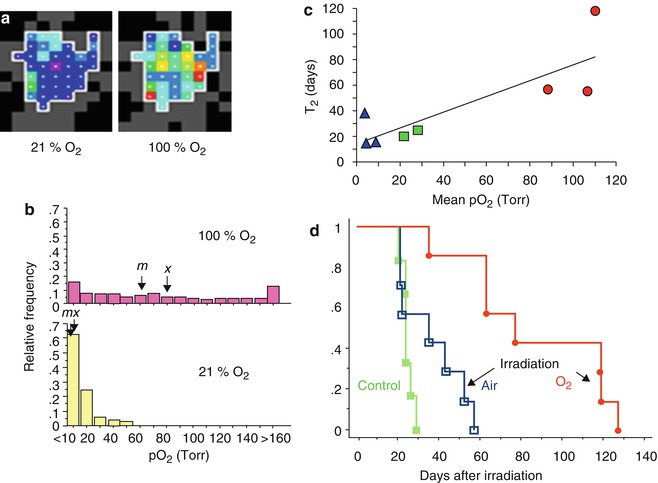
Fig. 12.9
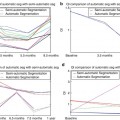
Modulating tumor hypoxia to enhance radiation response. (a) pO2 maps obtained using FREDOM in a large Dunning prostate R3327-HI tumor (3.5 cm3) following direct injection of HFB (45 μl) using 32G needle. The tumor exhibited considerable hypoxia, but some regions were better oxygenated (mean pO2 = 3.3 ± 1.0 (SE) Torr; median pO2 = 5.4 Torr; range 0–56 Torr), while anesthetized rat breathed air (21 % O2). Switching to oxygen inhalation essentially eliminated all hypoxia in this tumor as seen in map obtained 16–24 min after switching gas; mean pO2 = 63.8 ± 2.1 Torr ; median pO2 = 56.4 Torr; range 7.6–262 Torr. (b) Histograms showing pO2 distributions in regions of a group of five large tumors [size range 3.1–5.9 cm3]. During air breathing considerable hypoxia was observed, but this was significantly modified when rats breathed O2: arrows indicate mean (x) and median (m) pO2’s. (c) Tumor volume doubling time (T2) following irradiation (single dose of 30 Gy = half the TCD50) showed a strong correlation with estimated pO2 (it was actually measured using FREDOM on the previous day, while rat breathed relevant gas). Blue triangles represent large tumors breathing air during irradiation, while red circles represent large tumors on rats breathing oxygen during irradiation. Green squares represent two small tumors with air breathing. (d) Kaplan–Meier hazard plots indicate T2 for large R3327-HI tumors. Tumors on rats breathing air during irradiation showed little benefit over controls. By contrast, a significant growth delay (51 days; p < 0.01) was observed in large HI tumors, when rats breathed oxygen 30 min prior to and during irradiation [119–121]
19F MR oximetry is particularly useful for evaluating acute response to interventions, most commonly hyperoxic gas breathing challenges, (e.g., Figs. 12.8 and 12.9) [17, 32, 107, 117–123], since these are predicted to modulate tumor hypoxia. pO2 distributions and measurements at individual locations have been reported to be highly reproducible and generally quite stable under baseline conditions (Figs. 12.8d) [117, 118, 123].
Perfluorocarbon may be injected into a single location providing local pO2 by spectroscopy with spatial discrimination by virtue of the discrete site of injection [101]. However, recognizing tumor heterogeneity [3, 114] it is preferable to distribute the PFC, so as to sample diverse regions and provide a representation of the whole tumor [17] (Figs. 12.8 and 12.9).
The greatest strength is the ability to examine differential local tissue behavior to interventions. In most tumors, regions which are well oxygenated show substantial response to hyperoxic gas breathing, while initially hypoxic regions (<5 Torr) are generally quite unresponsive to acute interventions (Fig. 12.8) [101, 118, 121]. However specific tumor types show different behavior with significant response of even quite hypoxic regions to breathing oxygen [111, 118–120]. Notably, large Dunning prostate R3327-HI tumors showed extensive hypoxia, which was essentially eliminated by breathing oxygen (Fig. 12.9) [118, 120, 123]. Such modulation has been correlated with improved response to high-dose radiation, and a direct relationship was observed between pO2 at time of irradiation and subsequent tumor volume doubling time (Fig. 12.9c) [109, 120].
Other 19F MR oximetry studies have examined tumor pO2 response to castration [115], pharmaceutical drugs, or experimental agents, notably vasoactive agents such as hydralazine [121] and vascular-disrupting agents, such as combretastatin (e.g., Fig. 12.8e, f), anti-VCAM1-tTF (truncated tissue factor) coaguligand, and arsenic trioxide [97, 110, 113, 124].
Direct intratumoral injection of reporter molecule into subcutaneous tumors allows immediate interrogation of regions of interest. Oximetry based on direct injection into tissues has been reported in diverse tissues allowing measurement of oxygenation in the retina [125–127]; cerebral, interstitial, and ventricular spaces [128]; the brain, kidney, liver, gut, and muscle [35, 36, 129, 130]; and diverse tumors [17, 32, 97, 101, 107, 108, 110, 112, 115–120, 131]. Early observations, and many current implementations, have used systemic delivery of perfluorocarbon emulsions (PFCEs). These were originally developed as synthetic blood substitutes and may be administered intravenously (IV). Following IV infusion, a typical PFCE circulates with a vascular half-life of 12 h, and several reports examined tissue vascular pO2, while PFC remained in the blood [103, 132–135]. The particulate nature of PFCEs leads to extensive macrophage uptake and sequestration in the reticuloendothelial system [136]. Therefore oximetry is particularly efficient in the liver and spleen with reports examining pO2 response to oxygen breathing challenge or the influence of von Hippel-Lindau (VHL) expression and inactivation in transgenic mice [137–141]. Many PFCs show long-term tissue retention (perfluorotripropylamine is reported to have a half-life of 65 days in the liver [142]) allowing noninvasive oximetry in vivo over a period of weeks. Systemic delivery of reporter molecules does tend to bias measurements towards well-perfused tumor regions, and thus initial measurements may approach arterial pO2 [143, 144], but the approach has allowed long-term assessment of hypoxiation accompanying tumor growth (Fig. 12.10).
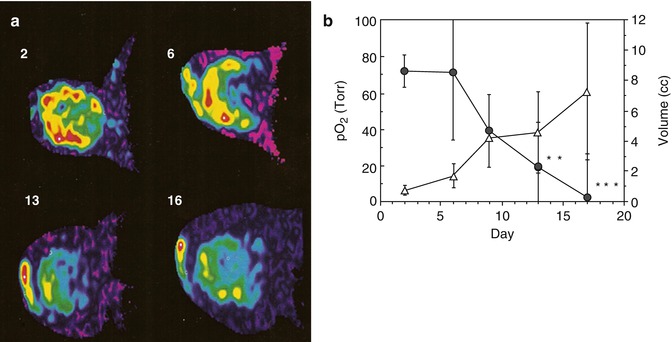
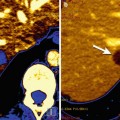
Fig. 12.10
Tumor hypoxiation accompanying growth. (a) Oxypherol blood substitute emulsion was administered intravenously to a rat bearing a Dunning prostate tumor R3327-AT1 and became sequestered in tissue. Following vascular clearance 19F MRI was used to determine the distribution of perfluorocarbon, which is overlaid on tumor outline from correlated proton MRI. Fluorine-19 spectroscopic relaxometry was used to measure pO2 in the tumor with repeated measurements over a period of 3 weeks revealing the variation in local pO2 during tumor growth. Perfluorocarbon initially resided in the vascularized peripheral region of the tumor, and pO2 was found to be about 75 Torr in the small tumor (diameter about 1 cm). As the tumor grew, the sequestered PFC retained its original distribution, but when the tumor had doubled in size, the residual PFC was predominantly in the core of the tumor and the pO2 of this region was 0 Torr indicating central tumor hypoxia. (b) Variation in mean pO2 for a group of six tumors over 16 days showing significant hypoxiation of the tissue *p < 0.05; **p < 0.002, ***p < 0.001 (Figures reproduced from Mason et al. [144])
Any technique has optimal applications and potential limitations. Currently, 19F remains esoteric on human scanners, and thus alternative approaches may be better suited to translational oximetry. The need for a reporter molecule also raises issues of FDA approval, and thus 19F MR oximetry is probably most suitable for quantitative work in small animals. It is also highly suitable for comparison with and/or validation of other methods, such as BOLD and TOLD, as discussed in other sections of this chapter.
12.3 Summary and Future Perspective
Hypoxia is one of the key parameters in oncology, and the assessment of tumor hypoxia with MRI has thus been, and still is, a matter of extensive research. Table 12.1
 New Therapies and Functional-Molecular Imaging
 Overview of Functional MR, CT, and US Imaging Techniques in Clinical Use
 Spectroscopy of Cancer
 DCE-US: Evaluation of Angiogenesis
 Dual-Energy and Spectral Energy Computed Tomography: Oncological Body Applications in Clinical Use
 Medical Image Computing for Oncology: Review and Clinical Examples


Related posts:
New Therapies and Functional-Molecular Imaging
Overview of Functional MR, CT, and US Imaging Techniques in Clinical Use
Spectroscopy of Cancer
DCE-US: Evaluation of Angiogenesis
Dual-Energy and Spectral Energy Computed Tomography: Oncological Body Applications in Clinical Use
Medical Image Computing for Oncology: Review and Clinical Examples
Stay updated, free articles. Join our Telegram channel
Full access? Get Clinical Tree
