Fig. 20.1
DECT: various image displays. (a) 70 keV monochromatic image; (b) water material density image; (c) iodine material density image with color overlay; and (d) effective-Z image with color overlay of regions of interest (ROI) highlighting various materials in the body. The ROI information can be plotted onto different spectral graphs as in Fig. 20.2
With the use of an advanced workstation application, ssDECT data can be post-processed to generate spectral Hounsfield units (HU) curves, scatterplots, and histograms (Fig. 20.2). Spectral HU curves are created by plotting attenuation values (HU) for a single material over monochromatic energies spanning from 40 to 140 keV, whereas scatterplots and histograms show pixel-by-pixel information for specific materials. The potential application of these post-processed data sets, as well as those of other specific DECT displays, can vary by organ system, as outlined below.
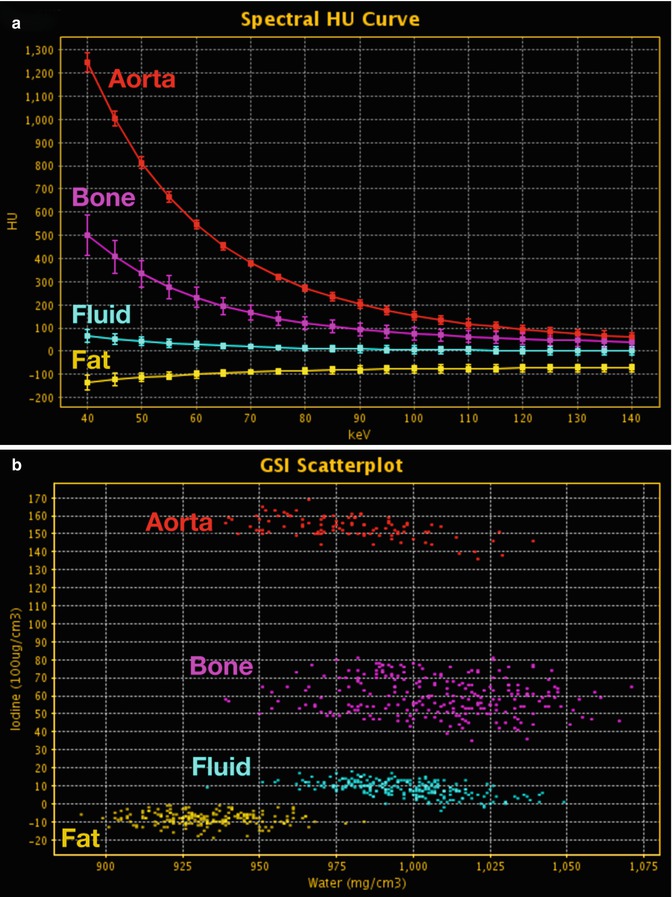
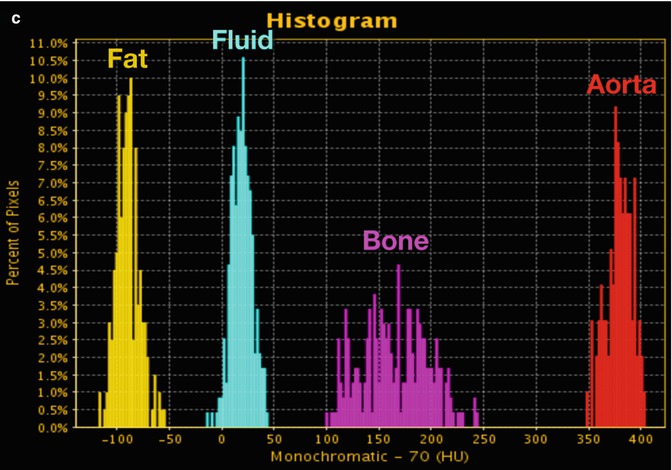
Fig. 20.2
DECT: advanced post-processing displays. (a) Spectral HU curves are generated by plotting the attenuation values of a material for every monochromatic energy from 40 to 140 keV. These attenuation curves can help characterize specific materials (e.g., aorta and bone have sharply upward-sloping curves at lower energies due to their specific k-edge, whereas fluid has a relatively flatter curve; and fat has a downward-sloping curve at lower energies). (b) DECT scatterplots are generated by plotting material components in a pixel-by-pixel display using various parameters (e.g., concentration of iodine (100 μg/mL) vs. water (mg/mL). The area encompassed by the pixels helps to classify tissue composition within the ROIs. (c) Histograms are generated by plotting the percentage of pixels within an ROI rather than by specific DECT parameters, which in this case are HU values as in the 70 keV monochromatic image. Greater separation along the x-axis indicates greater differences in composition
20.2 Chest
A solitary pulmonary nodule can be imaged to exclude malignancy by proving the presence of a characteristic benign pattern of calcification indicative of prior granulomatous disease exposure. When chest CTs are performed with iodinated intravenous (IV) contrast, a conundrum with SECT arises as to whether a hyperdense solitary pulmonary nodule is calcified or is the result of an enhancing mass. However, with DECT, calcifications have been detected on water basis pair (VNC) images 85–97 % of the time in lung nodules and lymph nodes [26]. In addition, the CT number (HU) on iodine basis pair images from dsDECT has been found to correlate with the degree of enhancement in a solitary pulmonary nodule [26]. Since malignant nodules enhance considerably more than benign nodules, a preliminary study showed that a threshold value of <20 HU on iodine basis pair images can differentiate nodules with an accuracy rate of 82.2 % [26–33]. DECT can detect calcification and measure degree of enhancement in lung nodules, masses, or lymph nodes, allowing accurate classification on a single enhanced examination, negating the need for a follow-up examination, and decreasing radiation exposure to patients, as well as giving a more streamlined answer to the patient and the referring clinician.
The imaging technique 18-fluoro-deoxyglucose positron emission tomography (18FDG-PET) CT has a proven track record in characterizing pulmonary nodules and in staging lung cancer before and after therapy. Since the maximum standardized uptake value (SUVmax) may correlate with tumor aggressiveness [34–41], this imaging study can be an important component of a treatment plan. Unfortunately, 18FDG-PET CT requires more preparation, patient time, and cooperation than DECT, as well as greater radiation exposure. Thus, DECT is being investigated as an alternative. For example, non-small-cell lung cancer (NSCLC) treatment response can be monitored on 18FDG-PET CT by SUVmax. However, the degree of viable primary tumor or lymph node enhancement with iodinated contrast (i.e., vascularity) can be measured with maximum iodine-related attenuation, which has been shown to correlate with SUVmax, thus indicating that DECT has the potential to replace or become an adjunct imaging study for monitoring NSCLC [42]. Nonetheless, further evaluation is needed to confirm these preliminary results, as well as to investigate the role of DECT for other primary lung cancers.
20.3 Liver
Hypervascular liver lesions, including metastases and hepatocellular carcinomas, are more conspicuous on contrast-enhanced images acquired at lower energy (e.g., 80 kVp) than at higher energy (e.g., kVp) [11, 43–47], but imaging at lower energy with conventional SECT necessitates a specific additional acquisition. However, a range of 101 monochromatic keV displays can be generated from dual-energy data, which combines superior contrast resolution with increased conspicuity of solid organ parenchymal masses from a single DECT acquisition [11, 44] (Fig. 20.3).
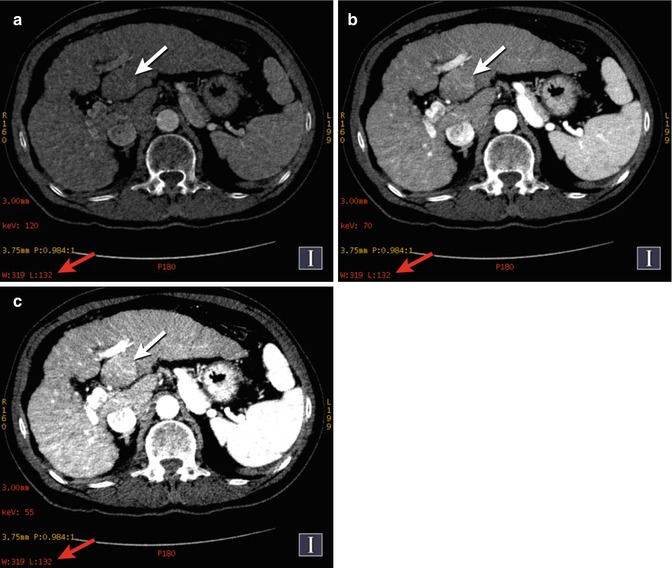
Fig. 20.3
Hepatocellular cancer (HCC). DECT-computed monochromatic images show increasing conspicuity of histologically verified left lobe HCC (a–c, white arrows) as the beam energy ([a] 120 keV, [b] 70 keV, [c] 55 keV) is shifted toward the k-edge of iodine (33.2 keV). Note that each image is depicted using the same window/level settings (a–c, white arrows)
Lv et al. determined that lower energy monochromatic images (40–70 keV) provided the most evident contrast between enhancing liver background and lesions, thus improving detection of hypervascular lesions ≤3 cm [48]. However, the contrast to noise ratio changes with the imaging phase, as well as with energy level. For example, hepatocellular carcinoma is best seen on arterial phase at 50 keV or at portal venous phases at 70 keV, whereas focal nodular hyperplasia is most conspicuous on either arterial or portal venous phase at 50 keV [49]. Furthermore, in addition to the monochromatic images, iodine basis pair images can also improve detection of HCC on portovenous phase on ssDECT [49]. Iodine concentration may also be a differentiating factor in identifying malignancy, because iodine concentration has been found to be statistically higher in focal nodular hyperplasia vs. hepatocellular carcinoma on arterial phase images [49].
The use of spectral HU attenuation curves may be helpful in improving the characterization of indeterminate hepatic lesions (i.e., the differentiation between pseudoenhancement artifact and actual contrast enhancement) [12]. For example, iodine has markedly increased attenuation at lower energy (i.e., near its k-edge of 33.3 keV) and much lower attenuation at higher keV, producing a nonlinear exponential curve with a steeper slope at lower keV. Recent research suggests that enhancing structures demonstrate sharply upward-sloping curves at lower keV, that mimic iodine’s curve, whereas nonenhancing structures have a flatter curve at lower keV, similar to the expected slope of water’s curve [12, 50, 51].
With respect to hypovascular liver lesions, the application of DECT for evaluation is evolving. A preliminary study that examined hypovascular liver lesion conspicuity by comparing blended 80/140 kVp data with pure 80 kVp lower energy acquisition failed to illustrate improved detection [52]. However, when hypovascular lesions are detected, DECT may be more helpful than SECT for characterization, particularly of incidental subcentimeter hypoattenuating liver lesions generally deemed too small to characterize. These lesions are presumably benign in asymptomatic patients; however, in patients undergoing oncological evaluation, even such small lesions may be of concern. Additional MR or multiphasic CT imaging increases cost and radiation dose (i.e., in the case of CT), as well as patient and physician unrest until a diagnosis is achieved. In a preliminary study, DECT showed increased sensitivity and specificity compared with conventional CT for differentiating small enhancing masses from cysts with the use of water (virtual unenhanced) and iodine (iodine map) basis pair displays, with spectral HU curve analysis adding further confidence in the characterization of lesions deemed indeterminate on basis pair displays [12, 53] (Fig. 20.4).
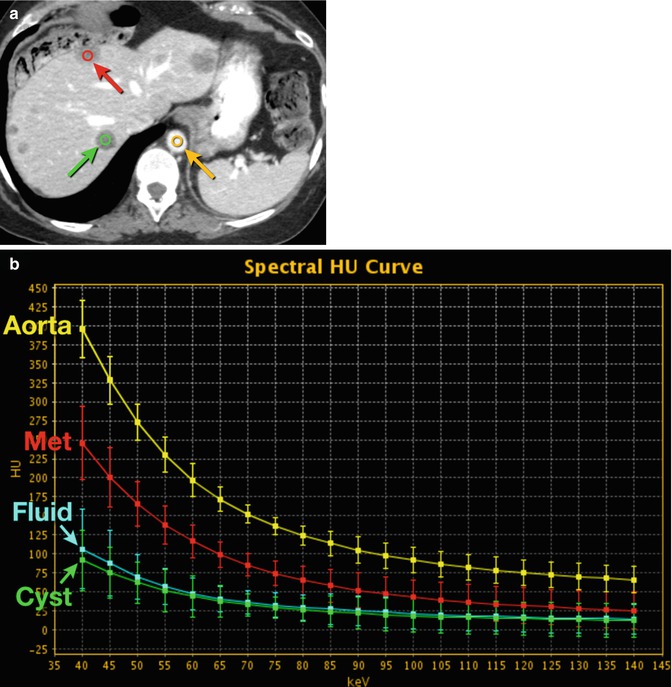
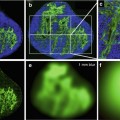
Fig. 20.4
Hepatic cyst and metastasis. (a) DECT 70 keV monochromatic image shows multiple hypodense hepatic masses, including two outlined as ROI (red and green circles). Yellow circle indicates aorta. (b) DECT spectral HU plot of the two lesions (red and green curves), the aorta (yellow curve) and fluid from gallbladder (blue curve; ROI not shown on a). Note that the more posterior hepatic lesion, a cyst, has curve attenuation morphology similar to that of nonenhancing fluid, whereas the more anterior lesion, a metastasis (Met), has curve attenuation morphology more in line with that of contrast-enhanced fluid in the aorta
Another potential use for the iodine density display is for evaluation of macroscopic portal vein thrombus. Utilizing a threshold iodine density of 11.4 100 μg/mL, Qian et al. achieved nearly 92 % specificity in differentiating bland from neoplastic thrombus on portal venous phase DECT [54].
20.4 Urinary
Clinicians are often burdened with follow-up examination(s) to exclude malignant neoplasms when renal lesions are incidentally detected [55, 56]. Although results usually reveal benign cystic lesions, up to 5.5 % are cancerous [57] and 61 % of these cancerous lesions are detected incidentally [55].
Several well-established SECT criteria classify incidentally encountered renal lesions as benign, including attenuation on true unenhanced scan equivalent to water (<20) and lack of enhancement (difference <20 HUs from true unenhanced to enhanced venous phase) [15, 58–61]; however, artifacts such as quantum mottle, beam hardening, and volume averaging have resulted in pseudoenhancement that makes accurate attenuation measurement (HU) less reliable on SECT [62, 63]. In addition, even with multiple phases on SECT (i.e., unenhanced, venous, excretory), accurate evaluation of true enhancement within smaller lesions can be problematic.
HU attenuation on SECT is calibrated with reference to water and depicted in pixels assigned shades of gray. This scheme makes it possible for different materials (e.g., iodinated contrast material, calcium, hemorrhage) to have overlapping HU values on SECT. On the other hand, DECT allocates shades of gray to each pixel by the specific material density (e.g., mg/mL), which may more accurately discriminate different materials [4, 6, 7, 11, 12].
With DECT, material density images are typically reconstructed in pairs, such as water and iodine. The identification and exclusion of iodine-containing pixels from DECT raw data allow construction of the water basis pair (VNC) display, which has the potential to be substituted for the true unenhanced SECT series [64, 65]. Like true unenhanced images, water basis pair images can facilitate diagnosis. For example, the fluid attenuation of benign simple cysts appears hypodense on both true and virtual unenhanced displays. In addition, both displays can be used in the evaluation for solid mass enhancement, as preliminary studies have shown no statistically significant difference in attenuation values between true unenhanced SECT and water basis pair DECT images [15, 66, 67]. For the iodine basis pair, vendor-specific post-processing algorithms facilitates the use of extracted iodine-containing pixels from DECT raw data to generate this display, which looks and functions similar to a subtraction image for MRI [10, 12]. For example, a nonenhancing renal lesion (e.g., a simple cyst) does not contain iodine and appears dark on iodine basis pair images, whereas iodine-enhancing structures (e.g., renal parenchyma) are depicted with various shades of gray, depending on the amount of iodine. Yet a material with a similar attenuation curve (e.g., calcium) will also be depicted on the iodine display, thus comparison with the water basis pair image is necessary for accurate characterization [12].
DECT can thus improve characterization of smaller renal lesions previously considered indeterminate. For example, improved material specificity along with advanced post-processing displays can identify diverse tissue elements within a renal angiomyolipoma (Fig. 20.5). Other various renal masses (simple cyst, hyperdense nonenhancing cyst, and solid enhancing mass) have a characteristic pattern on water and iodine material density basis pair displays [12, 58, 66]. A simple cyst will appear dark on both displays, whereas a hemorrhagic cyst will appear bright on the first (water) display and dark on the second (iodine). On water basis pair images, a solid mass will appear isodense to hyperdense compared with adjacent solid renal parenchyma, but enhancement with IV iodine contrast will make it brighter than either a simple or a hyperdense cyst on iodine material density basis pair images. Furthermore, supplementary post-processing, such as the addition of color overlay on iodine basis pair display, can improve visual differentiation of enhancing from nonenhancing structures by assigning color hues. For example, an enhancing, iodine-containing lesion could be displayed with a color ranging from brown to gold, which would help facilitate differentiation from nonenhancing, non-iodine-containing masses such as simple or hemorrhagic cysts, or even pseudoenhancement artifact (Fig. 20.6). In a study comparing SECT with DECT for differentiating enhancing from nonenhancing renal masses, DECT had higher composite sensitivity and specificity than SECT (95 and 93 % vs. 67 and 46 %, respectively), with individual reader confidence rated higher for DECT than SECT image displays [50]. In addition, spectral HU curves can be processed using a workstation to visually illustrate the different attenuation characteristics of iodine (i.e., enhancing masses) vs. non-iodine-containing lesions (i.e., avascular masses), facilitating diagnosis [12, 68] (Fig. 20.4). Iodine can also be used quantitatively as an image biomarker for enhancement in renal lesions [68]. It can be detected and its density obtained from iodine basis pair DECT images, which have had excellent congruence with true iodine amount in a phantom evaluation [69]. In an in vivo study comparing SECT HU vs. DECT 100 μg/mL, a threshold discrimination of 20 showed an improvement in sensitivity for differentiating cyst from enhancing renal masses from 27 to 95 %, respectively [70].
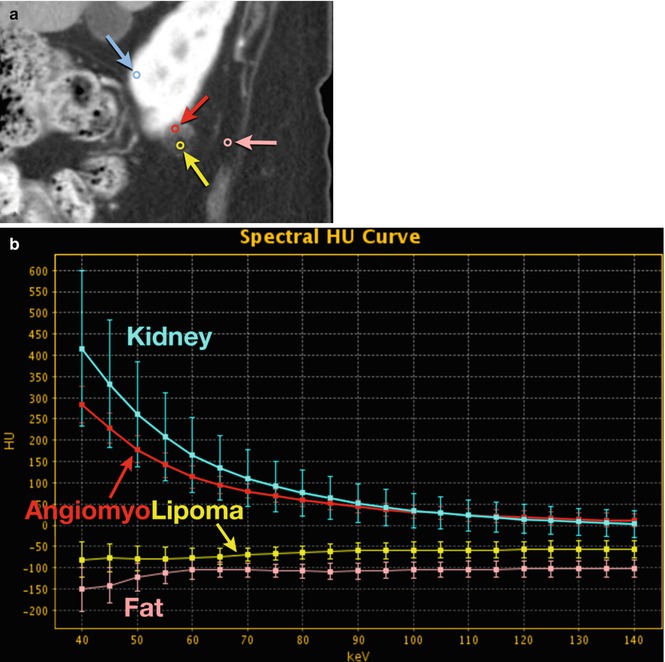
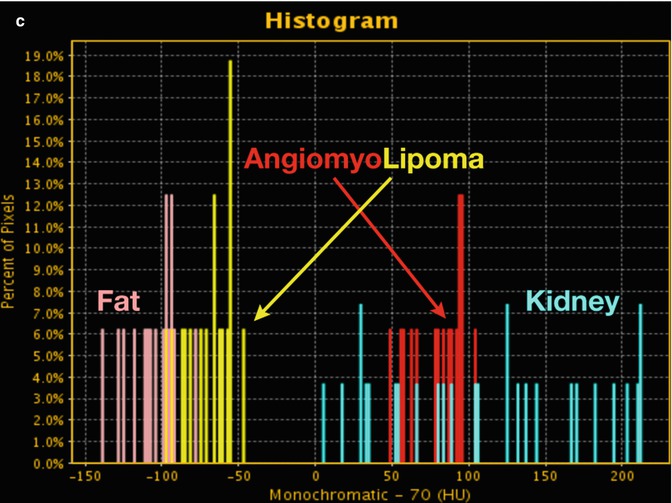
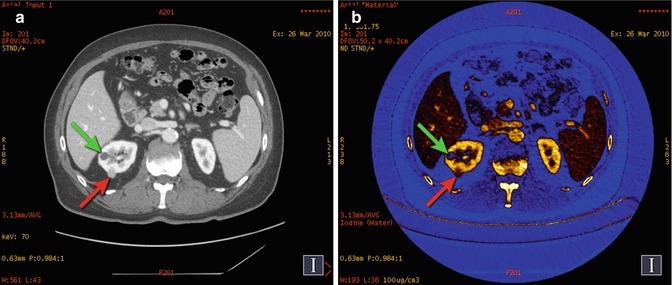
Fig. 20.5
Angiomyolipoma. (a) DECT 70 keV monochromatic sagittal image shows a complex right lower pole renal mass with enhancing smooth muscle/vessel (red circle and arrow) and fat attenuation (yellow circle and arrow). Additional ROIs performed as internal reference for enhancement (blue circle and arrow; renal parenchyma) and fat (pink circle and arrow; adjacent soft tissue fat). (b) DECT spectral HU plot also shows that the lesion has enhancing components (red curve) that mirror enhancing renal parenchyma (blue curve), as well as fat components (yellow curve) that closely mimic retroperitoneal fat (rose curve). (c) Histogram analysis verifies that fat components of the lesion (yellow bars) are in the range of retroperitoneal fat (pink bars) (i.e., negative HU values)
Fig. 20.6
Renal cyst and cancer. (a) DECT 70 keV monochromatic image shows two right renal lesions with 24 HU (green arrow) and 97 HU (red arrow) values. (b) Iodine material density image, with color overlay depicting iodine-containing pixels in brown to gold hues, shows that the posterior lesion (red arrow) contains iodine and is therefore an enhancing mass (i.e., histologically proven renal cell cancer). The more anterior lesion (green arrow) does not contain iodine (i.e., avascular), and thus its >20 HU value in part (a) is related to pseudoenhancement artifact
DECT may also be useful in evaluating urothelial tumors in single-phase examinations. Twelve of fourteen pathologically proven tumors were detected with a CT urography protocol that included an all-in-one approach [71]. The single-phase examination provided synchronous nephrographic and excretory-phase images with administration of 600 mL water orally, 2 boluses (split bolus) of IV contrast material separated by a 7-min delay and scanning at 110 s after the second bolus. Although the superiority of the split bolus protocol has been previously demonstrated [72], Avanti et al. were the first to combine this technique with single-phase DECT urography, which provided a radiation dose savings of up to 45 % by performing the examination in a single acquisition. This approach was quite sensitive, but failed to detect small lesions (<5 mm) in the urinary bladder. Overall, Ascenti et al. showed sensitivity, specificity, positive predictive value, and negative predictive value in detecting urothelial tumors of 85.7, 98.6, 92.3, and 97.1 %, respectively [71].
20.5 Adrenal Glands
An adrenal nodule is incidentally encountered on 4 % of SECT examinations [73]. Regrettably, when an initial SECT study reveals an indeterminate adrenal lesion, characterization often necessitates another examination, such as adrenal protocol CT or MR imaging. In many cases, nonenhanced or single enhanced-phase DECT could answer the clinical query: adenoma or nonadenoma.
Parameters to differentiate adenoma (or other benign lesion) from metastasis are well documented for SECT [15, 74, 75]. When a lesion has HU ≤10 on conventional unenhanced SECT images, it is consistent with a benign lipid rich adenoma (71 % sensitivity; 98 % specificity [76]. Analogously, with the same HU ≤10 threshold value used with dsDECT VNC images constructed from a single portal venous phase, adrenal lesions of any size can be characterized with 79 % sensitivity, 95 % specificity, and 86 % accuracy) [73]. Furthermore, for adrenal lesions ≥1 cm diameter, single enhanced-phase dsDECT facilitates correct classification 91–95 % of the time compared with true unenhanced images as the reference standard [73]. In a study by Ho et al. [77], no malignant adrenal nodule was misclassified on VNC images.
Investigations have also been performed to evaluate differential low vs. high-energy attenuation to distinguish adrenal lesions, but DECT results have been mixed [15, 78]. Although some adenomas have lower attenuation values at 80 kVp than at 140 kVp, this pattern is not uniformly observed; therefore, the technique is specific but not sensitive. It has been postulated that the variability in attenuation may relate to different quantities of intracellular lipid.
Furthermore, Gupta et al. [78] described novel ways to identify lipid-containing adrenal adenomas. One method evaluated the mean change in attenuation of an adrenal lesion between acquisition energies at 140 and 80 kVp. Despite overlap in the attenuation change for adenomas and metastatic lesions, the change for adenomas at 0.4 ± 7.1 HU was smaller than that for metastatic lesions, at 9.2 ± 4.3 HU. Another method involved identifying a decrease in the density of an adrenal lesion from 140 to 80 kVp as an indicator of lipid, because it mimicked subcutaneous fat behavior at these two energies. This method obtained 100 % sensitivity and 100 % positive predictive value but only 50 % sensitivity, which indicates that it should be applied as an adjunct to noncontrast evaluation at 140 kVp. Specifically, if a nodule had attenuation >10 HU at 140 kVp, then the attenuation of the nodule should also be assessed at 80 kVp to try to characterize it with the data in hand. Again, no malignant nodule was misclassified, with all such lesions increasing in CT number from lower to higher energy.
20.6 Pancreas
Pancreatic adenocarcinoma is the fourth leading cause of cancer-related mortality in the United States [79], with dismal 5-year survival rates of 1.8–23 %, depending on the extent of disease [80]. Newer chemotherapy regimens are improving these statistics and increasing the necessity for follow-up imaging to monitor treatment response.
Pancreatic adenocarcinoma can appear extremely subtle on CT, but it is typically hypodense at contrast-emhanced pancreatic parenchymal phase images due to fibrosis and desmoplasia [66]. For optimal detection of this subtle neoplasm, 2-phase enhanced SECT (e.g., pancreatic about 40 s; portal venous about 70 s) is generally performed. However, up to 10 % of these neoplasms remain isoattenuating to normal surrounding parenchyma, even during the pancreatic phase when the parenchyma has the greatest enhancement [15, 66, 81–84, 86]. Thus, to facilitate diagnosis, current investigations focus on making pancreatic neoplasms more noticeable on imaging.
In a recent pilot study, dsDECT was used to investigate whether it increased the conspicuity of pancreatic adenocarcinoma [84]. Significant attenuation differences improved the distinction between tumor and normal parenchyma at 80 kVp than at blended 80/120 kVp images, because inherent contrast between tissues is more evident at lower acquisition energies due to differences in the presence of iodine [85]. Using ssDECT to exploit greater iodine contrast resolution on images at low keV provides superior divergence in attenuation of pancreatic lesions than normal parenchymal tissue [12]. These so-called computed monochromatic display images can increase conspicuity of solid organ parenchymal masses (Fig. 20.3), including hypodense pancreatic masses, despite the attendant increase in noise at lower energy.
Enhancing pancreatic parenchyma can be discriminated from acute hemorrhage on DECT water basis pair (virtual unenhanced) display because only the hemorrhage remains hyperdense [10], obviating the need for an additional unenhanced acquisition. Furthermore, this technique is useful for evaluating the extent of hypervascular tumors, such as neuroendocrine or renal cell carcinoma metastases. Iodine basis pair (iodine map) images from ssDECT can help accentuate hypovascular (adenocarcinoma) and hypervascular (islet cell) masses, whereas effective-z images can better delineate their heterogeneity (Fig. 20.7).
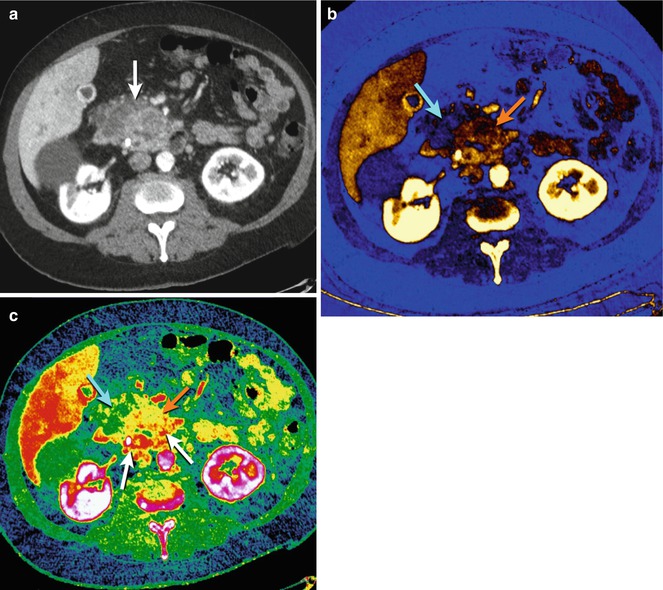
Fig. 20.7
Pancreas ductal adenocarcinoma. (a) DECT 70 keV monochromatic axial image shows heterogeneous enlargement of the pancreatic head (white arrow) due to an underlying carcinoma. (b) DECT iodine basis pair image with color overlay allows for evaluation of tumor perfusion, better differentiating more vascular areas (orange arrow) from necrotic areas (blue arrow) than would conventional CT. (c) DECT effective-z image with color overlay, based on the underlying material’s atomic number, gives new insight into the considerable heterogeneity of these tumors (blue arrow, orange arrow, and red arrows)
On SECT, tumor viability (i.e., vascularity) can be inferred by measuring the attenuation of the mass. Yet, these attenuation measurements can be inaccurate due to pseudoenhancement artifact, and they can be confounded by various materials such as high-density blood products, protein, or calcification [87]. With accurate assessment of tumor viability essential for guiding therapy, particularly with newer targeted chemotherapeutic agents, 18FDG-PET CT is increasingly being used to assess the metabolic activity of pancreatic cancer [88, 89].
However, 18FDG-PET CT is an expensive imaging study, complicated by longer acquisition times, misregistration issues, and relatively less spatial resolution. DECT is therefore an attractive alternative imaging option, because it is fast and relatively inexpensive. DECT acquisition time is <1 min, whereas 18FDG-PET CT can require up to 120 min, with the cost differential between the two examinations up to two to five times greater for 18FDG-PET CT. A preliminary study retrospectively correlating PET standardized uptake value (SUV) with SECT and DECT imaging biomarkers for pancreatic cancer showed by multivariate analysis that DECT had up to 99.9 % correlation (R 2) [90]. In addition, the DECT model appeared to be preferable because of its applicability for predicting future correlation with PET SUV (96 % vs. 64 %) [R 2 predicted], respectively). Thus, it may be feasible for DECT to supplant or become an adjuvant to 18FDG-PET CT.
A not-infrequent pitfall for CT imaging of pancreatic pathology is fatty change, which can be diffuse or focal. Focal cases may be misinterpreted as ductal adenocarcinoma at SECT, compelling follow-up imaging for further characterization, such as chemical shift MR [10]. Hence, ssDECT water basis pair (virtual unenhanced) display may resolve the issue. The area in question would not be isodense to solid pancreatic parenchyma as expected with solid malignancy but would have similar density to adjacent fat.
20.7 Bowel
CT enterography is progressively replacing traditional small-bowel follow-through fluoroscopic examinations because of its robust image quality and performance. When optimally performed using neutral oral contrast to distend the small bowel along with rapid IV contrast bolus, CT enterography has been shown to be more sensitive than capsule endoscopy for detection of small-bowel masses [85, 91–93]. However, a potential limitation of CTE is the detection of hypoenhancing and nonenhancing masses, which can be better visualized as a filling defect with positive intraluminal oral contrast. Disappointingly, positive luminal contrast can obscure hyperenhancing polyps and bowel mucosa. In this regard, IV contrast-enhanced DECT enterography with oral bismuth contrast may have promise for concurrent detection of hyperenhancing, hypoenhancing, and nonenhancing small-bowel polyps [91] (Fig. 20.8).
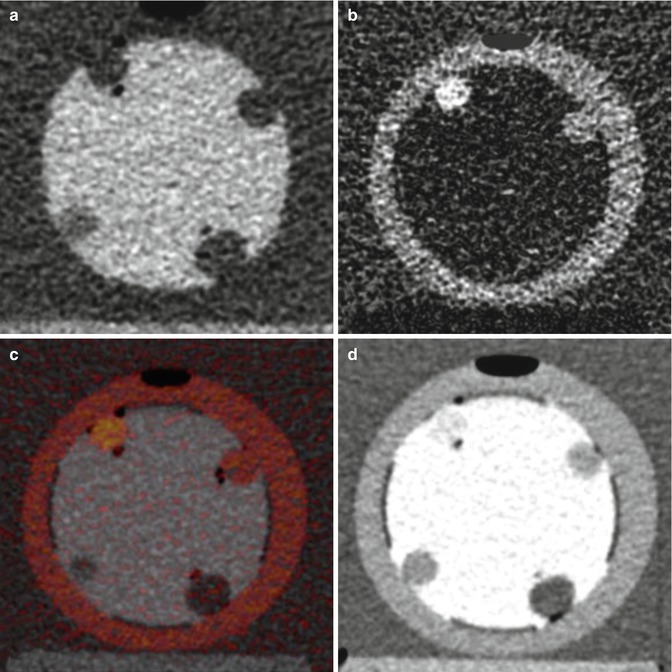
Fig. 20.8
Four different display techniques. (a) Bismuth-only image with iodine subtraction showing bowel lumen; (b) iodine-only image with bismuth subtraction showing bowel wall; (c) iodine-overlay image with color overlay of iodine signal superimposed on iodine image; and (d) mixed-kilovoltage image with a 0.5-linear blend of low-kilovoltage and high-kilovoltage images showing routine CT appearance, with both positive enteric contrast and iodine-containing bowel wall and polyps. The “polyps” are latex balloons filled with 6-mg/mL iodine (upper left), 3-mg/mL iodine (upper right), water (bottom right), and tissue equivalent material ball (bottom left) (Reprinted with permission from Qu et al. [91])
CT colonography is a noninvasive, effective option for colorectal cancer screening [94]. A standard protocol requires complete bowel cleansing and fecal/fluid tagging (oral iodinated contrast) before the examination, which is acquired with the patient in supine and prone positions. In a preliminary study with IV contrast enhancement, water (VNC) and iodine basis pair images were obtained to differentiate enhancing polyps from stool [95, 96]. The results suggested that DECT colonography may be technically feasible in a single acquisition, obviating the need for prone images [96], with resultant decreased radiation dose. Furthermore, noncathartic or reduced-catharsis DECT colonoscopy may be possible. Following fecal tagging, electronic “spectral cleansing” is performed by post-processing software to remove iodine-containing material, including tagged residual fecal material [97].
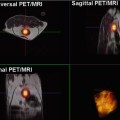
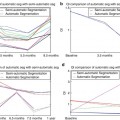
20.8 Tumor Treatment Response
In this new era of targeted therapeutic agents, accurate response assessment remains challenging with conventional imaging and current response evaluation criteria in solid tumors (RECIST) (Fig. 20.9) [98
 New Therapies and Functional-Molecular Imaging
 Overview of Functional MR, CT, and US Imaging Techniques in Clinical Use
 MRI Hypoxia Measurements
 Spectroscopy of Cancer
 Current Clinical Imaging of Hypoxia with PET and Future Perspectives
 Medical Image Computing for Oncology: Review and Clinical Examples


Related posts:
New Therapies and Functional-Molecular Imaging
Overview of Functional MR, CT, and US Imaging Techniques in Clinical Use
MRI Hypoxia Measurements
Spectroscopy of Cancer
Current Clinical Imaging of Hypoxia with PET and Future Perspectives
Medical Image Computing for Oncology: Review and Clinical Examples
Stay updated, free articles. Join our Telegram channel
Full access? Get Clinical Tree
