Fig. 11.1
Schematic pathways of hypoxia-inducible factor-1 (HIF-1). HIF-1α is under normoxic conditions enzymatically hydroxylated enabling the tumor suppressor von Hippel-Lindau (VHL) to bind. This leads to the ubiquitination and proteasomal degradation of HIF-1α. If the cell, however, turns hypoxic, HIF-1α is no longer hydroxylated. VHL cannot interact with the HIF-1α increasing the half-life of the molecule. HIF-1α can enter the nucleus and as heterodimer with HIF-1β bind to hypoxia-responsive element (HRE) domains on the DNA resulting in the transcription of more than 100 target genes involved among others in angiogenesis, glucose metabolism, metastasis, and pro-survival pathways
Studies using oxygen microelectrodes, several different MRI and electron paramagnetic resonance (EPR) approaches, and detection of exogenous (e.g., misonidazole, 2-(2-nitro-1H-imidazol-1-yl)-N-(2,2,3,3,3-[18F]pentafluoropropyl)-acetamide(EF5), or pimonidazole) or endogenous [e.g., HIF-1, CAIX, GLUT-1] molecular markers of cellular hypoxia with immunohistochemical or noninvasive imaging techniques all show that hypoxia is a common feature of tumors in patients presenting for therapy, as well as in animal tumors.
As hypoxia is associated with radiation- and chemoresistance (especially if the tumor areas include tumor-initiating stem cells), it does need not only to be detected in tumors but ideally also to be quantified with the help of predictive biomarkers [4]. Several invasive and noninvasive methods for measuring hypoxia are already established or in development – each with its own advantages and limitations. The question which technique is superior for a clinical or experimental setting depends on the available applications, on the degree of invasiveness, and the resolution required. So far the “gold standard” is intratumoral polarographic measurement of O2 partial pressures which is not appropriate for monitoring the development within the tumor mass during treatment due to its invasiveness. Furthermore, this technique is limited in its application because only random measurements at some sites within a tumor can be performed. Minimally invasive tools such as serum-based diagnostics and global gene signatures are under investigation [4]. Additionally, also the blood oxygen level-dependent (BOLD) effect can be measured via MRI noninvasively as well using paramagnetic deoxyhemoglobin and diamagnetic oxyhemoglobin as an endogenous hypoxia marker (Chap. 12). Hence, this method depends on the perfusion of tumor tissue with red cells, a prerequisite which is not always fulfilled [7]. Next to magnetic resonance imaging (MRI), especially PET imaging has emerged as a promising noninvasive tool to detect and monitor tumor oxygenation. Deeper insights into anatomical and biological information about the tumor might be revealed using PET/CT after applying sensitizer adducts which on top allows to more precisely estimate the location of the hypoxic areas and the quantification of hypoxia levels [40].
11.2 PET Tracers Used in Hypoxia Imaging
The imaging of hypoxia with PET has several advantages as the measurements allow a repeated noninvasive whole tumor assessment in vivo. This is one of the major advantages as an estimation of the temporal and spatial distribution of hypoxia can be monitored in the course of a treatment [41]. Nevertheless, hypoxia tracers have to meet several characteristics: they have to be retained specifically in hypoxic cells via an oxygen-specific mechanism with a fast blood clearance to reach appropriate concentrations even in perfusion-limited regions and to generate low concentrations of nonspecific metabolites. Furthermore, hypoxia tracers should allow a repeatable, simple, nontoxic, and fast assessment of local oxygen levels with a high spatial resolution. Another objective in measuring tumor hypoxia via PET is to ensure the reproducibility of the tracer distribution and thresholding irrespective of the operator interpreting the data. The tracers which are currently in use give promising results but do not fulfill all of these requirements [42] which is the reason for the ongoing development of novel tracers with improved imaging properties.
Most of the different hypoxia tracers for PET imaging used so far are bioreductive molecules which will be described in the following sections. Among these, the halogenated PET nitroimidazole agents labeled with F-18 and I-124 have a quite long history, whereas Cu-diacetyl-bis(N4-methylthiosemicarbazone) (Cu-ATSM) has only recently been proposed for PET imaging [43].
The major caveat of using PET imaging for hypoxia is that it is usually only a loco- or even microregional effect with patches of cells dispersed throughout the tumor. As the resolution of PET scanners is limited due to the physical characteristics of the used radionuclides and the varying spatial resolutions of 2–4 mm that can be achieved by standard clinical scanners, the exact level of hypoxia and its distribution are difficult to locate and quantify so far. In consequence, partial volumes are averaged, giving rise to statistical uncertainties. Hence, the suboptimal signal-to-noise ratio is a concern for the clinical use. These limitations might at least partially be overcome by dynamic imaging employing a kinetic modeling approach (Fig. 11.2). In contrast to single-time-point PET images, dynamic hypoxia PET can distinguish between tumor hypoxia and circulating radiotracer [44]. Dynamic scans, however, are expensive, complex to analyze, and cause inconvenience to patients [45].
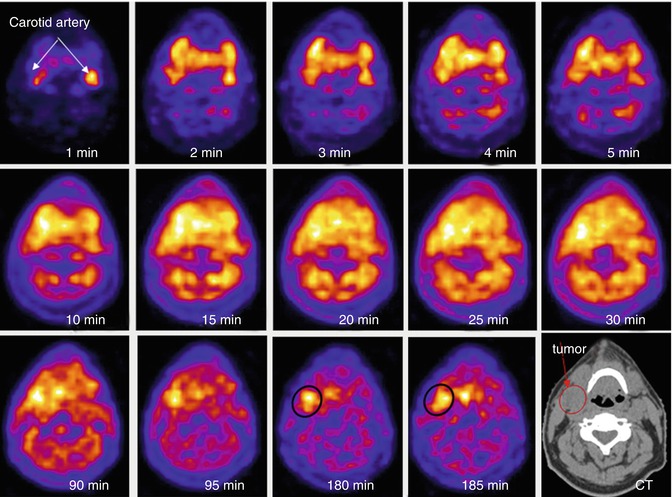
Fig. 11.2
Optimized characterization of tracer uptake in tumors applying dynamic PET scans. Compared to static PET scans allowing the assessment of standardized uptake values, dynamic scans can provide additional data about the movement and rate of uptake of the applied PET tracer allowing for a more complete diagnosis. After injection of [18F]FMISO in a patient with HNC, the dynamic PET scan was applied as a function of time: the first five images taken were of 1 min duration and then 5 frames with 5 min duration followed. The patient was reimaged at 90 min and 180 min after injection. The distribution of [18F]FMISO can be tracked from the initial blood pool to the specific accumulation within the tumors. The images were co-registered with low-dose CT scan (last image) Reprinted with kind permission of SNMMI from: Carlin and Humm [44])
11.2.1 [18F]Fluorodeoxyglucose
[18F]Fluorodeoxyglucose ([18F]FDG) is the most commonly used PET tracer in clinical routine for oncologic imaging as it allows a sensitive but unspecific detection of many tumors. In hypoxic cells, the mitochondrial ATP synthesis drops; the cells stimulate the Pasteur effect. Furthermore, HIF-1 stimulates the expression of GLUT-1 transporting FDG into the cells [46]. However, the Warburg epigenetic phenotype in normoxic tumor cells leads to a higher uptake of FDG in cells decreasing the possibility to detect hypoxia in malignant tissues. Furthermore, several preclinical and clinical studies could show that there is no or only a weak correlation between uptake of hypoxia tracers and retention of FDG [47–53]. According to the studies undertaken so far, the use of [18F]FDG as biomarker for hypoxia remains questionable. Therefore, a number of hypoxia-specific PET tracers have been developed.
11.2.2 Nitroimidazole-Based PET Radiotracers
In the 1970s, nitroimidazoles were discovered as clinical radiosensitizers and first proposed as reducible hypoxia markers in 1979 by Chapman [54, 55]. These molecules mimic the effects of oxygen leading to the sensitization of hypoxic cells to radiation. Nevertheless, if high concentrations of nitroimidazoles were applied which could restore the sensitivity of cells, toxic effects could be observed [56]. For PET imaging very low amounts of the tracers are applied (<15 μg) which do not result in any pharmacologic side effects. One major advantage of nitroimidazoles is that they are less than 5 % protein bound and are therefore distributed efficiently throughout the body even if the blood flow is reduced [57, 58]. On top, they can be applied in immunohistochemistry as well as in PET applications allowing for variable detection techniques of hypoxic tissues, e.g., prior to and after a resection of the tumor.
Nitroimidazoles consist of an imidazole ring with a nitro group at the 2′ position and an additional side chain with different residues at the 1′ position which alters the pharmacokinetic properties of the individual molecules (Fig. 11.3, Table 11.1). In vivo, the NO2 group can be reduced to NH2 if it undergoes a 6-electron intracellular modification: comparable to O2 although with less affinity, the nitro function of nitroimidazoles can accept electrons from the respiratory chain reducing it to the radical anion –NO2 − (Fig. 11.4). Cellular reductases such as xanthine oxidases with a nitroreductase activity catalyze this reaction and are assumed not to be a limiting factor in this process [59]. In the presence of oxygen, the reactive radical intermediate is reoxidized, as oxygen can accept the electrons from the nitro radical and the parent nitroimidazole can leave the cell via passive diffusion. Under hypoxic conditions, however, the nitroimidazole is further reduced. If a second electron is accepted, the nitroimidazole is irreversibly reduced to an nitroso (–N = O) group. Additional reduction steps lead to the generation of an hydroxylamine (-NHOH) functionality. This highly reactive hydroxylamine can bind covalently to thiols of macromolecules in the hypoxic cells [38, 60]. Hence, the molecule is entrapped and accumulates within the cells [7, 61, 62]. Due to the dependence of the reactions on electrons from the respiratory chain as well as on the enzymatic activity of nitroreductases, only hypoxic vital cells can be detected. The first observations of nitroimidazole retention within cell spheroids in vitro as well as in tumor models in vivo support this hypothesis [55, 63]. The rate of nitroimidazole accumulation correlates with the degree of hypoxia within the cells allowing for the distinction between normoxia and hypoxia.
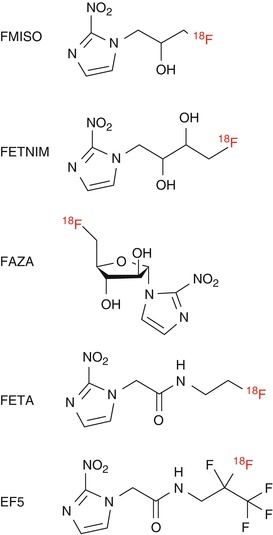
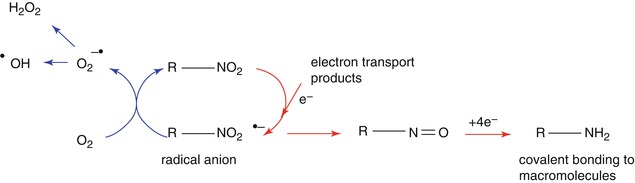
Fig. 11.3
Structure of nitroimidazole-based PET hypoxia imaging agents
Table 11.1
Partition coefficients of different nitroimidazoles. The octanol/water partition coefficient depends on the contained alkyl chain
Nitroimidazole | Alkyl chain | Partition coefficient |
|---|---|---|
FMISO | –CH2CHOCH2F | 0.44 |
FETNIM | –CH2CHOHCHOHCH2F | 0.17 |
FETA | –CH2CONHCH2CH2F | 0.16 |
EF5 | –CH2CONHCH2CF2CF3 | 5.7 |
Fig. 11.4
Mechanism of nitroimidazole retention in hypoxic cells. Nitroimidazoles are reduced by electrons to form radical anions. If oxygen is available, the anion reacts preferentially with this electron acceptor, turning the tracer in its parent state. However, if O2 is not present, the radical anion accepts another electron to produce nitroso- and hydroxylamine intermediates which are sequentially reduced to amines which are cellularly retained. The reactions taking place under normoxic conditions are presented with blue arrows, whereas hypoxic reactions are marked with red arrows
To date, several different fluorinated and iodinated nitroimidazole derivates have been developed and tested, a selection of which will be discussed here. As no systematic analysis of all 2-nitroimidazole tracers in the same tumor model or patient group has been undertaken so far, it is difficult to state which tracer is superior to the others in identifying tumor hypoxia.
11.2.2.1 [18F]Fluoromisonidazole ([18F]FMISO)
[18F]Fluoromisonidazole ([18F]FMISO) (Fig. 11.3) is the best evaluated and most widely used hypoxia tracer which can be considered as gold standard for PET imaging of hypoxia. The group around Janet Rasey at the University of Washington was the first to propose noninvasive imaging of hypoxia. They pioneered the synthesis of [18F]FMISO and demonstrated its feasibility in vivo [57, 64]. The radiosynthesis of [18F]FMISO is possible using a commercially available precursor molecule and an automated radiosynthesis protocol. 90–120 min after application, PET measurements result in the best contrast, whereas the early delivery of [18F]FMISO depends on the blood flow [42]. The tracer accumulates specifically in hypoxic tissues, and the images obtained unambiguously reflect the regional oxygen partial pressure [61, 65]. The clearance of [18F]FMISO from the blood is relatively slow and the tracer distributes via free diffusion in tissues. A reasonable tumor-to-blood cutoff value of ≥1.2 is in general used to distinguish normoxia from locoregional hypoxia, and the detection of hypoxia is only possible in viable cells due to the dependency on enzymatic pathways [66]. Even if the blood flow is reduced to one-third, hypoxia and the absence of hypoxia can be detected. The metabolization of [18F]FMISO is mainly hepatobiliary but the tracer is also in part excreted via the kidneys resulting in a radiation exposure of patients which is equal or comparable to other radiopharmaceuticals [65, 67, 68].
[18F]FMISO can diffuse freely across the blood-brain barrier as it is highly lipophilic and has no protein-binding capacity. As the signal is independent of other factors (altered glucose concentration, pH, and glutathione), [18F]FMISO harbors several advantages for imaging [69]. Furthermore, this nitroimidazole derivative is reduced at any hypoxic site and entrapped within the cells. One major disadvantage of [18F]FMISO is the low signal-to-noise ratio resulting in images of limited contrast due to the poor washout [70]. This problem can be overcome by calculating the tumor-to-blood ratio taking a venous blood sample during PET imaging.
The first studies on the uptake of [18F]FMISO were performed in vitro with multicellular spheroids. In these aggregates of cells mimicking small tumors, hypoxia could be visualized and quantitatively measured. In Chinese hamster lung V79 spheroids after 4 h of incubation with [3H]misonidazole ([3H]MISO), and [14C]MISO autoradiographs revealed a necrotic center followed by highly tracer-accumulating cells surrounded by the well-oxygenated periphery demonstrating the dependence of tracer entrapment on cell viability (Fig. 11.5) [63]. In monolayer preparations of adult rat myocytes, the relationship between the oxygen concentration and [3H]FMISO binding was studied [71]. In comparison to normoxic controls, the [3H]FMISO retention after 3 h was about 26 times higher under anoxic conditions; in hypoxic cells the uptake was increased about 15-fold. In a hepatic artery occlusion model in pigs, in vivo hypoxia-dependent [18F]FMISO entrapment was shown (Fig. 11.6) [72]. The [18F]FMISO accumulation in flow-impaired hepatic segments was about three to four times higher than in normal-flow segments. Polarographic electrode measurements confirmed the correlation between [18F]FMSIO uptake and oxygen levels within the tissues.
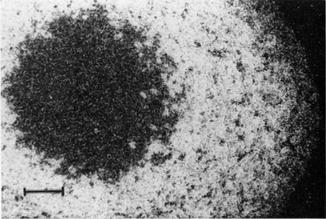
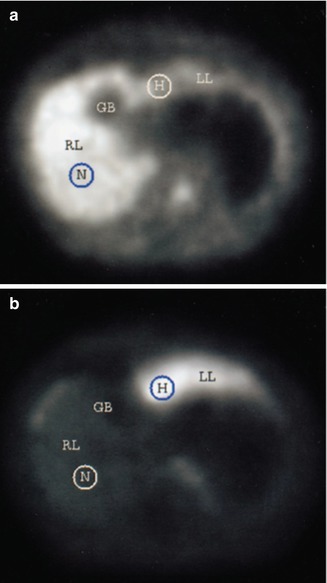
Fig. 11.5
Uptake of [14C]MISO in cellular spheroids. The cell line EMT-6/UW was grown until spheroids of 1 mm were obtained. These were incubated for 8 h with [14C]MISO and autoradiographs were taken. The uptake of [14C]MISO can be observed in a band of cells surrounding a necrotic core in the center of the spheroid. The normoxic cells in the rim of the spheroid do not accumulate the tracer (The figure was reprinted with kind permission of Radiation Research from Rasey et al. [63])
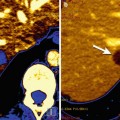
Fig. 11.6
Detection of hypoxia by [18F]FMISO. In domestic pigs liver tissue hypoxia was induced by segmental arterial hepatic occlusion. 3 h after injection of [18F]FMISO, dynamic PET scans were performed to measure the specific retention of the tracer within the hypoxic liver segments. This correlated directly to the severity of tissue hypoxia. (a) In the first minutes, [18F]FMISO displayed high activity in the normally perfused right liver lobe (perfusion), (b) while the specific retention in the hypoxic left liver lobe can be observed in later time points (165–180 min). No activity was detected in the gallbladder (GB). The circular ROIs indicate normal and hypoxic areas as measured with polarographic electrode measurements before and after PET scanning (The figure was reprinted with kind permission of Springer Science+Business Media from: Piert et al. [72])
In vivo, further preclinical studies comparing the results of polarographic measurements and [18F]FMISO accumulation have been reported. In a rat tumor model, a good correlation of both parameters could be observed [73], while in C3H mammary cancer xenografts, no correlation was found between the two methods [74]. This might be due to the fact that necrotic tissues with low oxygen levels can be identified as hypoxic using the electrode assessment but do not retain [18F]FMISO due to the lack of entrapment of the tracer. A general differentiation between mice with hypoxic and nonhypoxic tumors was possible.
The uptake of [18F]FMISO was also analyzed in comparative studies with immunohistochemical staining techniques. The exogenous hypoxia marker pimonidazole and the endogenous hypoxia marker CAIX were compared to [18F]FMISO in a rhabdomyosarcoma rat xenograft [75]. The detected hypoxic volumes were significantly correlated underlining the value of [18F]FMISO PET to detect hypoxia. Two further studies were undertaken by Troost and colleagues in several xenograft models [76, 77]. They found a correlation between [18F]FMISO PET and pimonidazole immunochemistry.
In order to analyze the regional variation in hypoxia within a single tumor which might result from differences in [18F]FMISO delivery as well as the oxygen levels in more detail in vivo, studies within one tumor were undertaken [78]. Four hours after injection of [18F]FMISO, the freely diffusible blood flow tracer C-14-iodoantipyrine – that has the same partition coefficient as [18F]FMISO – was applied to mice. The tumors were dissected into central and peripheral regions, and additional samples were taken from several healthy organs. The tumors generally exhibited a low blood flow, whereas a high blood flow was shown in lungs and kidneys. No correlation between regional flow and [18F]FMISO entrapment in individual tumors was found which was also detected for normal tissues. This effect was also observed in larger animals where a very low blood flow was independent of the [18F]FMISO retention [58].
Several clinical studies compared the correlation between measurements of partial oxygen pressures and [18F]FMISO accumulation as well. In patients with HNC, positive correlations could be found between the two methods [79, 80].
The first study showing the feasibility of [18F]FMISO was performed to detect hypoxia in three glioma patients (Fig. 11.7) [81]. Rasey and colleagues could identify hypoxic areas in a variety of tumors prior to treatment [82]. They concluded that human tumor hypoxia is widely prevalent and highly variable inter- and intraindividually.
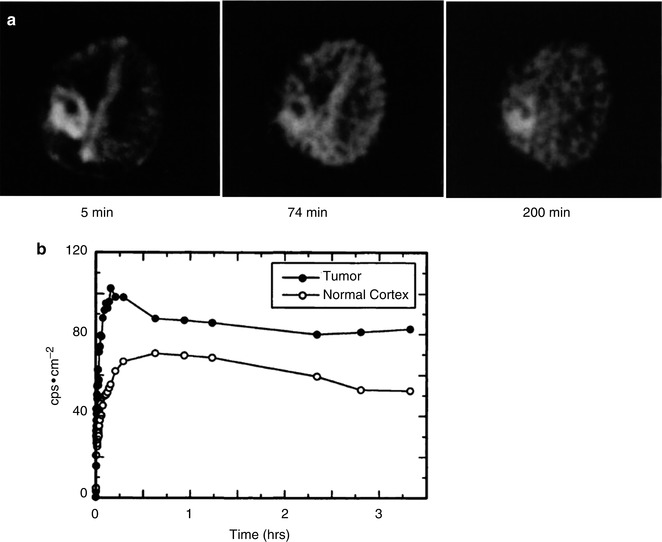
Fig. 11.7
The first clinical PET scans using [18F]FMISO in a patient with malignant glioma. (a) 5 min after injecting [18F]FMISO, a first tumor activity could be detected. At later time points the uptake in the cortex could be observed although being very slow, indicating a slow passage of tracer across the intact blood-brain barrier. Nevertheless, the activity within the lesion remains higher. (b) The time-activity curve for the tumor parallels at about 40 min the curve for the cortical region and the increases to the end of the scanning. These first studies underline the importance of [18F]FMISO for PET imaging of hypoxia (Reprinted by permission of SNMMI from: Valk et al. [81])
In clinical studies, it could be shown that the uptake of [18F]FMISO correlated with a poor prognosis for patients in HNC and glioblastoma. In patients with HNC 83 % of the tumors have hypoxic subvolumes which were in most cases distributed in single confluent areas, whereas only 22 % were diffusely dispersed [83]. For the patients with HNC, a differentiation between responders and nonresponders to radiotherapy was possible with nonresponders having a higher retention of [18F]FMISO although the tumor accumulation varied [49]. A further criterion to differentiate between the two groups was that responders had an initially lower perfusion followed by accumulation of [18F]FMISO, whereas the nonresponders showed an initial high perfusion followed by a rapid washout. In glioma patients, the volume and intensity of the detected hypoxia determined prior to radiotherapy showed a strong correlation with a shortened time to progression and overall survival (Fig. 11.8) [84]. For soft tissue tumors, however, [18F]FMISO might possibly not be the tracer of choice due to large fractions of necrotic tissue within the tumor lesions [85]. Nevertheless, further studies are required to verify this hypothesis.
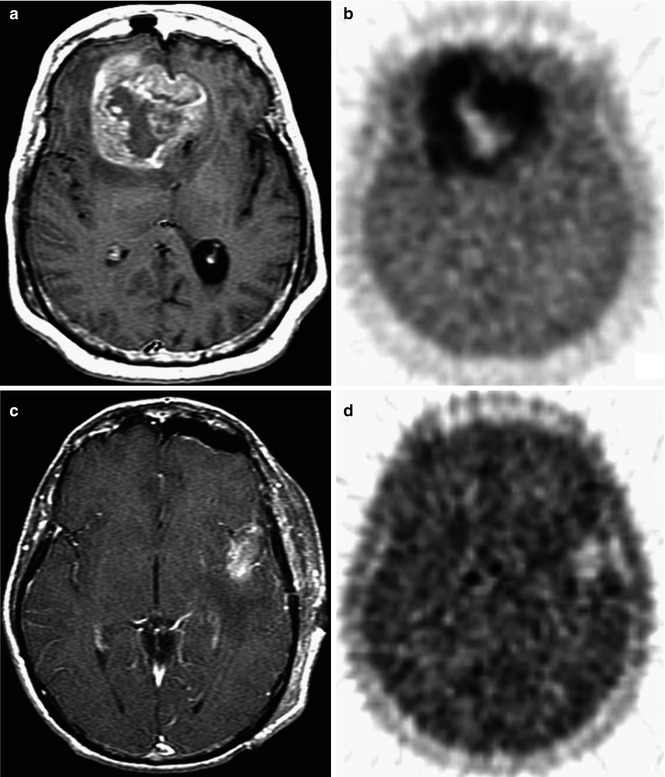
Fig. 11.8
[18F]FMISO accumulation has a predictive value. In patients with glioblastoma multiforme, the [18F]FMISO uptake was assessed 2 h p.i. using PET scans before radiotherapy. Tumor-to-blood ratios >1.2 defined the hypoxic value. The burden of hypoxic tissue within the tumor is inversely related to time to tumor progression and survival. (a, c) The MRI T1Gd images of two patients show the overall tumor size and its localization in the brain. (b, d) [18F]FMISO uptake in the hypoxic areas of the glioma. Especially in patient 1, the high uptake of [18F]FMISO can be observed as well as the necrotic center with no retention of the PET tracer (Reprinted with kind permission from AACR from Spence et al. [84])
In different settings using [18F]FMISO, intensity-modulated radiation therapy (IMRT) has been applied and could show next to interindividual differences reproducible results and the feasibility of an imaging-based planning of radiotherapy resulting in a locoregional management of tumors (Fig. 11.9) [86, 87]. Furthermore, in a first study using [18F]FMISO PET, the response to hypoxia-activated chemotherapy using tirapazamine in patients with advanced HNC could be predicted [88].
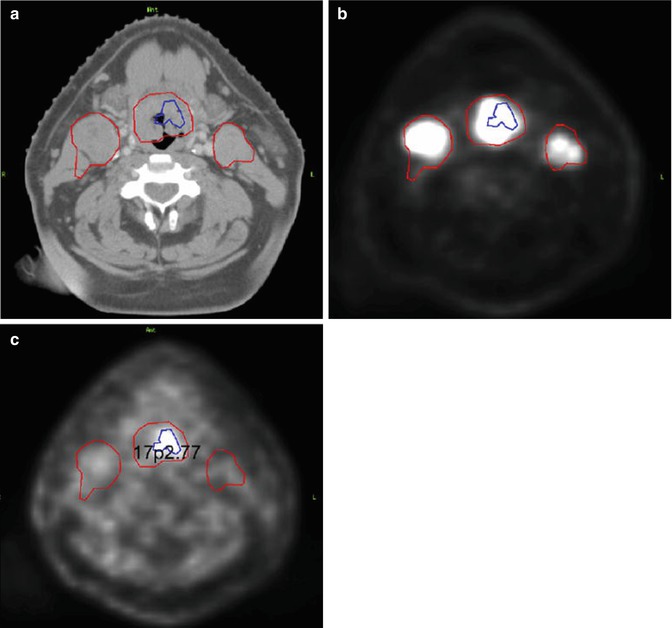
Fig. 11.9
Feasibility of [18F]FMISO PET/CT guided dose-painting IMRT. In HNC patients, the dose escalation to radioresistant hypoxic zones was aimed at while sparing the surrounding normal tissue. The gross tumor volume (GTV) was delineated and the corresponding hypoxic areas determined by [18F]FDG PET/CT and [18F]FMISO PET/CT image fusion showing (a) a CT axial slice, (b) an [18F]FDG-PET axial scan, and (c) an [18F]FMISO PET axial slice. This study underlines the importance of multiparametric analyses of tumors for optimizing treatment schemes and to enhance the locoregional control of tumors (Reprinted with permission from Elsevier from Lee et al. [86])
One preclinical study evaluated the uptake of [18F]FAZA and [18F]FDG in different cancer cell lines. Whereas [18F]FAZA showed an increased retention in hypoxic cells in comparison to normoxic cells, the entrapment of [18F]FDG was reduced which could also be shown in tumor xenografts [47]. In clinical studies, similar observations have been reported. In comparison to polarographic measurements, [18F]FDG could not differentiate hypoxic from normoxic HNC tissues, whereas [18F]FMISO uptake correlated with the partial pressure of oxygen [50, 80]. Further studies compared the retention of [18F]FMISO and [18F]FDG in patients with HNC, sarcoma, breast cancer, and NSCLC as well as glioma [48–53]. Each of these resulted in no correlation between [18F]FDG uptake and hypoxia (Fig. 11.10). Some studies, however, could show a correlation of [18F]FDG and [18F]FMISO uptake in HNC [52, 89] and brain tumors [90] which calls for further elucidation.
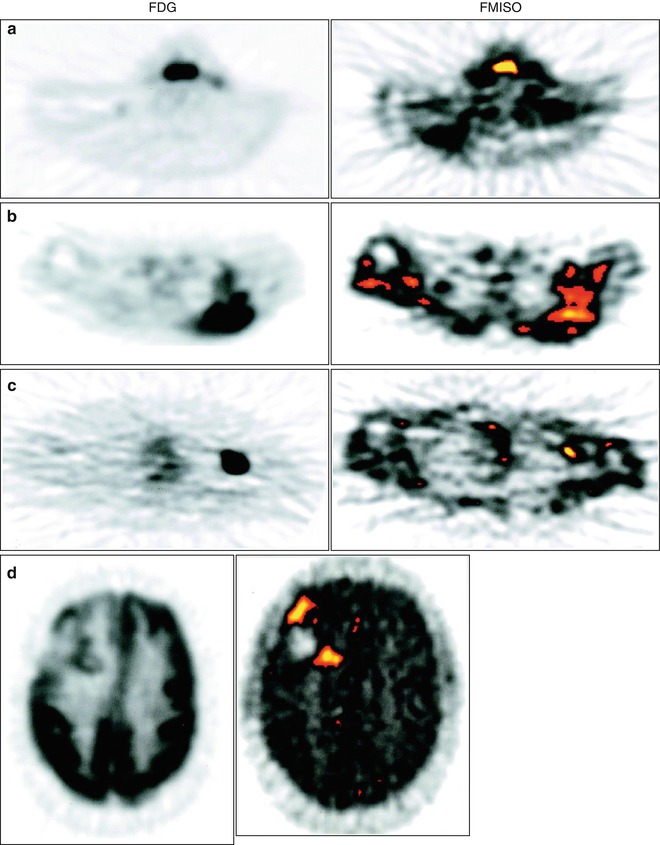
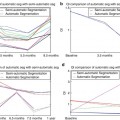
Fig. 11.10
Relationship between regional hypoxia and glucose metabolism in different tumor entities comparing [18F]FMISO and [18F]FDG uptake. Patients with different tumors ranging from those with a high prevalence of hypoxia (HNC, glioma) to those that are less frequently hypoxic (breast cancer) were analyzed for the accumulation of [18F]FMISO (right column) and [18F]FDG (left column) via PET scans. Representative images for both tracers show only a minor correlation between the overall tumor maximum standardized uptake value for FDG and hypoxic volume in patients with (a) HNC, (b) liposarcoma of the left posterior shoulder, (c) axillary metastases from left breast cancer, and (d) glioma of the right frontal region. Significant differences among the different tumor types could be observed, indicating discordance between hypoxia and glucose metabolism (Reprinted with kind permission by AACR from Rajendran et al. [52])
In summary, [18F]FMISO has been validated in several different studies for various tumor types. It could be shown to result in variable but significant levels of hypoxia and to be a prognostic indicator with increasing importance [91]. However, it shows a slow accumulation in hypoxic tumors, a low tumor-to-background ratio, and a significant non-oxygen-dependent metabolism [61].
Next to [18F]FMISO several alternative nitroimidazoles have been developed and tested to optimize the pharmaco- and biokinetics in regard to a faster blood clearance, less nonspecific retention, or fewer metabolites of the PET agents. These new agents have to prove to be superior to [18F]FMISO in order to gain acceptance [65].
11.2.2.2 [18F]Fluoroerythronitroimidazole ([18F]FETNIM)
[18F]Fluoroerythronitroimidazole ([18F]FETNIM) (Fig. 11.3) was first described and evaluated by Yang et al. in 1995 [92]. In mammary tumor-bearing rats, their studies indicated that [18F]FETNIM has significantly higher tumor-to-blood and tumor-to-muscle ratios than [18F]FMISO at 4 h post injection (p.i.). The pharmacokinetic properties of [18F]FETNIM show a low peripheral metabolism and only very little defluorination. The metabolites were hypothesized to be trapped within hypoxic cells [93]. In mice implanted with CH3 mammary carcinomas, [18F]FETNIM was investigated in comparison to [18F]FMISO under different oxygenation conditions [94]. These studies revealed that [18F]FETNIM accumulation correlates with the oxygenation status in the tumors. In contrast to [18F]FMISO, however, [18F]FETNIM displayed a more favorable biodistribution with a low background signal in normoxic tissues [94]. This can be attributed to the higher hydrophilicity of [18F]FETNIM, enabling a higher tumor-to-background ratio. Clinical studies on [18F]FETNIM were performed with HNC patients in Finland, University of Turku. In these studies, it was shown that the early uptake of [18F]FETNIM was highly variable and depending on perfusion as demonstrated by [15O2]H2O PET [95]. To monitor hypoxia, the tumor-to-plasma ratio provided the best results (Fig. 11.11) [96]. Especially at high blood flows, [18F]FETNIM accumulation reflects the oxygenation status well and thus should be well suited for hypoxia imaging in tissues with high blood flow. Assessing the radiotherapy response in 21 patients with HNC, a high uptake of [18F]FETNIM was shown to be related to a poor overall survival [97] underlining the predictive value of this hypoxia tracer. Also a preliminary study for 26 patients with NSCLC and a further with 16 cervical carcinoma patients provided evidence that [18F]FETNIM PET imaging is a valuable method to estimate hypoxia within tumors and to predict the overall survival of patients [98, 99].
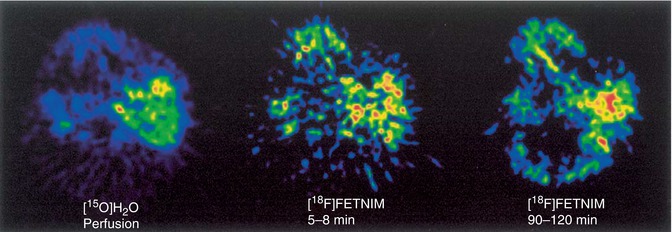
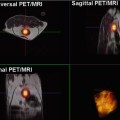
Fig. 11.11
[18F]FETNIM uptake depends on the tumor perfusion. The tumor perfusion (assessed by [15O]H2O PET scan, left) of a patient with left hypopharyngeal tumor (HNC) was compared with a dynamic PET scan of [18F]FETNIM after 5–8 min (middle) and 90–120 min (right). The different pattern of [18F]FETNIM distribution in the early and late phases of the dynamic study depends on the perfusion of the tumor: At higher blood flow, the entrapment of [18F]FETNIM reflects the oxygenation well. The tissue-to-plasma ratios reached a steady-state level at 60 min p.i. in both tumor tissue and muscle indicating that the tissue-to-plasma ratio may provide best results using only a few late time points (The figure was reprinted with kind permission by Springer Science+Business Media from Lehtiö et al. [96])
Despite the promising results of [18F]FETNIM, further studies are required to validate this PET tracer as a noninvasive imaging agent for PET imaging. Furthermore, it remains to be determined whether the use of this PET tracer presents any advantages over the use of [18F]FMISO.
11.2.2.3 [18F]Fluoroazomycin Arabinoside ([18F]FAZA)
[18F]Fluoroazomycin arabinoside [18F]FAZA (Fig. 11.3) exhibits superior pharmacokinetics compared to [18F]FMISO resulting from its reduced lipophilicity. This enables a faster clearance and hence a better contrast in imaging [100]. Additionally, [18F]FAZA can diffuse faster into cells so that this tracer is more readily available for hypoxic alteration [101, 102]. These observations are in line with a comparative study for [18F]FMISO and [18F]FAZA in mouse xenograft models where [18F]FAZA revealed better biokinetics with a higher tumor-to-muscle ratio and an oxygen-dependent uptake mechanism [103]. In contrast, a study published by Sorger et al. led to the conclusion that while [18F]FAZA indicates reduced oxygen levels comparable to [18F]FMISO in vitro, in vivo in a Walker 256 rat sarcoma model [18F]FMISO displayed a slightly higher uptake and tumor-to-muscle ratio [104]. To prove the superiority of [18F]FAZA over [18F]FMISO, more studies have to be undertaken. A further animal study with three squamous cell carcinomas and one fibrosarcoma with differing characteristics regarding vascularization, hypoxia, and necrosis compared [18F]FAZA uptake with Eppendorf electrode measurements and the hypoxia marker pimonidazole [105]. In vivo, the hypoxia selectivity of [18F]FAZA could be proven in this study as well as in a study published by Tran et al. comparing OxyLite, EPR oximetry, and [19F]MRI relaxometry [106].
Applying a chemoradiotherapy with tirapazamine – a prodrug activated to a toxic radical in hypoxic cells – the predictive value of [18F]FAZA was investigated in a breast cancer xenograft-bearing tumor mouse model [107]. A high tumor accumulation of [18F]FAZA was found to be an adverse indicator for tumor progression. Furthermore, [18F]FAZA uptake could also predict the success of chemoradiotherapy, whereby the application of tirapazamine in hypoxic tumors could efficiently improve the therapeutic effect depending on the degree of hypoxia. The authors conclude that [18F]FAZA prior to treatment might be a way to personalize tumor therapies involving radiation [107]. In these tumor-bearing mice also the reproducibility of hypoxia PET scans could be demonstrated. Therefore, pretreatment imaging is a valuable and reliable tool for treatment schemes targeting or modifying hypoxia [108].
In clinical studies, the feasibility of [18F]FAZA was determined in 11 untreated HNC patients and 14 advanced rectal cancer patients [109, 110]. The quality of images achieved was adequate and the imaging feasible. The imaging for clinical static PET was performed 2 h p.i. and the recommended threshold was 1.5. [18F]FAZA tumor uptake differed inter- and intraindividually; thus, further studies were undertaken to evaluate [18F]FAZA in clinical settings. A study including 50 patients with different tumor entities confirmed the previously obtained data of [18F]FAZA as feasible hypoxia tracer providing an adequate image quality [111]. The results of the DAHANCA (Danish Head and Neck Cancer Group) 24 trial including 50 patients revealed that in HNC patients receiving radiotherapy, [18F]FAZA PET/CT was a prognostic factor regarding disease-free survival. Significant differences could be found between patients with and without hypoxic areas within their tumors [112].
Furthermore, the role of [18F]FAZA PET imaging was analyzed in order to characterize hypoxia in the course of radiation treatment planning (Fig. 11.12) [83]. Eighteen patients with advanced squamous cell HNC were monitored, and the [18F]FAZA uptake measurements were feasible for radiation treatment planning and IMRT (Sect. 11.4).
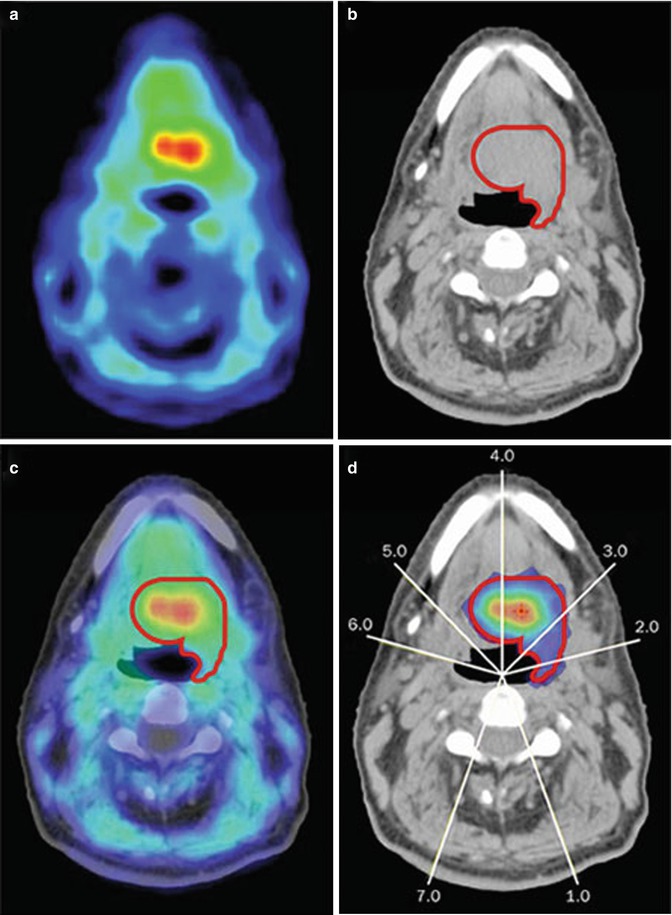
Fig. 11.12
Use of [18F]FAZA PET scans for dose painting. (a) The PET scan shows the uptake of [18F]FAZA in an HNC patient with squamous cell carcinoma indicating hypoxic areas, (b) while the CT scan can be used to determine the GTV and hence for treatment planning and dose calculation. (c) If the PET and CT scans are fused, the exact localization of the hypoxic areas within the tumor can be determined and (d) dose distribution for dose-painting IMRT can be planned. The white lines indicate the direction of the radiation treatment fields resulting in the different doses for therapy (blue: 63 Gy, red: 98 Gy) (Reprinted by permission from Macmillan Publishers Ltd: Horsman, 2012, © 2012, Nature Publishing group [45])
[124I]iodoazomycinarabinoside ([124I]IAZA) is an iodinated [18F]FAZA analogue. As iodine has a longer half-life (4.18 days) than 18F (110 min), it was suggested that imaging at later time points might reveal advantages in imaging results. However, this could not be shown [100]. Instead, a deiodination of the molecule was suggested as a significant thyroid uptake was observed.
11.2.2.4 [18F]Fluoroetanidazole ([18F]FETA)
[18F]Fluoroetanidazole ([18F]FETA) (Fig. 11.3) was first synthesized by Tewson in 1997 [113]. This nitroimidazole tracer has a decreased lipophilicity and superior biokinetics than [18F]FMISO. In vivo, it turned out to be stable to nonhypoxic degradation and showed less metabolites in blood and urine compared to [18F]FMISO. Preclinical studies with different tumor models showed that the uptake of [18F]FETA correlates with the oxygen partial pressure within the tumor and a decrease in tracer uptake after carbogen breathing [114, 115]. The clinical potential of this promising PET hypoxia tracer has so far not been analyzed.
11.2.2.5 2-(2-Nitro-1H-imidazol-1-yl)-N-(2,2,3,3,3-[18F]pentafluoropropyl)-acetamide ([18F]EF5)
Next to the mono-fluorinated 2-nitroimidazoles also fluoroalkylacetamide derivatives which are more highly fluorinated have been developed and named as EF1 [116], EF3 [117], and EF5 [118]. Among these, 2-(2-nitro-1H-imidazol-1-yl)-N-(2,2,3,3,3-[18F]pentafluoropropyl)-acetamide (EF5) (Fig. 11.3) was originally developed as an agent for biopsy stainings and has only recently been introduced as PET tracer to monitor hypoxia. The biological half-life of this molecule is improved because of its enhanced lipophilicity [119]. So far, EF5 is the most stable 2-nitroimidazole reported [43]. The major limitation of this promising agent is the more complex labeling chemistry based on electrophilic fluorination that hampers its availability in comparison to the nucleophilic displacement reactions used in the radiosynthesis of the mono-fluorinated 2-nitroimidazoles [120].
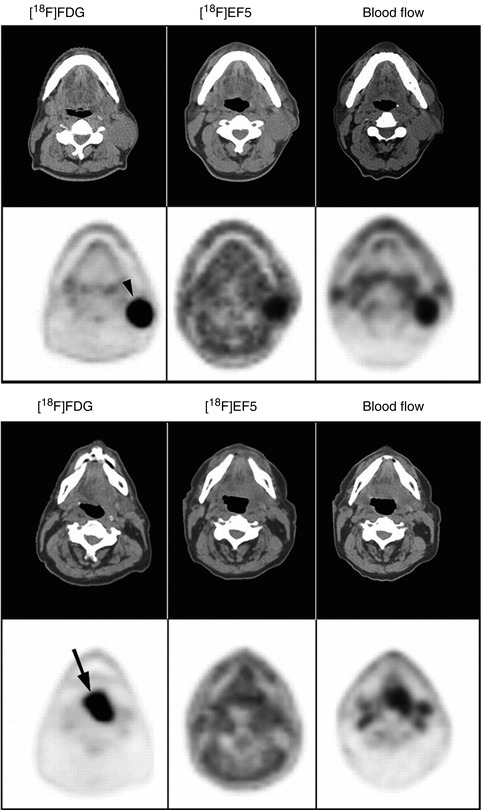
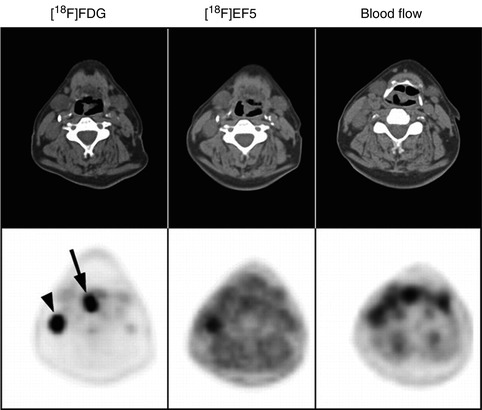
The first human trial was performed on 15 HNC patients whereby the feasibility of [18F]EF5 could be demonstrated. In a time course analysis, Komar et al. demonstrated a blood-flow-dependent initial distribution which showed to be hypoxia-specific at later time points. The best results were found performing the PET scan 3 h p.i. with a tumor-to-muscle cutoff value of 1.5 (Fig. 11.13) [121]. Additionally, [18F]EF5 reveals a predictive value as an increased tumor uptake correlates with higher grade tumors and a high prevalence of metastasis formation [122, 123].
Get Clinical Tree app for offline access
Fig. 11.13
Comparison of PET/CT scans for [18F]EF5, [18F]FDG, and [15O]H2O. In three squamous cell HNC patients, the three tracers [18F]EF5, [18F]FDG, and [15O]H2
 New Therapies and Functional-Molecular Imaging
 Overview of Functional MR, CT, and US Imaging Techniques in Clinical Use
 MRI Hypoxia Measurements
 Spectroscopy of Cancer
 Dual-Energy and Spectral Energy Computed Tomography: Oncological Body Applications in Clinical Use
 Medical Image Computing for Oncology: Review and Clinical Examples


Related posts:
New Therapies and Functional-Molecular Imaging
Overview of Functional MR, CT, and US Imaging Techniques in Clinical Use
MRI Hypoxia Measurements
Spectroscopy of Cancer
Dual-Energy and Spectral Energy Computed Tomography: Oncological Body Applications in Clinical Use
Medical Image Computing for Oncology: Review and Clinical Examples
Stay updated, free articles. Join our Telegram channel
Full access? Get Clinical Tree
