Fig. 12.1
Acute chest pain initial testing algorithm based upon pre-test probability of CAD
Several studies have been published over the past 40 years correlating stress testing to ICA. The various modalities, their overall diagnostic accuracies are summarized in Table 12.1. In general, the more sensitive the test the more likely one is able to detect the outcome in question. Most of the validation studies for stress testing from the past 40 years have used angiographic stenosis of 50 or 70 % as the ‘gold standard’ for significance. Thus, if a stress echocardiogram showed a wall motion abnormality in the inferior wall, and the ICA demonstrated a 50 % or greater stenosis in the right coronary, then this was a correlative study. By this reasoning, a test with 80 % sensitivity is ‘right’ 80 % of the time when there was a 50 % or greater lesion in the coronary tree in the correct anatomic distribution. The specificity of the test relates to the number of times the test was negative in the absence of disease. It is calculated as the number of true negative results (normal stress echo, and stenosis by ICA <50 %), divided by the true negatives added to the total number of false positive results (positive stress echo, coupled with a stenosis by ICA <50 % in that distribution). This calculated value is adversely affected when evaluating patients on a per–segment assessment, as opposed to a per-patient assessment. On a per-segment assessment, the specificity will always be higher, as the patient is unlikely to have wall motion abnormalities in the majority of segments which are angiographically normal. Reporting the per-segment specificity is a method of increasing the total number of true negatives and thus raising the specificity. Thus, in the reporting, it is common to report a per-segment as well as a per-patient sensitivity and specificity. The per-patient assessment will be more generalizable when utilizing the test among many patients.
Table 12.1
Sensitivity, specificity, positive and negative predictive values, and diagnostic accuracy of various non-invasive cardiac diagnostic testing procedures for the detection of significant coronary artery disease (ICA at least 50 % stenosis)
Diagnostic test | Sensitivity (%) | Specificity (%) | PPV (%) | NPV (%) | DA (%) |
|---|---|---|---|---|---|
Exercise stress (GXT) | 67 | 72 | 71 | 69 | 70 |
Exercise echocardiography | 88 | 74 | 77 | 86 | 81 |
Dobutamine stress echocardiography | 81 | 80 | 80 | 81 | 81 |
SPECT MPI (exercise) | 82 | 80 | 80 | 82 | 81 |
SPECT MPI (dipyridamole) | 61 | 90 | 85 | 69 | 75 |
SPECT MPI (adenosine) | 83 | 87 | 86 | 84 | 85 |
PET perfusion MPI | 93 | 81 | 83 | 92 | 87 |
Coronary CTA (64-slice) | 98 | 91 | 92 | 98 | 95 |
Coronary CT Perfusion (CTP) | 91 | 74 | 83 | 85 | 83 |
Coronary CT FFR (FFRCT) | 85 | 79 | 63 | 92 | 80 |
Stress perfusion MRI | 87 | 85 | 85 | 86 | 86 |
In this patient’s case, there is concomitant dyspnea and exam evidence of mild heart failure, thus the imaging portion of the exam also gives insight into the patient’s left ventricular systolic function adding valuable information to the clinical picture. He undergoes his exercise stress echocardiogram per your request. His ECG at baseline is normal, and he is able to perform a Bruce protocol for 7 min with significant worsening of his dyspnea during exercise, now eliciting chest pain and significant 2–3 mm of ST depression in multiple leads on ECG (Fig. 12.2). His echocardiogram showed an EF of 60 % at rest, however this dropped to 45 % at stress with anterior wall motion abnormalities (Fig. 12.3). He was referred for cardiac catheterization.
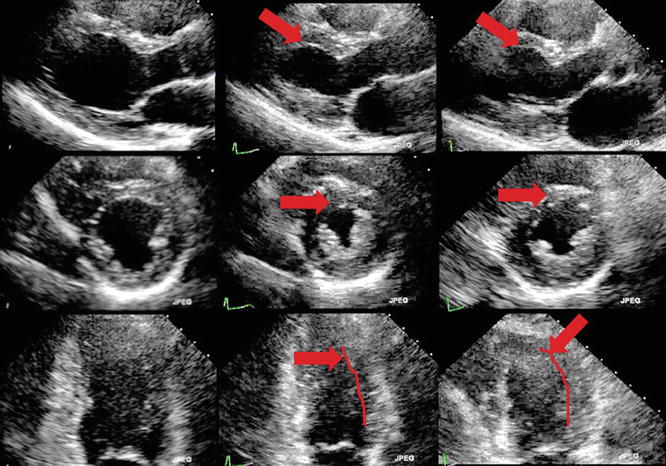
Fig. 12.2
(Top, a) Resting ECG from patient with symptoms of dyspnea on exertion. Mild ECG changes at baseline in inferior ST segments (bottom, b). Resulting ECG from Bruce protocol, peak stress showing ST depression of 3 mm in the infero-lateral leads. Stress ECG does not localize the site of injury
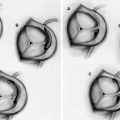
Fig. 12.3
Stress echocardiogram from patient in case 1. Resting end-diastolic frames (left), resting end-systolic frames (center) and peak stress end-systolic frames (right) of the parasternal long axis (top), mid-chamber short axis (center) and apical two chamber views (bottom). The red arrows show the anterior wall, thickening at rest and not thickening or contracting at peak stress (right). Red lines indicate area of endocardium showing mid-distal anterior wall motion abnormality
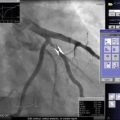
His catheterization showed a normal right system, with minimal disease throughout, however showed a significant 99 % stenosis of the mid LAD (Fig. 12.4). He underwent successful angioplasty and stent placement in the mid LAD with a drug eluting stent, and did well post procedurally.
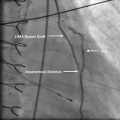
Fig. 12.4
Cardiac catheterization from patient in case 1. (Top left, a) The Left system shows a 90 % stenosis in the mid LAD, with the circumflex and RCA showing mild disease (not shown). The LAD was treated with balloon angioplasty and stenting, and the result is seen in the panel to the right (b), showing 0 % residual stenosis in the area of stenting. The vessel itself has continued disease distal to the placed stent
Stress testing performed with an imaging modality has a sensitivity of ~75–80 % and specificity on the per-patient level of ~80 % (Table 12.1). Thus it is a reasonable test to help rule in disease among patients in whom you suspect a significant atherosclerotic burden [31]. The modality chosen will depend upon numerous patient issues, including contraindications to various stress agents, and chemical tracers [7, 32, 33]. The ability to exercise should lead all patients to proceed directly with an exercise stress exam [31, 34–36], as invaluable information is gathered from the ECG portion of the examination, including the Duke treadmill score, one–minute heart rate recovery, and reproduction of symptoms with exercise, as was the case for this patient. The Duke treadmill score has been well validated to predict both morbidity and mortality in 4 year follow up [34, 35] (Table 12.2
). This patient’s Duke treadmill score was calculated as:Treadmill score = Duration of exercise (minutes) – (5xmaximal ST segment deviation) – (4x angina score
Table 12.2
Duke treadmill score and impact on long term survival
Duke score | 4 year survival (%) | Annual mortality rate |
|---|---|---|
Low (≥5) | 99 | 0.25 |
Moderate (−10 to 4) | 95 | 1.25 |
High (≤10) | 79 | 5 |
(Maximal ST depression or elevation before, during or after exercise; angina score calculated as 0=no angina, 1=non-limiting angina, 2=angina during exercise limits exercise).
Thus Mr. M’s Treadmill score is calculated at −12, which places him at ‘high risk’ for long term events (Table 12.3). He was a reasonable candidate for imaging as well given his pre-test risk and alternative diagnoses being considered; however, on the basis of his exercise test alone he would be a very reasonable candidate for percutaneous intervention without the need for concomitant imaging. His treadmill score gives him a 74 % chance of having significant three vessel CAD, or left main coronary artery disease [36, 37]. As it stands, the patient did have wall motion abnormalities on echocardiography which localized his coronary disease to the anterior wall, correlating angiographically to the 99 % stenosis found in the LAD. Of important note, ECG testing cannot localize level or extent of disease based upon the location of ST deviation [37]. Conversely, if there is diffuse ST segment depression, this is a very specific sign for severe multi-vessel disease or left main coronary artery disease [36]. Thus, this patient’s ECG at peak stress would also qualify him as having a significant burden of disease, once again obviating the need for concomitant imaging in this case.
Table 12.3
Pre-test probability of CAD based upon Diamond and Forrester criteria, and ACC/AHA guidelines
Age | Gender | Non-cardiac chest pain | Atypical chest pain | Typical chest pain |
|---|---|---|---|---|
<39 | M | Low | Intermediate | Intermediate |
F | Very low | Very low | Intermediate | |
40–49 | M | Intermediate | Intermediate | High |
F | Very low | Low | Intermediate | |
50–59 | M | Intermediate | Intermediate | High |
F | Low | Intermediate | Intermediate | |
>60 | M | Intermediate | Intermediate | High |
F | Intermediate | Intermediate | High |
Other features of the treadmill exam have valuable importance to predict overall mortality. The ‘one minute heart rate recovery’- which examines the rate of the patient’s heart rate decline after reaching peak exercise – has been studied among patients referred for exercise treadmill testing, and was found to be an independent predictor of mortality [38, 39]. When the one minute post exercise heart rate did not drop by greater than 12 beats per minute there was a two to fourfold increase in mortality at 5 year follow up. The 1 min heart rate recovery in this patient showed a drop in heart rate by ten beats per minute, a strong predictor of mortality. Mr. M was seen back in the office 2 weeks after his intervention and was doing well. His dyspnea completely resolved, and he was able to perform all of his activities of daily living without symptoms of dyspnea or chest pain, and his fatigue had also resolved.
The use of echocardiography or nuclear imaging in conjunction with stress testing can accurately localize the area of ischemia, which the ECG exam alone cannot [7, 32, 33]. This is critical information, particularly among those patients with known coronary artery disease, as it may help to guide revascularization. Take for example a patient with moderate CAD on last cath 6 years ago in the LAD and circumflex arteries, with stenosis in the 50–60 % range in both arteries who now presents with chest pain. At re-cath, the vessels continue to show 60 % stenoses. A stress examination would reveal the area of ischemia (possibly both), thus allowing for the proper revascularization avenue. This is certainly an area which has improved in recent years in the cath lab with the advent, and now widespread use, of fractional flow reserve (FFR). For more information on FFR, please see Chap. 8.
Future Use
Diagnostic testing for the presence of coronary atherosclerosis has been challenging for years, as the reference standard of luminal stenosis by invasive coronary angiography is perilous. Various studies show that the hemodynamic significance of an invasively proven 50 % stenosis varies from patient to patient and an arbitrary cut point of 70 % stenosis is more sensitive for ‘hemodynamically significant’ disease, but unfortunately makes the test less sensitive for the detection of disease. In truth, the best modality for detecting ischemic heart disease is one that employs more than visualization of the coronary lumen. Soon, we will have exciting new technologies which can combine the functional nature of a stress examination with the imaging needed to confirm disease, thus lowering the false positive rate. The best example of this is CT perfusion imaging. The first large study to document the efficacy of CT perfusion imaging was the Core 320 study [30], which showed that a protocol of stress imaging combined into a CT scan can give (1) coronary information, (2) perfusion information beyond areas of stenosis, (3) myocardial function and regional myocardial dysfunction and (4) delayed enhancement to suggest areas of infarction. This broad information is invaluable as it combines several key components into one picture. If the coronary CTA shows a 60 % stenosis, and the patient has chest pain, they are likely going to undergo a cardiac catheterization to determine the functional significance of that lesion. Fractional flow reserve testing in the cath lab has been used for just such intermediate lesions and is well validated for determining the function significance of these lesions (see Chap. 8). With the perfusion information gleaned from the CTP exam, one would know at the completion of the scan if a lesion was causing perfusion deficits by way of analyzing regional myocardial contrast uptake along with a wall motion abnormality in that area on functional testing. This added layer of information may change the way in which patients with chest pain are triaged and treated, with traditional stress testing perhaps becoming obsolete.
Case 2. Coronary Computed Tomographic Angiography: Accuracy of Disease Detection
Case Presentation
Mrs. T is a 55 year old female who presents to the emergency department for symptoms of shortness of breath and recent chest pain. She is previously known to be healthy, however has noticed progressive symptoms over the past 6–9 months of shortness of breath, fatigue and in the past 3 days has noted mild chest discomfort. She has a medical history significant for hypertension and takes chlorthalidone 25 mg daily with reasonable blood pressure control. She saw her primary care physician who obtained an ECG which was unremarkable (Fig. 12.5). She mentions she has never been hospitalized, and has never had symptoms similar to this prior to 9 months ago. Her primary care doctor worked her up for typical causes of fatigue, including a complete blood count and thyroid panel, which all returned normal.
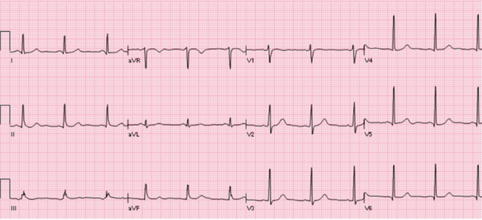
Fig. 12.5
ECG from patient in case 2. Normal sinus rhythm and normal ST segments/T waves. A resting ECG may or may not be helpful in the detection of ongoing coronary ischemia, and the evaluation must continue past a resting ECG for disease detection among patients at intermediate to high risk for CAD
In the emergency department, her blood pressure is 136/76 mmHg, her heart rate is 80 beats per minute and her body mass index is 27 kg/m2. She appears well, and in no acute distress. Her cardiac examination reveals a normal S1 and S2, with no murmurs or rubs. She has a normal carotid upstroke and normal jugular venous pressures. Her precordial examination reveals no RV heaves or lifts, and the PMI is non-displaced. She has no findings on her pulmonary examination, and she has no evidence of lower extremity swelling.
In her family history, she notes her mother had an MI at age 60, and she has two sisters in their 50s, the eldest, currently 59 with a myocardial infarction (MI) 1 year ago. Further, given her family history she underwent a coronary calcium score CT (non-contrast CT of the chest at 3 mm slice thickness) at age 50 which returned a total calcium score of 0 Agatston units. She was asymptomatic at that time.
You understand her symptoms are largely non-exertional, but are sub-sternal and are relieved with nitroglycerine. Her pain is atypical by definition, but with a calcium score of zero 5 years ago, you decide to obtain a contrast CTA for acute chest pain (see Table 12.1, Algorithm- Intermediate Risk). Mrs. T undergoes a CTA with the images shown in Fig. 12.6. She has evidence of severe disease in the left anterior descending artery. Of note, collateral blood vessels cannot usually be seen by CTA given their small diameter.
Fig. 12.6
CTA image (left, a) and corresponding ICA image (right, b) of the LAD for the patient in case 3, presenting with progressive dyspnea. The LAD shows a 99 % stenosis in the mid vessel. The patient had a calcium score of 0 5 years ago, and now there is still no calcium in the coronary tree, however significant disease in the artery
In this case, the patient had a calcium score of 0 with her presentation 5 years ago. This is not surprising, as her CTA and cardiac catheterization did not document any vessel calcification. It is established that patients with a zero calcium score have a 4-year “warranty” period for very low risk of cardiac events [11, 12]. The likely explanation for a 4 year – and not a longer – warranty is twofold: (1) the presence of non-calcified disease which cannot be accounted for by non-contrast studies alone and (2) the development of new coronary plaques not previously seen. Thus, a calcium score, while very helpful for risk stratification and detection of disease, only detects disease which is currently clinically quiescent, and scans which are older than 4 years must be considered with caution in the decision making process. Moreover, the conversion from a “Zero calcium score” state to a “positive calcium score” state is non linear, bringing into question the benefit of repeating the coronary calcium score.
CTA has a high diagnostic accuracy for the detection of ICA confirmed stenosis [14–20]. Among the testing modalities listed in Table 12.1, CTA has the highest sensitivity and negative predictive value, making it a very reliable test for both ruling in and ruling out disease among patients presenting to the ED with acute chest pain [40, 41]. The limitation of CTA is its inability to inform the physician about the hemodynamic significance of disease once that disease is discovered. Various studies have shown that the accuracy of CTA stenosis in cases of non-calcified plaque is higher than that for calcified plaque [42–45]. These calcified plaques cause a ‘blooming effect’ in the artery, making the plaque appear larger and giving the appearance of a higher degree of stenosis than is truly present. This is typically the case when viewing an image in a maximum intensity projection (MIP), as the pixels will appear the color of the highest Hounsfield units which resides within it border; a problem which can largely be overcome with multi-planar reformatting (MPR) viewing. Thus with MIP, a small amount of calcium may cause the appearance of a significant stenosis depending upon its location within the vessel. In general however, the more calcium that is present within a given plaque, the more difficult the lumen of the artery is to interpret in that area. In Fig. 12.7, separate CTA MIP examples are shown of calcified plaques which make luminal interpretation difficult. In the first case with a moderate amount of calcium, the CTA called a high degree of stenosis (>70 %) in the ostial LAD, and the invasive angiogram confirmed this. However, in the second example, with more severe calcium present, the CTA was read as having critical disease in the LAD, however the invasive angiogram showed a moderate stenosis in that area. In general, the less calcium which is present to fill pixels in the coronary wall, the less blooming will occur, and the more accurate the CTA will be for detection of coronary stenosis [42–45].
Fig. 12.7
Examples of calcified plaques seen by CTA. (Above, a, b) CTA showing a moderately calcified plaque which does not affect the ability to diagnose the severe degree of underlying stenosis. ICA done the following day confirms severe proximal/ostial LAD stenosis. (Below, c, d) CTA and corresponding ICA depicting the patient’s LAD, with CTA showing a heavily calcified LAD and critical stenosis, and ICA showing a moderate level of stenosis. As the degree of calcification increases on CTA, the ability to predict the angiographic stenosis becomes more difficult
Factors other than coronary calcium will affect the diagnostic accuracy of a CTA. In a study by Yan et al. [46], 291 patients were evaluated by CTA and quantitative coronary angiography for determination of predictors of inaccurate coronary artery segments. Not surprisingly in their study, the largest predictor of a false positive CTA was patient calcium score (OR 5.2) and segmental calcium (OR 10.2). Interestingly, the same paper discusses that the absence of calcium was also a predictor of a false negative test; saying in essence that non-calcified plaques are not infrequently present and the lack of calcium may skew the interpretation by the CTA reader into ‘missing’ non-calcified plaques. Important predictors of inaccurate coronary artery stenosis severity found by multivariate analysis were the presence of intracoronary stents (OR 4.2), segment tortuosity (OR 3.5), venous contamination (OR 3.5), and small vessel size (OR 0.48). Naturally, improved luminal contrast was found to improve overall accuracy by decreasing the false negative rate (OR 0.96). It is important to note CTA has limitations, and should only be used in select patient populations, with caution employed among cases of previously placed intracoronary stents, significant coronary calcium, significant vessel tortuosity, and/or poor scan quality and poor coronary opacification. In general, a CTA, which is interpreted by a reader who does not maintain a high volume of CTA reading, has a higher likelihood of either false positive or false negative results [47, 48].
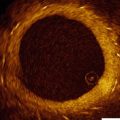
CTA has a high degree of reliability with regard to plaque and coronary lumen visualization. In a meta-analysis by Voros et al. [26], Coronary CTA had excellent diagnostic accuracy for the detection of coronary plaques using IVUS as the reference standard, with an area under the curve for receiver operating characteristic analysis of 0.94 (95 % confidence intervals [CI]: 0.92–0.96), a sensitivity of 0.90 (95 % CI: 0.83–0.94) and a specificity of 0.92 (95 % CI: 0.90–0.93). This meta-analysis confirmed that coronary CTA may slightly overestimate luminal area, presumably because of partial volume averaging effects which can lead to overestimation of the size of very bright structures (such as the contrast-enhanced lumen), whereas plaque area, volume, and area stenosis measurements are similar between CT and IVUS. Thus, when viewing a coronary CTA, luminal size and area can be used fairly accurately for stent sizing and lesion length, with the caveat that a slightly smaller lumen size may actually be present.
Case 3. Unstable Coronary Plaque Detection by CTA
Case Presentation
Mr. H is a 59 year old male with a history of hypertension and a former one pack per day smoker for 30 years who quit 10 years ago, who presents to the emergency department for symptoms of recent onset chest pain. He describes the pain as a vague, non-radiating pain in the left chest which comes and goes. He notes it is present more with exertion, but at times it has occurred without exertional symptoms, then lasting only a few minutes and stopping. He is a quiet man, with little else to offer in terms of history. He notes no previous symptoms similar to this, and has had no previous cardiac examinations.
Related posts:

Stay updated, free articles. Join our Telegram channel

Full access? Get Clinical Tree


