error in estimating model parameters.
Keywords
ElectrogramsComputational models personalizationMulti-electrode catheters1 Introduction
Computational models represent a novel framework for studying pathologies of the human atria and offer a pathway for selecting patients and personalizing treatment, [1, 2]. Of particular interest is the study of atrial fibrillation (AF), a pathology where the underpinning mechanisms triggering and maintaining the arrhythmia are not known. The use of increasingly sophisticated electro anatomical mapping systems, high fidelity imaging techniques and inverse ECG methods has significantly improved patient outcomes [3]. These improved diagnostic modalities are still only able to provide information on the current state of the patient and are unable to provide predictions of the outcome of treatments.
Biophysical modeling provides a formal framework that combines our understanding of atria physiology, physical constraints and patient measurements to make quantitative predictions of patient response to treatment. These models have provided fundamental insight into the mechanisms that underpin arrhythmia’s in the ventricle and the atria, [4] but their potential to inform clinical procedures had been limited by their inability to capture the significant variability in physiology inherent both between and within AF patients.
The aim of this study is to develop and test a robust and rapid pacing protocol and a model fitting method that allow for local characterization of cellular biophysical parameters and electrophysiology restitution within patients atria. Validation of the pacing protocol will be presented in Sect. 3. Validation of the method proposed here is purely based on synthetic data. Application to experimental data will be a topic of a future work.
2 Method
2.1 Computational Model
The first step of the method proposed is to build a data set of restitution curves for each permutation of a set of parameters known a priori. A numerical model describing the action potential propagation across the left atrium tissue is implemented. The model is then used to reproduce electrogram signals from the poles of a decapolar catheter when an ectopic pacing stimulus is applied to the central poles. The procedure for building the restitution curves is described in Sect. 2.2.
Atria tissue electrophysiology was modeled by the mono-domain equations [5], a simplification of the bi-domain model, [6] when intra- and extra-cellular conductivities are considered proportionals up to a constant,  . Due to assumed local symmetry and negligible thickness in the atrium the model was reduced to a 1D fiber model as follows:


where  is an external applied stimulus, while
  characterize the ionic currents defined by the ionic model, [7].
 . Due to assumed local symmetry and negligible thickness in the atrium the model was reduced to a 1D fiber model as follows:
(1)

(2)
 is an external applied stimulus, while
  characterize the ionic currents defined by the ionic model, [7].
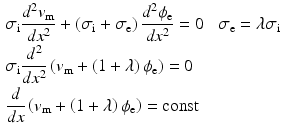
Substituting the mono-domain approximation into the extra-cellular potential equilibrium equation, and simplifying the conductivity it follows that:

where  represents the extra-cellular potential,
  the trans-membrane potential,
  the intra-cellular conductivity and
  the extra-cellular conductivity. The constant term appearing on the right-hand side of (3) is fixed by imposing a zero spatial mean on the extra-cellular potential:
 where
where  , denotes the spatial mean of the trans-membrane potential.

(3)
 represents the extra-cellular potential,
  the trans-membrane potential,
  the intra-cellular conductivity and
  the extra-cellular conductivity. The constant term appearing on the right-hand side of (3) is fixed by imposing a zero spatial mean on the extra-cellular potential:
 , denotes the spatial mean of the trans-membrane potential.
The catheter configuration and the catheter dimensions are depicted in Fig. 1; bipolar signals were evaluated as the difference of the extra-cellular potentials between a pair of electrodes spaced by a distance  .
.

 .
.
Fig. 1.
Decapolar catheter configuration and dimensions. Dimensions are expressed in  . The pacing stimulus is applied to the central poles, highlighted by the gray ellipse. Bipolar poles are determined by the pairs: (
 ,
, ), (
), ( ,
, ), (
), ( ,
, ), (
), ( ,
, ), (
), ( ,
, )
)
 . The pacing stimulus is applied to the central poles, highlighted by the gray ellipse. Bipolar poles are determined by the pairs: (
 ,
, ), (
), ( ,
, ), (
), ( ,
, ), (
), ( ,
, ), (
), ( ,
, )
)Ionic currents were described using the Mitchell Schaefer 2003 (MS), [7] ionic current model. Despite its simplicity, the MS model captures the Effective Refractory Period (ERP) and the Conduction Velocity (CV) restitutions with a minimal number of parameters. The MS model has four parameters that describe the opening ( ,
,  ) and closing (
 ,
,  ) rate of the fast activation and slow repolarization currents respectively.
 ,
,  ) and closing (
 ,
,  ) rate of the fast activation and slow repolarization currents respectively.
2.2 Pacing Protocol and Restitution Curves
Atria were paced from the central poles ( ,
, ) of the decapolar catheter depicted in Fig. 1; activations were measured at proximal and distal poles, (
 ,
, ), (
), ( ,
, ), (
), ( ,
, ), (
), ( ,
, ).
).
 ,
, ) of the decapolar catheter depicted in Fig. 1; activations were measured at proximal and distal poles, (
 ,
, ), (
), ( ,
, ), (
), ( ,
, ), (
), ( ,
, ).
).The initial (maximum) inter-beat interval was fixed at  and the minimum inter-beat interval
  , for each decrement step
  the inter-beat delay
  is defined recursively as:
 and the minimum inter-beat interval
  , for each decrement step
  the inter-beat delay
  is defined recursively as:


