on separate occasions) and 174 with normal blood pressure. Images were obtained on a 1.5T Philips Achieva system with voxel sizes of  ; slice thickness
  and 20 cardiac phases.
A region of interest (ROI) is defined by five manually placed landmarks in the ED phase of the MR image sequence. These five landmarks are carefully placed by clinicians and include two insertion points of the right ventricle, the apex point and two longitudinal LV axis points (one in the most basal slice and one in the most apical slice). Each image is then transformed by aligning the landmarks to a randomly chosen reference image using rigid registration. This spatial normalisation is performed to correct for variations in position and orientation across the subjects but to preserve variations due to size differences. The pre-processing is kept as simple as possible in order to avoid the loss of any useful information.
2.2 Manifold Learning
Manifold learning is used for dimensionality reduction: in the original, high-dimensional space each set of images  represents a data point of dimension M, where M is the number of voxels in each image. Assuming there exists a lower dimension manifold which can well represent the local geometric relationship between images, the manifold learning seeks to find a low dimensional representation
  of the input images I where
  . Laplacian Eigenmaps [2] build a sparsely connected graph from a pairwise weight matrix W computed from the data set. The connectivity between each pair of data points in the graph is defined by a similarity measure S. In our work we use the sum of squared difference (SSD) as similarity measure.
 represents a data point of dimension M, where M is the number of voxels in each image. Assuming there exists a lower dimension manifold which can well represent the local geometric relationship between images, the manifold learning seeks to find a low dimensional representation
  of the input images I where
  . Laplacian Eigenmaps [2] build a sparsely connected graph from a pairwise weight matrix W computed from the data set. The connectivity between each pair of data points in the graph is defined by a similarity measure S. In our work we use the sum of squared difference (SSD) as similarity measure.
We investigate three different ways of constructing manifold: a single manifold, a pooled manifold and an aligned manifold.
To preserve the inter-subject variation and extract anatomical information, first a low dimensional manifold is derived from a single time-point. In this work, we use the ED phase as this single time point but other choices are possible. We refer to this as single manifold.
To preserve the inter- and intra-subject variation, which captures functional and motion information in cardiac MR images, we perform the manifold learning on the cardiac MR image sequence. For this purpose, we propose two different approaches:
Pooled manifold. All time frames from the same subject are simultaneously embedded together with their ED phase images.
Aligned manifold. Previous studies revealed that for the pooled manifold important intra-subject variation can be lost in the embedding while the inter-subject variation dominates the manifold [4]. Therefore, we derive an individual manifold for each individual cardiac MR image sequences. These manifold are then aligned into the final manifold using Procrustes analysis [13].
In order to investigate that how many frames we need from the cardiac sequence to capture functional information, we derive the aligned manifold from images with different temporal resolutions. The single manifold can be seen as the manifold with a temporal resolution of one image during a cardiac cycle. We then increase the temporal resolution to two frames (the ED and ES frames) and so on. In this work, we gradually increase the temporal resolution from one frame to twenty frames per cardiac cycle and build aligned manifold for each different temporal resolution respectively.
2.3 Classification
The representation obtained through the manifold learning allows the embedding of inter- and intra-subject variation of cardiac anatomy and function into a lower dimensional space. This makes it possible to use the embedding coordinates  as the feature vector to analyze the population in terms of cardiac function. We investigate the capability of the extracted manifold coordinates by testing two classification scenarios: (a) male vs. female and (b) high blood pressure vs. normal. A support vector machine (SVM) approach [11] is used for the classification.
 as the feature vector to analyze the population in terms of cardiac function. We investigate the capability of the extracted manifold coordinates by testing two classification scenarios: (a) male vs. female and (b) high blood pressure vs. normal. A support vector machine (SVM) approach [11] is used for the classification.
3 Experiments and Results
3.1 Impact of the Parameter Setting
Selecting Value for Neighbourhood Size and Feature Dimension. The neighbourhood size (k) and feature dimension (d) are two important parameters in the Laplacian eigenmap embedding. The correct choice of these two parameters is important to obtain meaningful representations of the data. In this work, these parameters are selected empirically using an exhaustive 2D grid search.
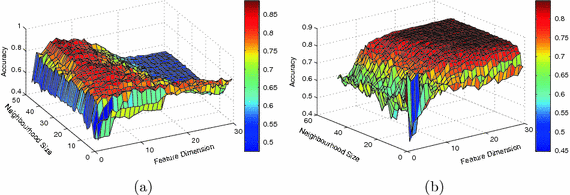
Figure 1 shows classification accuracies computed based on a single manifold within the parameter grid for classifying subjects according to gender and high vs normal blood pressure respectively. We show the average classification accuracies obtained after 100 runs of seven-fold cross-validation. As can be seen for the gender classification task, the accuracy initially increases sharply as k and d increase and reaches its peak at  . The classification accuracy decays significantly for large d. By contrast, for the blood pressure classification task, the accuracy increases steadily and remains stable for
 ![$$k>10$$” src=”/wp-content/uploads/2016/09/A339585_1_En_11_Chapter_IEq9.gif”></SPAN> and <SPAN id=IEq10 class=InlineEquation><IMG alt=]() 15$$” src=”/wp-content/uploads/2016/09/A339585_1_En_11_Chapter_IEq10.gif”>.
15$$” src=”/wp-content/uploads/2016/09/A339585_1_En_11_Chapter_IEq10.gif”>.

 . The classification accuracy decays significantly for large d. By contrast, for the blood pressure classification task, the accuracy increases steadily and remains stable for
Fig. 1.
Average classification accuracies computed based on the single manifold with the varying neighbourhood size and feature dimension for discriminating between (a) gender and (b) subject with high vs. normal blood pressure.
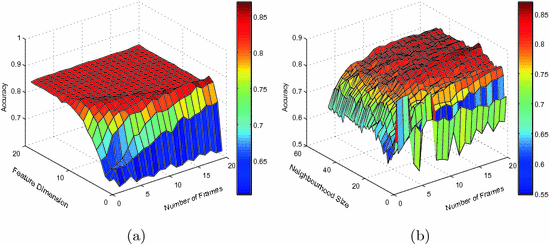
Selecting Temporal Resolution for Aligned-Manifold. In order to achieve the best classification rate and investigate the impact of neighbourhood size, feature dimension and temporal resolution for the pooled and aligned manifold, the optimal parameter settings are searched using grid search as well. The results for the classification according to blood pressure using the aligned manifold is reported in Fig. 2. 100 runs of seven-fold cross-validation are performed for each of the settings: neighbourhood size ![$$k\in \left[ 2..50\right] $$](/wp-content/uploads/2016/09/A339585_1_En_11_Chapter_IEq11.gif) , feature dimension
, feature dimension ![$$d\in \left[ 1..20\right] $$](/wp-content/uploads/2016/09/A339585_1_En_11_Chapter_IEq12.gif) and number of frames
and number of frames ![$$f\in \left[ 1..20\right] $$](/wp-content/uploads/2016/09/A339585_1_En_11_Chapter_IEq13.gif) . The search range chosen for theneighbourhood size and feature dimension are based on the results from the previous section. Clear improvements in the classification accuracy can be observed in both figures when increasing any of the parameters. Thereafter the accuracy stabilizes with the best performance obtained at
. The search range chosen for theneighbourhood size and feature dimension are based on the results from the previous section. Clear improvements in the classification accuracy can be observed in both figures when increasing any of the parameters. Thereafter the accuracy stabilizes with the best performance obtained at  .
.
![$$k\in \left[ 2..50\right] $$](/wp-content/uploads/2016/09/A339585_1_En_11_Chapter_IEq11.gif) , feature dimension
, feature dimension ![$$d\in \left[ 1..20\right] $$](/wp-content/uploads/2016/09/A339585_1_En_11_Chapter_IEq12.gif) and number of frames
and number of frames ![$$f\in \left[ 1..20\right] $$](/wp-content/uploads/2016/09/A339585_1_En_11_Chapter_IEq13.gif) . The search range chosen for theneighbourhood size and feature dimension are based on the results from the previous section. Clear improvements in the classification accuracy can be observed in both figures when increasing any of the parameters. Thereafter the accuracy stabilizes with the best performance obtained at
. The search range chosen for theneighbourhood size and feature dimension are based on the results from the previous section. Clear improvements in the classification accuracy can be observed in both figures when increasing any of the parameters. Thereafter the accuracy stabilizes with the best performance obtained at  .
.


