), the scattering coefficient ( ), the anisotropy scattering coefficient (g) and the refractive index (n). Three different wavelengths of light were considered based-on their known optical properties: green (532 nm), red (660 nm) and near infra-red (NIR, 745 nm). Specific optical properties of healthy myocardium at these wavelengths were taken from [9], being: green
  mm
mm ,
,  mm
mm ; red
; red  mm
mm ,
,  mm
mm ; NIR
; NIR  mm
mm ,
,  mm
mm . At all wavelengths,
  and
and  for myocardium was used, with
  for the surrounding medium. Optical properties of scar tissue were approximated by reducing
  and
and  by 50 % [10].
Model Setups and Protocols. A 3D wedge of myocardium was used measuring  mm. Photon packets were incident perpendicular to the
  surface in the centre of the xy-plane (at (15, 15, 0) mm). A total of
  photon packets (each with initial weight of
  ) were incident for each simulation. The specific nature of the device responsible for inputting photons (laser, LED, etc.) is not relevant to the model, so long as the photons are of the same wavelength. Those packets exiting from the initial illuminated surface (i.e. the
  plane) were detected, with total packet weight binned according to the radial distance at the point of exit (r) from the initial source of illumination, shown in Fig. 1A. Later, scar tissue was represented within the tissue as a layer parallel to the illuminating surface of varying thickness and depth beneath the surface, as shown in Fig. 1B.

 mm. Photon packets were incident perpendicular to the
  surface in the centre of the xy-plane (at (15, 15, 0) mm). A total of
  photon packets (each with initial weight of
  ) were incident for each simulation. The specific nature of the device responsible for inputting photons (laser, LED, etc.) is not relevant to the model, so long as the photons are of the same wavelength. Those packets exiting from the initial illuminated surface (i.e. the
  plane) were detected, with total packet weight binned according to the radial distance at the point of exit (r) from the initial source of illumination, shown in Fig. 1A. Later, scar tissue was represented within the tissue as a layer parallel to the illuminating surface of varying thickness and depth beneath the surface, as shown in Fig. 1B.
Fig. 1.
(A) Demonstration of the ‘banana’ effect. (B) Tissue setup including scar.
3 Results
3.1 Ability to Discern Tissue Thickness of Healthy Myocardium
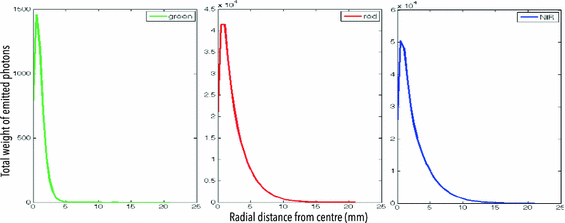
Initially, we examined how light of different wavelength, with significantly different associated optical properties, may produce different radial profiles of diffusely reflected light. Figure 2 shows radial profiles of detected photons for the three different wavelengths for healthy tissue thickness of 3 mm. After initially peaking, all profiles have a characteristic decrease in detected weight as radial distance increases. Such profiles are expected as photons exiting the tissue surface from increasingly further distances from the source have been attenuated to a greater extent. However, as the wavelength increases (from green to NIR), both the peak height is seen to noticeably increase (more total photons are detected) and the width of the profiles broadens. Specifically, peak height increases from approximately  at green to
  at NIR, with FWHM increasing from 1.5 mm at green to 2.4 mm at NIR. The increased peak height at longer wavelengths and increased profile spread is due to the decreased absorption coefficient, meaning photon packets travelling similar distances are attenuated less compared to shorter wavelengths.

 at green to
  at NIR, with FWHM increasing from 1.5 mm at green to 2.4 mm at NIR. The increased peak height at longer wavelengths and increased profile spread is due to the decreased absorption coefficient, meaning photon packets travelling similar distances are attenuated less compared to shorter wavelengths.
Fig. 2.
Profiles of total emitted photon weight versus radial distance from source for green (left), red (centre) and NIR (right) light for a tissue thickness of 3 mm (Color figure online).
We now consider how these respective radial profiles for different wavelengths may change upon changing the thickness of the tissue. Figure 3 shows that the peak heights of the radial profiles (panel A) decrease and the FWHMs (panel C) increase for all three wavelengths as the thickness of the tissue sample increases from 1–7 mm. For thin geometries, backscattering of photon packets from the lower surface increase the intensity of light that successfully exits the illuminated surface due to diffuse reflectance. At longer wavelengths, this continues to have an effect for thicker geometries, due to the relatively lower absorption coefficient compared to green light. Consequently, this decrease in peak height with tissue thickness is by far most significant in the case of the green light, but is still pronounced for red and NIR light.
Stay updated, free articles. Join our Telegram channel

Full access? Get Clinical Tree


