Fig. 1.
Pipeline of the proposed method: (a) ambient space with M input features for each subject, (b) feature-specific and global affinity matrices used as input to the MKL optimization, (c) MKL optimization (d) Output space of reduced dimensionality.
We propose to take advantage of the full myocardial velocity traces (along the whole cardiac cycle), from two stages of a stress echocardiography protocol, to determine the diagnostic features of the disease. Functional atlases [2] provide a common spatiotemporal system of coordinates where such patterns can be compared. However, their analysis is often limited to linear statistical comparisons, or to voxel-wise observations. Non-linear dimensionality reduction techniques such as graph embedding [11] have been investigated to overcome these limitations and perform pattern-wise comparisons [3]. Nonetheless, such analyses only focus on single descriptors to characterize a given population in an unsupervised way (e.g. myocardial velocity in [3]). Depending on the complexity of the disease, a single descriptor strategy may not be sufficient to accomplish a proper characterization. In the present paper, we build upon a recently proposed framework, known as multiple kernel learning (MKL), which allows to optimally fuse heterogeneous information. A supervised learning formulation of MKL was given in [8].
Our main contribution is to adapt this formulation to an unsupervised setting suitable for our problem. We build upon the assumption that symptoms related to HFPEF will become apparent during exercise [4] and will be reflected in the myocardial velocity patterns especially of left ventricular long-axis function. Accordingly, the inputs for the MKL algorithm come from MVI acquisitions of healthy and suspected HFPEF subjects, at different stages of a stress protocol and in different regions of the left ventricular wall.
We demonstrate the relevance of jointly analyzing these multivariate data within a MKL framework. Notably, clusters can be intuited from the velocity traces and agree with clinical diagnosis. Additionally, we show that the analysis is effectively improved by the inclusion of multiple features. These results suggest that the characterization of the HPFEF syndrome can be improved using our representation.
2 Methods: Unsupervised MKL for Dimensionality Reduction
In the following, we describe how the MKL-based algorithm of [8] can be adapted to an unsupervised setting. Figure 1 outlines the pipeline of the proposed algorithm.
The starting point is the ambient space containing the input data, organized in a set of M features  ,
, ![$${m \in [1,M]}$$](/wp-content/uploads/2016/09/A339585_1_En_8_Chapter_IEq2.gif) . In the first step of MKL, a kernel-based affinity matrix
. In the first step of MKL, a kernel-based affinity matrix  associated to each feature
  is computed. We choose Gaussian kernels of the form:
  , where
  stands for the feature m of subject i (
![$$i\in [1,N]$$](/wp-content/uploads/2016/09/A339585_1_En_8_Chapter_IEq7.gif) ) and
) and  for the kernel bandwidth, whose choice is discussed in Sect. 3.2. Additionally, a sparse global affinity matrix
  (each of its elements
  codifying neighborhood membership) is calculated as
  , where
  corresponds to the kernel
  normalized by its variance. This serves to avoid that higher variability features have a larger impact in the neighborhood decision.
 ,
, ![$${m \in [1,M]}$$](/wp-content/uploads/2016/09/A339585_1_En_8_Chapter_IEq2.gif) . In the first step of MKL, a kernel-based affinity matrix
. In the first step of MKL, a kernel-based affinity matrix  associated to each feature
  is computed. We choose Gaussian kernels of the form:
  , where
  stands for the feature m of subject i (
![$$i\in [1,N]$$](/wp-content/uploads/2016/09/A339585_1_En_8_Chapter_IEq7.gif) ) and
) and  for the kernel bandwidth, whose choice is discussed in Sect. 3.2. Additionally, a sparse global affinity matrix
  (each of its elements
  codifying neighborhood membership) is calculated as
  , where
  corresponds to the kernel
  normalized by its variance. This serves to avoid that higher variability features have a larger impact in the neighborhood decision.
 and
and  are the inputs to the MKL block, which is the core of the algorithm. It is based on a Laplacian formulation [1] that ensures that subjects with similar characteristics (neighbors) remain close in the output space. In univariate graph embedding [11], the optimal embedding is obtained through the minimization of:
(1)
 is a diagonal matrix, whose values are the result of a row-wise summation of
  , N is the number of subjects,
  is the value of the one and only descriptor (univariate setting) associated to subject i and
  is the matrix that maps the input data into the output space. Notice that the values
  for neighbors are high, thus forcing their proximity in the embedding.
We adapt this formulation to combine multiple features in an unsupervised MKL framework [8], through the minimization of:
![$$\begin{aligned} \begin{aligned} \underset{\mathbf {A},\varvec{\beta }}{\text {min}}&\sum \limits _{i,j=1}^N \Vert \mathbf {A}^\top \mathbb {K}^{(i)} \varvec{\beta }- \mathbf {A}^\top \mathbb {K}^{(j)} \varvec{\beta }\Vert ^2 \mathbf {W}_{i,j}\\ \text {s.t.} &\sum \limits _{i=1}^N \Vert \mathbf {A}^\top \mathbb {K}^{(i)}\varvec{\beta }\Vert ^2 \mathbf {D}_{i,i} = 1, \beta _m \ge 0 ,\forall m \in [1,M], \end{aligned} \end{aligned}$$](/wp-content/uploads/2016/09/A339585_1_En_8_Chapter_Equ2.gif)
where  is defined for subject i as
 ![$$\mathbb {K}^{(i)} = \left[ \mathbf {K}_m (n,i) \right] _{(n,m) \in [1,N] \times [1,M]}$$](/wp-content/uploads/2016/09/A339585_1_En_8_Chapter_IEq22.gif) .
.
![$$\begin{aligned} \begin{aligned} \underset{\mathbf {A},\varvec{\beta }}{\text {min}}&\sum \limits _{i,j=1}^N \Vert \mathbf {A}^\top \mathbb {K}^{(i)} \varvec{\beta }- \mathbf {A}^\top \mathbb {K}^{(j)} \varvec{\beta }\Vert ^2 \mathbf {W}_{i,j}\\ \text {s.t.} &\sum \limits _{i=1}^N \Vert \mathbf {A}^\top \mathbb {K}^{(i)}\varvec{\beta }\Vert ^2 \mathbf {D}_{i,i} = 1, \beta _m \ge 0 ,\forall m \in [1,M], \end{aligned} \end{aligned}$$](/wp-content/uploads/2016/09/A339585_1_En_8_Chapter_Equ2.gif)
(2)
 is defined for subject i as
 ![$$\mathbb {K}^{(i)} = \left[ \mathbf {K}_m (n,i) \right] _{(n,m) \in [1,N] \times [1,M]}$$](/wp-content/uploads/2016/09/A339585_1_En_8_Chapter_IEq22.gif) .
.The unknowns in Eq. 2 are the matrix  , which performs the final mapping to the output space, and the weights given to the different features
 ![$$\varvec{\beta }= [\beta _1 \dots \beta _M]^\top $$](/wp-content/uploads/2016/09/A339585_1_En_8_Chapter_IEq24.gif) .
.
 , which performs the final mapping to the output space, and the weights given to the different features
 ![$$\varvec{\beta }= [\beta _1 \dots \beta _M]^\top $$](/wp-content/uploads/2016/09/A339585_1_En_8_Chapter_IEq24.gif) .
.These values are calculated by means of a two-stage optimization strategy. The first stage of the optimization aims at optimizing  , while
  is fixed. This step is initialized by fixing
 ![$$\beta _m = 1, \forall m \in [1,M]$$](/wp-content/uploads/2016/09/A339585_1_En_8_Chapter_IEq27.gif) . The problem turns out to be a generalized eigenvalue problem, with an explicit solution. The second stage of the optimization aims at optimizing
. The problem turns out to be a generalized eigenvalue problem, with an explicit solution. The second stage of the optimization aims at optimizing  , while fixing the previously calculated
  . This problem can be solved by quadratically constrained quadratic programming (QCQP), which is not straightforward. Nevertheless, it can be relaxed to a semidefinite programming problem, which can be solved more efficiently. In practice, this is addressed by the use of CVX, a package for solving convex programs [6]. Further details about the optimization can be found in [8].
 , while
  is fixed. This step is initialized by fixing
 ![$$\beta _m = 1, \forall m \in [1,M]$$](/wp-content/uploads/2016/09/A339585_1_En_8_Chapter_IEq27.gif) . The problem turns out to be a generalized eigenvalue problem, with an explicit solution. The second stage of the optimization aims at optimizing
. The problem turns out to be a generalized eigenvalue problem, with an explicit solution. The second stage of the optimization aims at optimizing  , while fixing the previously calculated
  . This problem can be solved by quadratically constrained quadratic programming (QCQP), which is not straightforward. Nevertheless, it can be relaxed to a semidefinite programming problem, which can be solved more efficiently. In practice, this is addressed by the use of CVX, a package for solving convex programs [6]. Further details about the optimization can be found in [8].
The input samples are mapped to the output space by  , where
 ![$$\mathbf {y} = [\mathbf {y}_1; \mathbf {y}_2; \dots ; \mathbf {y}_N]$$](/wp-content/uploads/2016/09/A339585_1_En_8_Chapter_IEq31.gif) gathers (row-wise) the coordinates of each input sample in the output space.
gathers (row-wise) the coordinates of each input sample in the output space.
 , where
 ![$$\mathbf {y} = [\mathbf {y}_1; \mathbf {y}_2; \dots ; \mathbf {y}_N]$$](/wp-content/uploads/2016/09/A339585_1_En_8_Chapter_IEq31.gif) gathers (row-wise) the coordinates of each input sample in the output space.
gathers (row-wise) the coordinates of each input sample in the output space.3 Experiments and Results
3.1 Echocardiographic Data
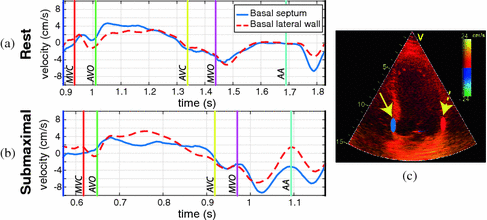
The method was applied to 2D sequences in a 4-chamber view from a stress echocardiography protocol using a semi-supine bicycle. Commercial software (EchoPAC, v.113, GE Healthcare, Milwaukee, WI) was used for information extraction. The database consisted of 33 subjects (21 healthy controls and 12 HFPEF subjects, diagnosed by Paulus’ criteria [9]), with age  years. The sequences were acquired at rest and during submaximal bicycle exercise (at a heart rate of 100–110 beats per minute, before fusion of the early and late diastolic (atrial) velocities of mitral inflow) [4]. Velocity patterns were extracted from myocardial velocity acquisitions, using a fixed sample (size
  mm, located
  10 mm above the mitral annulus at end-systole) at the basal septum and basal lateral wall of the left ventricle (LV). We consider that these regions are sufficient to account for the global longitudinal changes possibly present in the ventricles of the studied HFPEF subjects. The samples were kept fixed to minimize the variability that may appear when tracking the measured regions along the heart cycle, thus maintaining the acquisition as simple as possible. Case-per-case examination was performed to check that the sample area remained within the myocardial wall. The total number of extracted features was 4 (septal/lateral at rest/submaximal), referred to as global analysis, extendible to 16 for a local analysis, where different cardiac phases are treated independently (systole, iso-volumic relaxation, early and late diastole). An example of the data extracted for a given subject is illustrated in Fig. 2. Class labels based on clinical diagnosis were provided together with the database. However, the subsequent learning was performed in an unsupervised way. Such labels were only used to compare the characterization of the learnt representation.
 years. The sequences were acquired at rest and during submaximal bicycle exercise (at a heart rate of 100–110 beats per minute, before fusion of the early and late diastolic (atrial) velocities of mitral inflow) [4]. Velocity patterns were extracted from myocardial velocity acquisitions, using a fixed sample (size
  mm, located
  10 mm above the mitral annulus at end-systole) at the basal septum and basal lateral wall of the left ventricle (LV). We consider that these regions are sufficient to account for the global longitudinal changes possibly present in the ventricles of the studied HFPEF subjects. The samples were kept fixed to minimize the variability that may appear when tracking the measured regions along the heart cycle, thus maintaining the acquisition as simple as possible. Case-per-case examination was performed to check that the sample area remained within the myocardial wall. The total number of extracted features was 4 (septal/lateral at rest/submaximal), referred to as global analysis, extendible to 16 for a local analysis, where different cardiac phases are treated independently (systole, iso-volumic relaxation, early and late diastole). An example of the data extracted for a given subject is illustrated in Fig. 2. Class labels based on clinical diagnosis were provided together with the database. However, the subsequent learning was performed in an unsupervised way. Such labels were only used to compare the characterization of the learnt representation.


