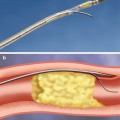
Fig. 2.1
Schematic diagram of the coronary anatomy. RCA right coronary artery, SN sinus nodal artery, CB conus branch, RV right ventricular artery, AM acute marginal artery, PD posterior descending artery, PL posterior lateral artery, LCA left coronary artery, LAD left anterior descending artery, S septal branch, D diagonal branch, LCx left circumflex, OM obtuse marginal artery
Table 2.1
Views for optimal visualization of the coronary anatomy
AP | LAO | RAO | Left lateral | |
|---|---|---|---|---|
Left main | Optimal view for LM | LAO/caudal: bifurcation of LAD, LCx, and Ramus | ||
LAD | AP/cranial | LAO/cranial: prox LAD, diagonals, septals | RAO cranial or caudal: mid, distal LAD, diagonals | Mid and distal LAD |
Straight LAO: mid and distal LAD | ||||
LCX | Steep LAO/cranial: prox LCx | RAO/caudal: proximal, mid LCx, and OMs | ||
RCA | Steep LAO: ostial, proximal RCA | Straight RAO: mid RCA | Mid and distal RCA, PDA | |
LAO/cranial: distal RCA, PDA, crux and PLSA | RAO/cranial: PDA and PLSA |
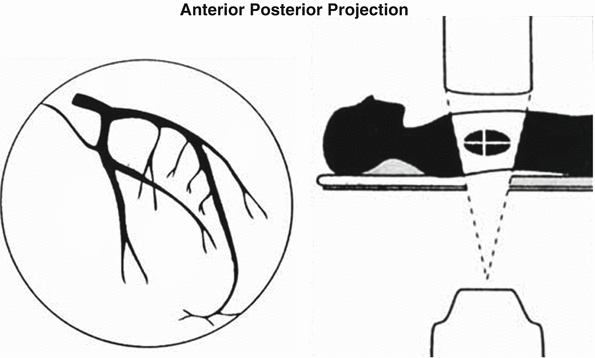
Fig. 2.2
Anterior-posterior (AP) view of the left coronary artery. Ideal view to visualize the left main coronary segment
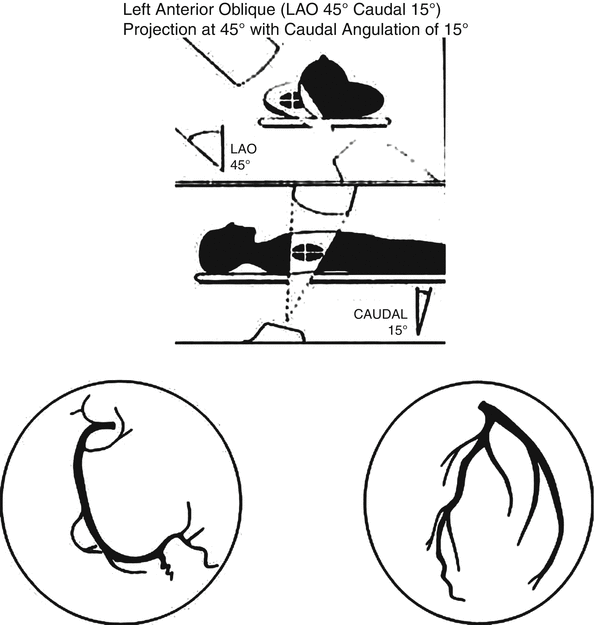
Fig. 2.3
Left anterior oblique (LAO) view of the left and right coronary arteries. Ideal view to visualize the mid and distal left anterior descending and right coronary
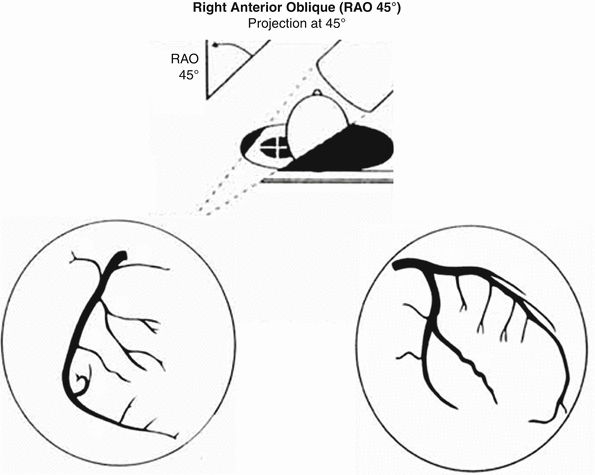
Fig. 2.4
Right anterior oblique (RAO) view of the left and right coronary arteries. Ideal view to visualize the left circumflex and mid right coronary artery
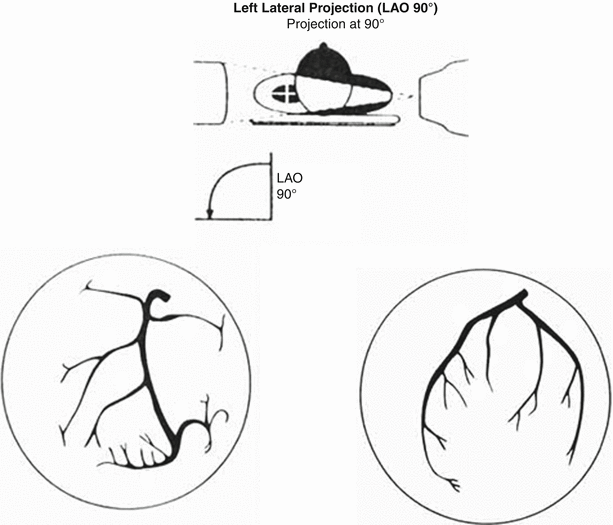
Fig. 2.5
Left lateral (LLat) view of the left and right coronary arteries. Ideal view to visualize the mid and distal segment of the left anterior descending and right coronary arteries
Factors Contributing to Variability during Angiographic Image Acquisition
Variability in the angiographic assessment of vessel diameter and other measurements can be introduced by a number of factors, including biologic differences among lumen diameters (e.g., reference vessel size, vasomotor tone, thrombus) and inconsistencies in radiographic image acquisition parameters (e.g., quantum mottling, out-of-plane magnification, foreshortening). Acquisition parameters should be carefully controlled in order to optimize the overall diagnostic accuracy of quantitative angiography. Common sources of error during angiographic image acquisition and potential corrections are summarized in Table 2.2.
Table 2.2
Correctable sources of imaging error during angiographic acquisition
Source of error | Potential corrections |
|---|---|
Biologic variation in lumen diameter | |
Vasomotor tone | Nitroglycerin, 200 μmUg intracoronary every 10 min |
Variations in image acquisition | |
Single studies | |
Vessel motion | |
Cardiac | End-diastolic/end-systolic frame |
Respiration | Breath holding |
Vessel foreshortening | Obtain multiple angiographic projections |
Insufficient contrast injection | Use 7 or 8 French large, high-flow catheters |
Branch vessel overlap | Obtain multiple angiographic projections |
Pincushion distortion | Image objects in center of image |
Sequential studies | |
X-ray generator (pulse width/dose/beam quality) | Repeat study in same imaging laboratory |
X-ray tube (focal spot/shape/tube current) | As above |
Image intensifier (magnification/resolution) | As above |
Differences in angles and gantry height | Record gantry height/angle/skew on worksheet |
Image calibration | Use measured catheter diameter |
Errors in image analysis | |
Electronic noise | Recursive digitization and frame averaging |
Quantum noise | Spatial filtering of digital image data |
Automated edge-detection algorithm | Minimize observer interaction |
Selection of reference positions | Interpolated or averaged normal segment |
Identification of lesion length | Use of side branches, other landmarks |
Frame selection | End-diastolic frame showing “worst” view |
Biologic Variability
Studies that include a wide range of vessel sizes have more biologic variability in vessel diameters (as reflected in the standard deviation of the measurements) than those with more restrictive inclusion criteria. Vasomotor tone may also affect the reference vessel size, resulting in distal vasoconstriction and vasospasm that dynamically affect the arterial diameter in paired measurements. Transient maximum coronary vasodilation may be achieved with intracoronary (50–200 μ(micro)g), intravenous (>10 μ(micro)g/min), or sublingual (0.4–0.8 mg) nitroglycerin, or intracoronary (3 mg) isosorbide dinitrate.
Acquisition Variability
Variable acquisition factors include cardiac and respiratory motion artifact, vessel foreshortening, inadequate filling of the coronary artery (“streaming”), overfilling of the aortic cusp with contrast, and failure to separate overlapping branch vessels from the stenosis. These factors may lead to either overestimation or underestimation of lesion severity. Out-of-plane magnification and pincushion distortion may also contribute to small errors in angiographic imaging. For sequential studies, using the identical angiographic imaging laboratory allows replication of the X-ray generator, tube, and image intensifier parameters.
Data Compression Variability
One limitation of the cineless catheterization laboratory is the vast volume of digital data required for storage and real time retrieval. On average a single interventional case requires a 7.5 MB per second transfer rate. Data compression and subsequent decompression may minimize archiving space and data transfer time but can also introduce variability if not properly implemented. Compression can be achieved using the Joint Photographic Experts Group (JPEG) standard, where lossless compression of up to 3-fold can be completely recovered upon retrieval of the image and where lossy compression results in irretrievable loss of data. In clinical practice, JPEG lossy compression up to 15:1 has been shown to have no effect on identification of dissections, thrombus, or the presence of intracoronary stents and is therefore deemed acceptable for clinical decision-making during coronary interventions [4]. Quantitative angiographic analysis of 5:1, 8:1, and 12:1 lossy JPEG compression has been shown in one study to result in higher intra-observer variability (0.23–0.31 mm) compared to original images (<0.13 mm) and is therefore not recommended for QCA in clinical trials [5].
Quantitative Coronary Angiography (QCA) Analysis
Limitations of Qualitative Estimates of Lesion Severity
In clinical practice, estimation of coronary artery lesions is performed by visually assessing 2-dimensional angiograms taken in multiple projections. While this method provides acceptable estimates of luminal narrowing for basic clinical decision-making, multiple studies have demonstrated that it is prone to significant inter- and intra-observer variability [1–3] and frequently causes either overestimation or underestimation of lesion severity [2, 6–8]. A blinded review of angiograms by experienced cardiologists reported an average diameter stenosis of 85 % before PCI and 30 % post-procedurally, with a bimodal distribution. QCA revealed average pre- and post-procedural stenosis of 68 % and 49 %, respectively, with a Gaussian distribution. These differences corresponded to a 200 % error in the estimation of percent diameter stenosis [6]. In addition, visual estimates of stenosis severity frequently result in values which are physiologically incompatible with anterograde flow (e.g., 90–99 % diameter stenosis). Handheld and digital calipers were later developed to provide absolute vessel diameters and improve reproducibility of measurements; however, this method continued to over- and underestimate stenosis [9]. The limited utility of visual estimates of lesion severity in clinical trials led to the development of computer-assisted QCA, which improves accuracy and reproducibility and provides a wide variety of measurements useful in both research and clinical settings.
Computer-Assisted Quantitative Coronary Angiography (QCA)
Several generations of QCA systems have been developed based on edge-detection algorithms to improve measurement accuracy. First-generation algorithms improved the reliability of coronary measurements; [10–12] however, these systems tended to overestimate the diameters of small vessels [13]. Second-generation systems corrected for overestimation of small vessel sizes (diameter approximation <1.2 mm) and produced more reliable results in small vessels [14]. Further improvements were made in third-generation systems to take advantage of images from new digital flat-panel detectors instead of the conventional image intensifier systems. These systems are better able to determine smaller-diameter vessels [15] and analyze complex lesion morphology with irregular borders [16].
2-Dimensional Quantitative Coronary Angiography
The process of QCA can be subdivided into several distinct steps: digitization, image calibration, and arterial contour detection. Advances have been made to each of these steps over the last several decades. The process of digitization from cine film using cine-video converter is obsolete and was replaced by digital systems with direct digital input to a video camera. The analog video output signal is modified electronically and results in a greater contrast differences in areas with high X-ray absorption and lower contrast differences in areas with low X-ray absorption, significantly improving image quality. Conventional vacuum tubes have largely been replaced by flat-panel detectors which do not affect the quality of QCA but reduce geometric distortions. Image calibration is often done with contrast-filled injection catheters and can be problematic due to variable image quality and out-of-plane magnification. This can be overcome by using biplane calibration, but this is rarely used in routine QCA. The contour-detection procedure determines the vessel edge based on the weighted sum of the first- and second-derivative functions of the brightness values of scan lines perpendicular to the center line which in turn undergoes a minimal cost analysis that determines the optimal contour path along the segment (Fig. 2.6). Systems also take into account the image resolution and vessel diameter. Vessel contour editing can be performed manually but should be minimized. The two most commonly used angiographic analysis systems are the Cardiovascular Angiography Analysis System (CAAS, Pie Medical B.V., Maastricht, the Netherlands) and the Coronary Measurement System (CMS, Medis system, Leiden, the Netherlands) (Fig. 2.7).
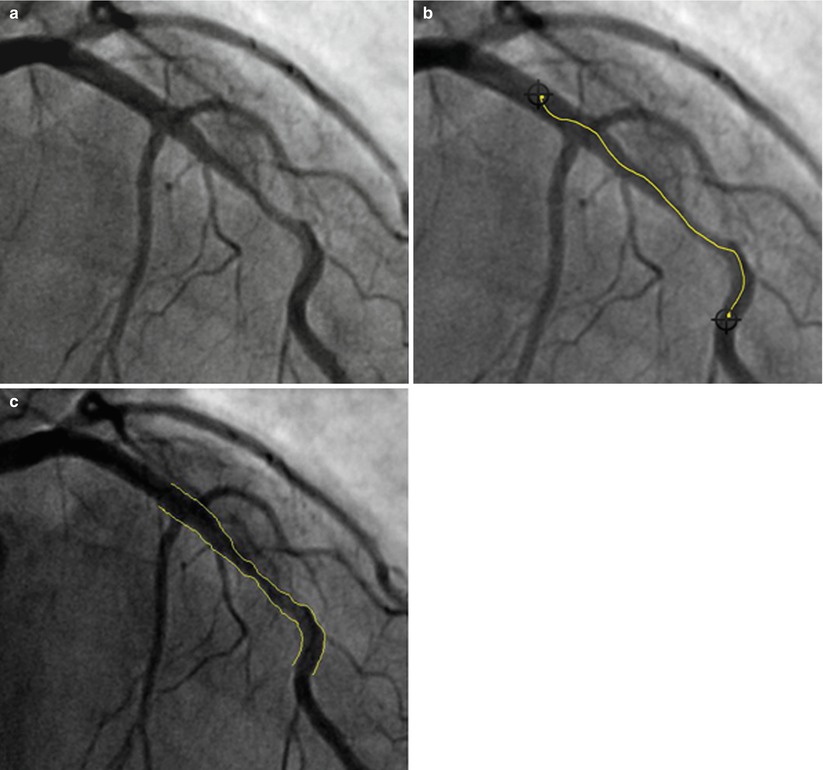
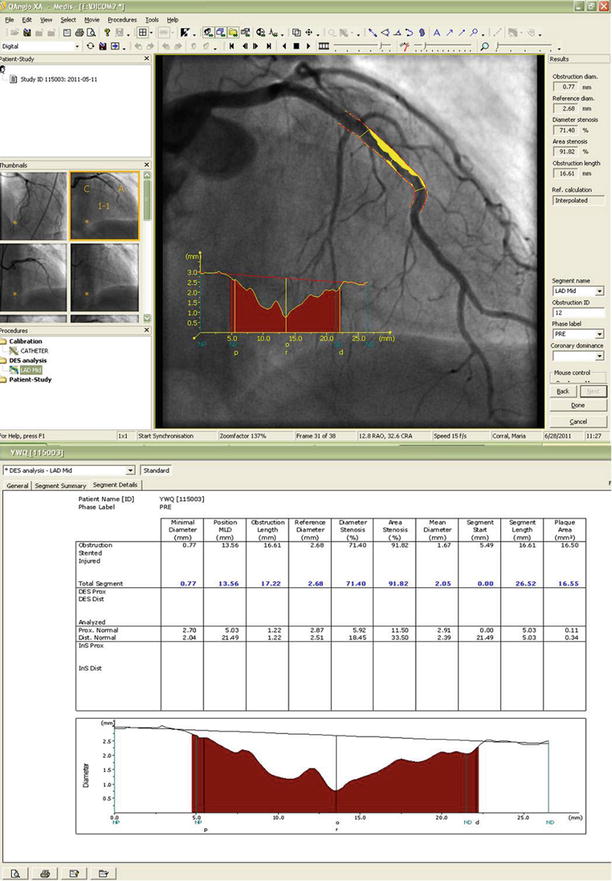

Fig. 2.6
Quantitative coronary angiogram segment analysis. (a) Preprocedural angiogram of lesion. (b) Manual selection of lesion segment. (c) Result of automatic contour-detection algorithm

Fig. 2.7
The results of the minimal cost analysis using the Medis QAngio XA software (Version 7.2.34.0). The images include the reconstructed original vessel contours, plaque area (shaded), and the diameter function. The absolute and relative QCA parameters are presented in the lower analysis box
3-Dimensional Quantitative Coronary Angiography
Currently, 2-dimensional (2D) QCA is the most commonly used and validated form of QCA. However, 2D angiography technology has limitations because of vessel overlap and vessel foreshortening during image acquisition. This is especially problematic in more complex lesions such as bifurcations. A 3D angiography utilizes standard 2D angiographic images obtained at least 30° apart and with minimal vessel overlap and reconstructs 3D images. Several 3D QCA programs are now available: CardiOp-B (Paieon Medical Ltd., Park Afek, Israel) and CAAS 5 (Pie Medical Imaging, Maastricht, the Netherlands, and Medis, Leiden, the Netherlands). In these systems, the user defines the area of interest by defining the proximal end, distal end, and area of stenosis. Their calibration methods differ, however: CardiOp-B requires the operator to input the size of the catheter in the image into the program, whereas the Medis and CAAS 5 system automatically calibrates the images using Digital Imaging and Communications in Medicine (DICOM) information embedded in the images [17, 18]. After image creation, operators can rotate or zoom the image to find an optimal visualization angle [19, 20]. 3D QCA programs have been validated [21, 22] and can provide information on vessel size, percent diameter stenosis, minimal lumen diameter, bifurcation angle, and other QCA values. It was thought that 3D QCA would improve accuracy by resolving problems with vessel foreshortening and out-of-plane magnification, but thus far, comparisons to conventional 2D QCA programs have reported mixed results [18, 19, 22–25].
Inherent Limitations of Angiography in Detecting Coronary Artery Disease
Coronary atherosclerosis is a dynamic cycle of progression, regression, healing, and development of new atherosclerotic lesions. A complicating factor in the angiographic evaluation of the severity and degree of coronary atherosclerosis is the occurrence of compensatory mechanisms, characterized by enlargement of the atherosclerotic coronary artery that occurs in the early stages of plaque formation [26, 27]. This compensatory enlargement preserves a near-normal lumen cross-sectional area (and angiographic appearance), so that the early atherosclerotic plaque will have minimal hemodynamic effects. As the maximal stretching capacities of the vessel is reached, the expansion of the vessel will stop and further plaque deposition will begin to impinge on the lumen. Only once the lumen of the vessel becomes impaired does it become visible on arteriography, which visualizes only the 2-dimensional contrast-filled lumen. Because X-ray arteriography only depicts the coronary lumen, it underestimates the presence of diffuse atherosclerosis. Cross-sectional imaging of the coronary arteries is better assessed in these early stages by intravascular ultrasound (IVUS), which provides high-resolution cross sections of the arterial wall and demonstrates the presence or absence of plaque deposition and compensatory arterial enlargement. For intermediate lesions, precise physiologic measurements of stenosis severity, such as fractional flow reserve or coronary Doppler measurements, are better suited for clinical decision-making.
Measurement Factors Contributing to QCA Variability
In addition to biologic differences among lumen diameters and inconsistencies in radiographic image acquisition parameters (discussed previously), angiographic measurements can also introduce variability into the assessment of vessel diameters. Analysis of two or more orthogonal projections permits a more accurate assessment of the physiologic significance of lesion severity, although a second, technically suitable projection is not available in many cases due to vessel foreshortening, overlap, or poor image quality. If orthogonal projections are not available, analyses of the “worst-view” projection may provide sufficiently accurate information for clinical studies. Herrington and colleagues [13] used a components-of-variance model to show that the process of acquiring and performing quantitative angiography on selected frames accounted for 57 % of the total measurement variability, whereas patient, procedure, and equipment variations accounted for 30 % of total variability. Frame selection accounted for the remaining 13 % of total variability. When direct digital angiography is performed and random errors associated with noise in the cine-video pathway are eliminated, frame selection may be a much more important contributor to overall measurement variability. Frame selection has been associated with substantial inter-observer variability, and the frame demonstrating the sharpest and tightest view of the stenosis should be used.
Automated quantitative angiographic systems also differ with respect to the preferred method of calibration, location of the arterial border and construction of its contour, use of minimal cost or “smoothing” algorithms, and selection of normal “reference” segments. Edge-detection algorithms that identify the arterial edge using a 50 % weighted threshold of the first- and second-derivative extrema may have systematically larger reference and obstruction diameters than those using a 75 % weight (weighted toward the first-derivative extremum) or the first-derivative extremum. These systematic differences may also affect the accuracy and reproducibility of the absolute and relative angiographic measurements. Accordingly, each Angiographic Core Laboratory should independently determine its own variability during the performance of quantitative angiographic studies, potentially allowing standardization of techniques among different Core Laboratories.
Angiographic Parameters
Qualitative Morphologic Features
Several angiographic morphologic characteristics have been identified that have short- and long-term prognostic implications after coronary intervention with balloon angioplasty and new device angioplasty. The joint task force of the American College of Cardiology (ACC) and American Heart Association (AHA) established criteria in 1988 to estimate procedural success and complication rates after balloon angioplasty based on the presence or absence of specific high-risk lesion characteristics (Table 2.3). These were validated with good correlation with procedural success among patients undergoing multivessel PCI. The Society for Cardiac Angiography and Interventions (SCAI) more recently developed and validated a simplified score based on four groups: non-Type C-patent, Type C-patent, non-Type C-occluded, and Type C-occluded (Table 2.4) [28]. This classification provided better discrimination for procedure success or complications (c statistic of 0.75) compared to the original ACC/AHA classification (c statistic of 0.69) or to the modified ACC/AHA system (c statistic of 0.71) [28]. The Mayo Clinic Risk Score, developed and validated in a database of 5,064 contemporary PCI patients, was based on the presence or absence of eight morphologic variables [29]. Compared to the ACC/AHA lesion classification, the Mayo Clinic risk score better predicts cardiovascular complications but is a less accurate determinant of angiographic success.
Table 2.3
ACC-AHA characteristics of Type A, B and C coronary lesions
Type A lesions (high success [> 85 %]; low risk) | |
Discrete (<10 mm) | Little or no calcium |
Concentric | Less than totally occlusive |
Readily accessible | Not ostial in location |
Nonangulated segment (<45°) | No major side branch involvement |
Smooth contour | Absence of thrombus |
Type B lesions (moderate success [60–85 %]; moderate risk) | |
Tubular (10–20 mm length) | Moderate to heavy calcification |
Eccentric | Total occlusions <3 months old |
Moderate tortuosity of proximal segment | Ostial in location |
Moderately angulated (45–90°) | Bifurcation lesion requiring double guidewire |
Irregular contour | Some thrombus present |
Type C lesions (low success [< 60 %]; high risk) | |
Diffuse (>20 mm length) | Total occlusion >3 months old |
Excessive tortuosity of proximal segment | Inability to protect major side branches |
Extremely angulated segment (> 90°) | Degenerated vein grafts with friable lesions |
Table 2.4
SCAI lesion classification system: Class I–IV lesions
Type I lesion (highest success expected; lowest risk) |
(1) Does not meet criteria for C lesion |
(2) Patent |
Type II lesions |
(1) Meets any of these criteria for ACC/AHA C lesion |
Diffuse (greater than 2 cm length) |
Excessive tortuosity of proximal segment |
Extremely angulated segments greater than 90° |

