Fig. 6.1
Ultrasound of the knee in OA. Evidence of effusion at the level of the suprapatellar recess. OA osteoarthritis
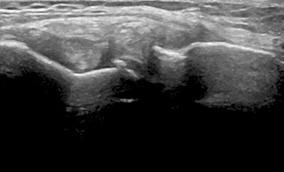
Fig. 6.2
Ultrasound of the knee in OA. Evidence of osteophytes at the level of the lateral aspect of the joint. OA osteoarthritis
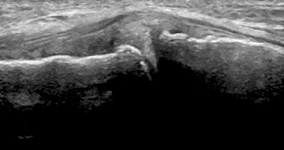
Fig. 6.3
Ultrasound of the knee in OA. Evidence of osteophytes at the level of the lateral aspect of the joint. OA osteoarthritis
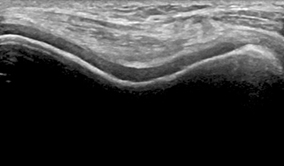
Fig. 6.4
Ultrasound of the knee in OA. Hyaline cartilage of the femoral condyles and trochlea. Abnormalities of the echotexture with loss of the anechoic structure and irregularities of the cartilage margins are visible. OA osteoarthritis
US complements the clinical evaluation of OA and can bridge the gap between the clinical and radiological findings [8–11]. It can be easily and swiftly performed in the same room used for the physical examination, reducing the patients’ discomfort [12]. US facilitates monitoring of the disease progression and follow-up assessment of the response to local and systemic therapy in OA. Moreover, it can be repeated as many times as necessary [13]. Sonography consists of direct and multiplanar evaluation of different areas of interest and most of the peripheral joints involved by disease can be examined. These features allow imaging of soft tissues, such as hyaline cartilage, synovial membrane, and joint effusion; tendons, ligaments, and bursae, as well as external area of the menisci [14]. In addition, US examination can detect alterations of the cortical bone and demonstrate some of the disease typical structural changes [15]. US provides guidance for local procedures which are performed safely and are well tolerated by patients when executed under the sonographic guidance [16–18] (Table 6.1).
Table 6.1
Indications of ultrasonographic assessment in OA
Indications |
|---|
Detection of joint effusion |
Detection of synovial thickening and hypertrophy |
Differentiation between active and inactive synovitis |
Assessment of cartilage lesions |
Evaluation of osteophytes |
Detection of erosions (erosive hand OA) |
Evaluation of mucous cysts (hand OA) |
Assessment of periarticular soft tissues abnormalities in OA (bursitis) |
Execution of US-guided procedures |
Monitoring of disease progression from early to late stages; follow-up of the response to local and systemic therapies |
Importantly, US can directly image certain components of articular cartilage . Normal hyaline cartilage is imaged by US as a homogeneously anechoic layer lining the bony cortex and having a superficial as well as deep margins which characteristically appear thin, sharp, continuous, and regularly hyperechoic. In OA, a wide set of abnormalities are visualized, with evidence of loss of the anechoic texture, irregularities of the margins, and progressive thinning (Fig. 6.4). However, for the poor contrast between hyaline cartilage and synovial fluid that are both anechoic, it may be sometimes difficult to assess small focal defects of the articular cartilage on US examination.
Sonographic Findings
For the correct execution of US joint examination and consequent interpretation of the pathologic findings, the knowledge of the normal joint and periarticular structures in US is mandatory. The most common sonographic findings in OA are reported in Table 6.2.
Table 6.2
Sonographic findings in OA
Pathology | Findings |
|---|---|
Cartilage lesions | Blurring, loss of sharpness, and irregularities of the anterior and posterior margins |
Loss of homogeneity and loss of anechogenicity | |
Focal (asymmetric) or diffuse thickening | |
Joint effusion | Abnormal hypoechoic or anechoic intra-articular tissue that is displaceable and compressible, but without Doppler signal* |
Synovial hypertrophy | Abnormal hypoechoic, intra-articular tissue that is nondisplaceable, poorly compressible, and may exhibit Doppler signal |
Joint capsule hypertrophy | Joint capsule thickening |
Osteophyte | A step-up bony prominence at the end of the normal bone contour, or at the margin of the joint seen in two perpendicular planes, with or without acoustic shadow |
Erosion (hand OA) | A cortical breakage with the step-down contour defect seen in two perpendicular planes in the joint space |
Mucoid cysts (hand OA) | Hypoechoic or anechoic cyst, similar area located over the distal interphalangeal joint |
Bursitis | Abnormal hypoechoic or anechoic intrabursal material that is displaceable and compressible |
The normal joint is visualized as a typical regularity of the bony cortex, a small amount of hypo/anechoic fluid, and a homogeneously echoic joint capsule. In order to visualize the hyaline cartilage, specific acoustic windows for dedicated scans and correct patient positioning should be implemented (Table 6.3).
Table 6.3
Ultrasound scan and patient position for cartilage assessment
Joint | Patient position | Scan |
|---|---|---|
Metacarpophalangeal, proximal interphalangeal, and distal interphalangeal | Sitting position, joint fully flexed | Dorsal longitudinal scan Dorsal transverse scan |
Elbow | Sitting position, extension of the elbow and supination of the lower arm | Anterior humeroradial longitudinal scan Anterior humeroulnar longitudinal scan Anterior transverse scan |
Shoulder | Sitting position, hand in supination placed on the patient’s thigh, with elbow slightly flexed | Posterior transverse scan |
Hip | Supine position, leg extended and slightly externally rotated | Anterior longitudinal scan (parallel to femoral neck) |
Knee | Supine position, joint fully flexed | Anterior transverse scan in the suprapatellar area Anterior longitudinal scan in the suprapatellar area (over the condyles and intercondylar notch) |
Ankle (tibiotalar joint) | Supine position, flexed knee with foot on the examination table | Dorsal longitudinal scan Dorsal transverse scan |
Metatarsophalangeal | Supine position, flexed knee with foot on the examination table | Dorsal longitudinal scan Dorsal transverse scan |
Cartilage Assessment
The normal cartilage appears as an anechoic, homogenous band lining the bony profile with two sharp, continuous, and regular hypoechoic margins [19] (anterior and posterior). The anterior surface, sharper and thinner than the deeper one, represents the interface between the cartilage and the soft tissues; the correct, perpendicular penetration of the US beam allows optimal visualization [20]. The posterior margin is more echoic and thicker than the anterior one, representing the interface between the cartilage and the bony profile. The cartilage has a prevalent water content, therefore appears as a clearly defined anechoic structure lacking internal echoes [21]. Its thickness varies from 0.1 to 0.5 mm in the hand joints and 3 mm in the knee joint.
Cartilage alterations are viewed in a wide spectrum of ultrasonographic outcomes, such as those appearing in early disease showing initial blurring of the edges, which become irregular and lose their sharpness. As the disease progresses, the echogenicity varies with the typical loss of homogeneity and transparency (Fig. 6.4). At later stages, focal and asymmetric narrowing appears with the progression towards the thinning of the cartilaginous layer until disappearance and consecutive bony denudation. Care should be taken in the presence of joint effusion over the superficial cartilage edge, which may create a false thickening.
There are some limitations related to the use of US in the assessment of hyaline cartilage at different joint sites. Particularly those related to the limited width of the acoustic windows which may generate a partial visualization view of the cartilage.
Joint Effusion
The Outcome Measures in Rheumatoid Arthritis Clinical Trials (OMERACT) group’s definitions for synovial effusion and synovial hypertrophy in rheumatoid arthritis can be usefully applied in OA (Table 6.2) [22]. Joint effusion appears as an anechoic or inhomogeneously hypoechoic material within the joint cavity, depending on the presence of intra-articular debris or calcified material (Fig. 6.1). The execution of multiplanar and dynamic scans facilitates the evaluation of joint effusion. To avoid misinterpretation in case of small amounts of fluid (which might be physiological) comparison to the contralateral side is recommended.
Synovial Hypertrophy
Synovial proliferation is defined as a poorly compressible hypoechoic tissue in the synovial joints . In the presence of active inflammation, Doppler signal, corresponding to the hyperemic phenomena within the synovial membrane, is demonstrated [23].
Osteophytes and Erosions
An osteophyte is defined as an abnormal step-up prominence of the bone at the end of the normal bone contour or at the margin of the joint, which can be seen in two perpendicular planes (Table 6.2). It usually has a posterior acoustic shadow. Osteophytes are clearly depicted by US at different joint sites and multiplanar assessment facilitates their detection (Figs. 6.2 and 6.3).
Related posts:


Stay updated, free articles. Join our Telegram channel

Full access? Get Clinical Tree


