CHAPTER 21 Other Arteriopathies
CEREBRAL AUTOSOMAL DOMINANT ARTERIOPATHY WITH SUBCORTICAL INFARCTS AND LEUKOENCEPHALOPATHY
Epidemiology
The prevalence of CADASIL is reported as 2 to 4 per 100,000 population. It usually presents in the fourth to sixth decades. The mean age at death is 59 to 65 years.1
Pathology
Histopathologically, electron-dense granular material is deposited within the media of the walls of small and medium-sized leptomeningeal arteries, causing concentric thickening of the wall, splitting of the internal elastic lamina, duplication, hyalinosis, and fibrosis of the adventitia with loss of vascular smooth muscle cells.2
Imaging
MRI
The radiologic spectrum of MRI findings in CADASIL includes white matter hyperintensity, subcortical lacunar lesions, lacunar infarcts, and microbleeds (Fig. 21-1). The white matter T2 hyperintensities are found in both symptomatic and asymptomatic patients. The subcortical lacunar lesions are formed by dilated perivascular spaces and adjacent spongiform change. These lesions are linearly arrayed, well circumscribed, and rounded with signal intensity identical to cerebrospinal fluid (CSF). They are identified by their location at the gray matter/white matter junctions in the anterior temporal, frontal, and parietal lobes.3
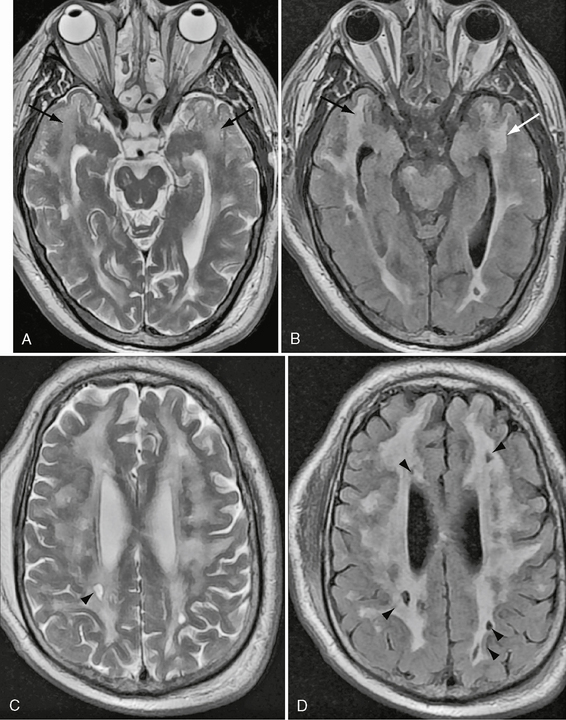
FIGURE 21-1 Axial T2W and FLAIR images at the level of temporal poles (A, B) and corona radiata (C, D) in a 63-year-old man with CADASIL. There is widespread T2 signal abnormality throughout the periventricular, deep, and subcortical white matter. Moderate cerebral volume loss is present. Notable is the extensive temporal pole involvement (arrows) and subcortical lacunar lesions (arrowheads). No microhemorrhages were present.
The lesions of CADASIL show typical temporal evolution.4 The T2 hyperintensity has a predilection for the subcortical white matter of the temporal pole in the third decade, with progressive extension to involve the internal/external capsules, posterior temporal, frontal, and parietal lobe white matter, basal ganglia, and thalamus by the fourth decade. Callosal or infratentorial involvement is rare.5 Increasing confluence of periventricular and subcortical white matter signal abnormality continues in the fourth decade. Although all patients manifested signal change within the temporal pole in one study,4 another study found that one third of patients in the third decade had no signal abnormality in this location.5 Lacunar infarcts are present in 75% of patients in the fourth decade, increasing to 94% in the fifth decade. Subcortical perivascular spaces are seen in the fourth decade, increasing to 56% in the fifth decade. Microbleeds are present in 20% of patients in the fifth decade. By the sixth decade all patients show these features. Recently, white matter scores, diffusion tensor imaging (DTI) histograms, and T1-weighted (T1W) lesion volumes have been correlated with clinical measures.1,5,6 Cerebral angiography carries increased risk of neurologic complications in patients with CADASIL (32% transient and 11% permanent).7 These complications are attributed to a combination of vessel wall abnormality and possible functional alterations.7 The imaging differential diagnosis of CADASIL includes small vessel ischemia (despite the absence of risk factors), primary and secondary vasculitis, leukodystrophy, Fabry’s disease, and mitochondrial disorders. The predominance of temporal pole disease and paucity of callosal involvement help to distinguish CADASIL from multiple sclerosis.
FABRY’S DISEASE
Clinical Presentation
Fabry’s disease is reported to account for 4% of strokes in patients younger than 55 years of age.8 Clinical features include corneal inclusions and cataracts, acroparesthesia, and neuropathic pain. Mortality is secondary to cardiac, renal, or cerebrovascular complications. There is no definite evidence that enzyme replacement therapy benefits patients with cerebral infarcts, but cerebral perfusion and renal function are improved with a reduction in glycosphingolipid deposition. Vasculopathy manifests as dolichoectasia and small vessel ischemic change. Large vessel infarcts are uncommon but may be increased with vertebrobasilar dolichoectasia. Infarcts are distributed within the territory of the posterior circulation in two thirds of patients. Cardioembolic infarcts are secondary to premature cardiac infarcts, valvular thickening, and arrhythmias. Parenchymal and subarachnoid hemorrhage is described. The ischemic infarcts are frequently asymptomatic.
Pathology
Lipid staining is found within central autonomic nuclei, including brain stem and dorsal motor nuclei, sensory neurons of dorsal root ganglia, and autonomic ganglia. The choroid plexus, leptomeninges, hypothalamic nuclei, entorhinal cortex, amygdala, and nucleus of the median eminence are particularly affected. Small and medium-sized vessels are thickened with luminal narrowing. Large vessel dolichoectasia is hypothesized to be secondary to reduction in extracellular matrix proteins, collagen, elastin, glycosaminoglycans, and proteoglycans.9
Imaging
MRI
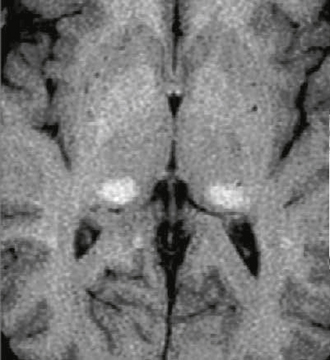
White matter hypodensity on CT corresponds to nonspecific T2 hyperintensity within periventricular white matter, deep white matter, and gray matter on MRI. Although white matter abnormality is increasingly frequent with increasing age, it has also been described in affected children. Two recent studies comprising approximately 100 patients reported lateral pulvinar T1 hyperintensity with increasing frequency over the age of 30 years (23%-70%).10 The etiology of this finding was speculative and frequently associated with calcification on CT in the larger study. There was no signal alteration on fat saturation to suggest lipid deposition. T2 was reported as reduced in one study and normal in the other. Susceptibility-weighted imaging demonstrated proportional loss of signal depending on the extent of mineralization on CT. Milder cases were not associated with any T2* signal abnormality, eliminating blood products as a cause for T1 shortening. Increased posterior fossa perfusion was shown in one study. The authors concluded that increased perfusion may induce dystrophic calcification with selective vulnerability of the pulvinar. Both authors suggested that the lateral pulvinar T1 hyperintensity may be a specific sign for Fabry’s disease (Fig. 21-2). Diffusion-weighted imaging (DWI) and DTI demonstrate changes that may not be apparent on conventional imaging. Increased white matter diffusion without differences in fractional anisotropy is described.11 The basilar artery diameter is previously described as the best discriminator between patients with Fabry’s disease and age-matched controls. This measurement has been suggested as a means of early detection and monitoring of brain involvement in Fabry’s disease. This measurement was superior to white matter lesion load and white matter diffusivity assessed by diffusion tensor imaging.11a
MOYAMOYA
Epidemiology
Moyamoya can occur in both children and adults. The majority of cases present before the age of 20 years (70%) and half occur before the age of 10 years.12 Children present with stroke symptoms and progressive neurologic impairment. Adults tend to present with parenchymal, intraventricular, or, less commonly, subarachnoid hemorrhage.13 Females are affected twice as often as males. Familial inheritance occurs in approximately 10% of cases. Related chromosomal defects include 17q25, 12p, and 3p24.2-p26. Numerous genetic disorders are associated, including Down syndrome, sickle cell disease, tuberous sclerosis, glycogen storage disease type 1a, neurofibromatosis type 1, progeria, hereditary spherocytosis, and morning glory syndrome. Skull base, pituitary, or suprasellar tumors are causative either idiopathically or secondary to radiation treatment. Infectious causes include basal meningitis, particularly tuberculosis, leptospirosis, and complicated tonsillitis or otitis media. Vasculitis-induced vessel occlusions may be secondary to systemic lupus erythematosus, anticardiolipin syndrome, neuro-Behçet’s syndrome, polyarteritis nodosa, collagen vascular diseases, Kawasaki disease, and factor V Leiden. There is increased association of moyamoya with aneurysms, arteriovenous malformations, fenestrations, and congenital heart disease.
Pathophysiology
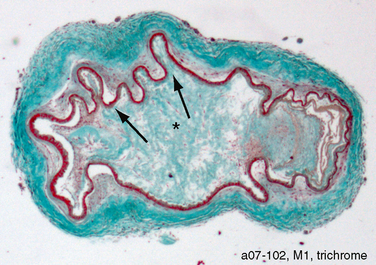
Arterial stenosis and occlusion is seen as a result of fibrocellular concentric intimal thickening with a dense array of smooth muscle cells, multilayered elastic lamina, and few lipid deposits. Folds are seen in the internal elastic lamina. The external diameter of the vessel shrinks, and there is thinning of the media (Fig. 21-3).14–16
Imaging
CT
Atrophy and infarcts occur in the distribution of the anterior circulation. Noncontrast CT shows acute intraparenchymal and subarachnoid hemorrhage. Dilated lenticulostriate and thalamoperforate collaterals appear as punctate and linear contrast enhancement within the basal ganglia (Fig. 21-4). CTA confirms these findings and assesses the severity of any stenoses of the distal internal carotid arteries (ICAs), proximal middle cerebral arteries (MCAs), and proximal anterior cerebral arteries (ACAs) (Fig. 21-4). Saccular aneurysms involving the basilar artery and lenticulostriate vessels are seen. CT perfusion may assist in highlighting regions at increased risk for infarction and assess the outcome of surgical treatment (see Fig. 21-4).17
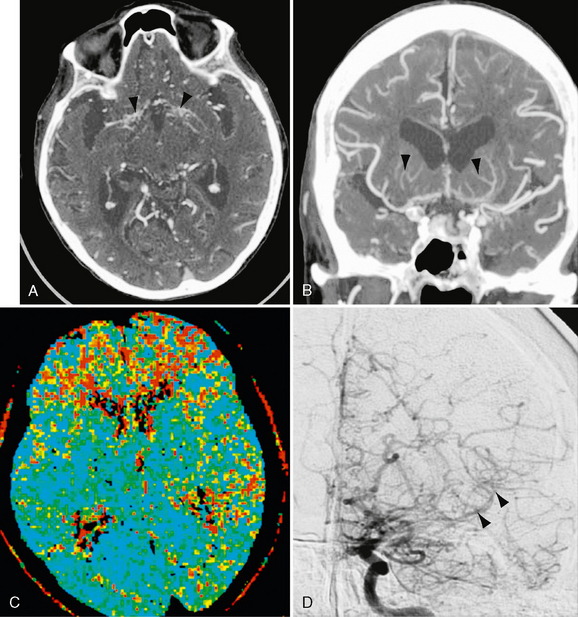
FIGURE 21-4 Patient with moyamoya disease. Axial CTA 0.625-mm reconstruction (A) and 7-mm Cor MIP (B) images demonstrate bilateral basal ganglia perforator enlargement (arrowheads) and ICA and proximal ACA and MCA occlusion. Numerous anterior cranial fossa collaterals are seen within the subarachnoid space. C, MTT CTP confirms prolongation of transit time within the bilateral frontal lobes and left MCA territory posteriorly. D, Anteroposterior DSA with left ICA selective injection confirms terminal carotid, proximal ACA, and MCA occlusion. Numerous lenticulostriate perforator and leptomeningeal collaterals are evident that showed retrograde distal left MCA filling (arrowheads).
MRI
MRI shows generalized atrophy in the distribution of anterior circulation. Prior infarcts or hemorrhage are well seen on fluid-attenuated inversion recovery (FLAIR) or gradient-recalled-echo (GRE) imaging. DWI will detect acute infarcts. Flow voids in the distal ICAs and proximal ACAs/MCAs may be absent or diminished. Flow voids are increased in the basal ganglia, consistent with dilation of the lenticulostriate collateral circulation (Fig. 21-5). These enhance after administration of gadolinium.18,19 Slow flow through enlarged pial collaterals and arachnoid thickening results in intravascular signal or enhancement coined the “ivy sign.” This is best detected with FLAIR and contrast-enhanced T1W images.20 This sign appears to correlate with reduced cerebrovascular reactivity.20a Perfusion MRI may also assist in highlighting regions at increased risk for infarction, in assessing the outcome of surgical treatment.21 It is uniquely challenging for MR-based methods. Quantitative mapping of cerebral blood flow, cerebral blood volume, and mean transit time (MTT) requires temporal knowledge of the input concentration of the administered contrast agent or tracer for each of the major vascular territories. These concentration time curves are usually measured empirically by positioning a region of interest over the major vessel input to a vascular territory. This information is then compared with the concentration time curves derived from the microcirculation in the tissue fed by this vessel, and a quantitative flow map for the whole brain is generated. Unfortunately, it is not accurate to apply the concentration time curve from a diseased input vessel to the microcirculation fed by an entirely different diseased input vessel. The flow map will be accurate for the territory supplied by the vessel in which the input function was measured, but not for those tissues fed by other vessels. Positron emission tomography (PET) avoids this problem because arterial sampling of the tracer concentration over time is performed, providing knowledge of the arterial input to all brain vessels. Single photon emission CT (SPECT) is also somewhat immune to this problem because single pass tracers are used, but the information is weighted toward tracer delivery/deposition. The resulting perfusion map is proportional, but not equivalent, to blood flow.
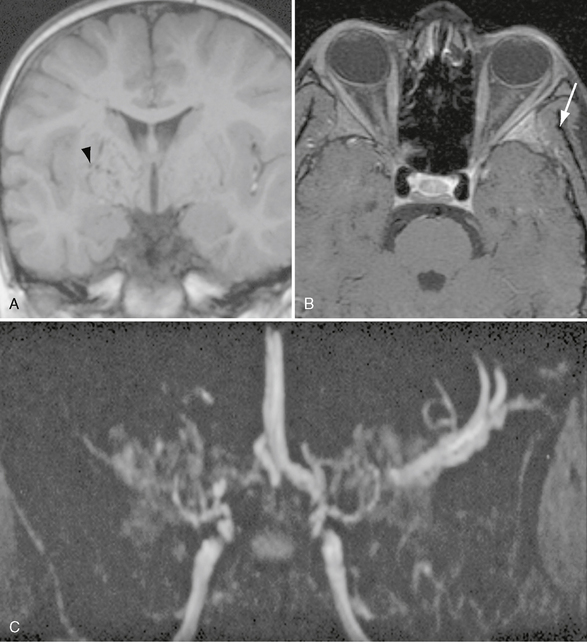
FIGURE 21-5 Coronal T1W (A), fat-saturated T1W postcontrast (B), and TOF MRA MIP (C) images demonstrating multiple flow voids within the basal ganglia that are greater on the right (arrowhead). Bilateral terminal carotid and right MCA occlusion with collateral enlargement producing the characteristic “puff of smoke” appearance. There is enhancement within the left greater wing of the sphenoid consistent with bone infarction (arrow).
It can be argued that measurement of cerebrovascular reactivity (CVR), which is defined as a change in blood flow per unit change in stimulus such as carbon dioxide, is a more accurate indicator of the physiologic impact of vascular stenosis. Because the brain can locally control perfusion through arteriolar vascular tone, flow compensation is possible in the setting of vascular stenosis. Relaxation of vascular tone can lead to normalization of blood flow. Conventional CBF maps can therefore be normal, although CBV and MTT maps usually show increases. However, the use of PET, CT, DSC MRI, and SPECT for this purpose is cumbersome because two measurement sessions, one with baseline and one with post-stimulus (CO2 or acetazolmide) acquisitions are necessary. Furthermore, DSCE MRI and CT suffer from the input function problem, especially in those patients with multiple-vessel disease.
A technique has been developed using blood oxygenation level dependent contrast (BOLD) MRI that circumvents all of these issues.22,23 This technique is quantitative, is input function independent, and clearly outlines tissues, not only where CVR is exhausted but also where there is “paradoxical” reactivity, that is, vascular steal. It can be performed on all MRI systems with echoplanar capability using a 12-minute acquisition at 1.5 T and a 6-minute acquisition at 3 T. The only requirement is the need to precisely cycle end-tidal CO2 between periods of normocapnia and hypercapnia during the MR acquisition. It has been determined that the BOLD signal normally increases during hypercapnia owing to washout of deoxyhemoglobin. In tissues with complete relaxation of vascular tone due to proximal stenosis, the BOLD signal decreases because of shift of blood flow toward tissue still capable of lowering its vascular resistance in response to CO2. This vascular steal phenomenon is an extreme physiologic condition but is easily mapped as the BOLD signal becomes negative relative to the baseline. BOLD CVR is especially well suited for mapping patients with moyamoya because they have complex multiple-vessel compromise and are quite difficult to assess using conventional blood flow imaging techniques (Fig. 21-6). Extracranial-intracranial bypass has been shown to reverse preprocedural CVR defects in Moyamoya patients.23a
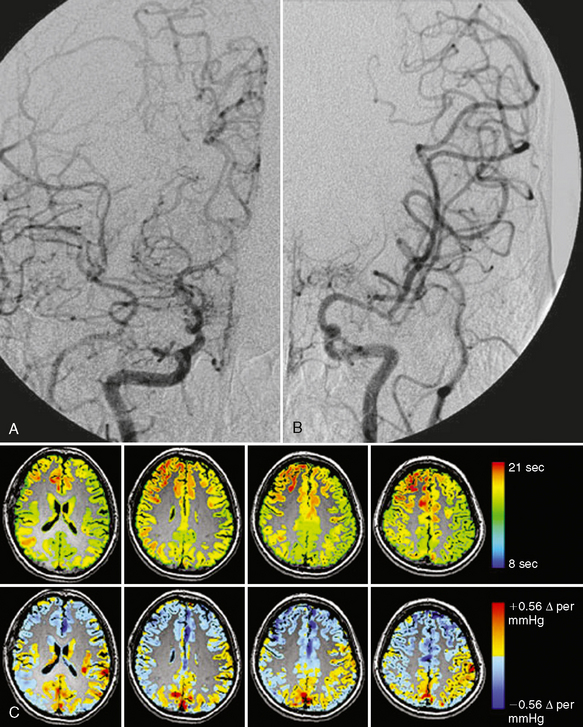
FIGURE 21-6 A, Angiogram in a patient with moyamoya disease shows severe narrowing of the proximal right ACA and MCA vessels at the bifurcation of the internal carotid artery. B, The left ACA does not fill and there is stenosis of the left MCA. C, The images in the top row are from a dynamic gadolinium bolus perfusion study in this patient. Because selection of a vessel for placement of a region of interest to measure flow was ambiguous, an input function independent time to bolus peak was generated from the gadolinium bolus (scale is in seconds). The lower row shows CVR data (scale shows the percentage of BOLD signal change per mm Hg of end-tidal CO2). Blue shows decreased BOLD signal with increases in end-tidal CO2 indicating a paradoxical effect (i.e., steal phenomenon). Note the precision in mapping the territory of the steal, indicating maximum impairment in flow physiology not as clearly outlined by the time to peak map.
(Courtesy of Dr. David Mikulis.)
Special Procedures
Angiography demonstrates narrowing of the distal ICAs and the proximal MCAs and ACAs. Prominent lenticulostriate and thalamoperforate collaterals give rise to a vascular blush designated the “puff of smoke” (moyamoya) (Fig. 21-4).24 In late stages, transdural and transosseous extraconal/intraconal collaterals will be seen.24,25 Similar findings can be visualized on both MRI26 and CTA. Dilation and abnormal branching of the anterior choroidal and posterior communicating arteries have been shown to be strong predictors of hemorrhagic events in adults with moyamoya.27
SPECT imaging, like perfusion MRI, can demonstrate regions at risk for infarction as well as monitor the benefits of treatment.28
VASCULITIS
Vasculitis is an umbrella term that includes multiple different diseases with the common feature of vessel stenosis. So defined, vasculitis is responsible for up to 5% of strokes in young patients and remains an elusive diagnosis. The demographic distribution, pathology, and presentation are heterogeneous depending on the etiology and will be dealt with under each vasculitis subtype. Vasculitis is classified as primary vasculitis when it is confined to the central or peripheral nervous system (Fig. 21-7). It is classified as secondary vasculitis when the nervous system is affected as one aspect of a primary systemic vasculitis or of systemic disorders associated with inflammatory vasculopathy such as infection and collagen vascular disorders (Fig. 21-8). Secondary vasculitis may itself be subclassified as primary systemic vasculitis when no preceding or accompanying disease is present and as secondary when it is associated with other disease processes. However, no accepted classification or diagnostic criteria exist.29,30 Some of the primary systemic vasculitides are even known to be associated with infectious agents. Some of the more common causes of vasculitis are listed in Table 21-1.
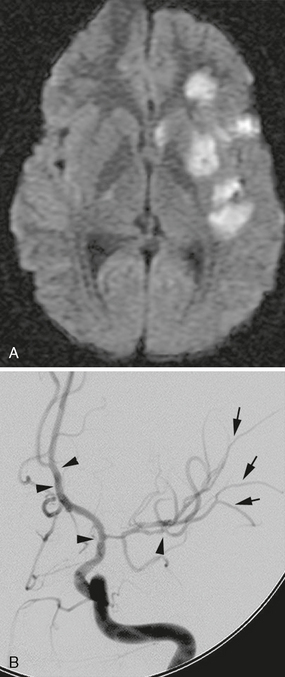
FIGURE 21-7 A, DWI demonstrates multiple basal ganglia and subinsular and cortical regions of restriction consistent with acute infarct. B, Multiple regions of stenosis are present on DSA. Beaded appearance is present within terminal ICA, proximal ACA, and distal M2 (arrowheads). Fine alterations in caliber are present within the M3 branches (arrows).
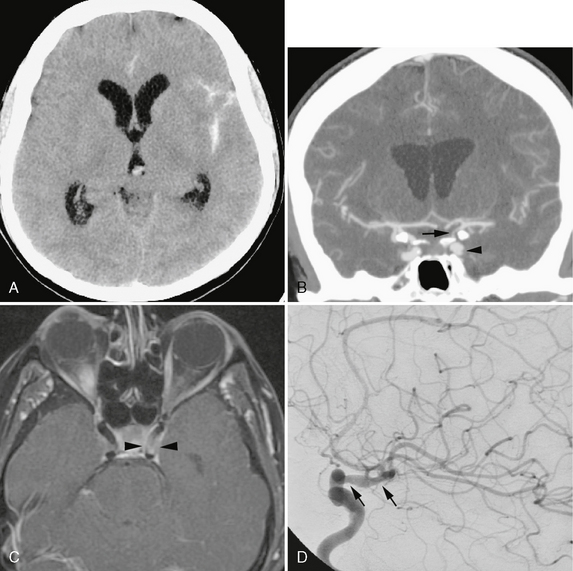
FIGURE 21-8 A 65-year-old woman with an idiopathic rheumatologic condition, elevated antinuclear antigen, and prior skin biopsy showing subacute lupus presented with acute subarachnoid hemorrhage on noncontrast CT (A). B, Coronal 7-mm MIP CTA demonstrated 90% supraclinoid ICA stenosis (arrow). Circumferential filling defects were seen within the first genu of the cavernous ICA (arrowhead). C, High-resolution postcontrast T1W MR image through the cavernous region demonstrates wall thickening and enhancement suggesting vasculopathy (arrowheads). D, DSA revealed alternating narrowing and dilatation of the supraclinoid carotid (arrows). She subsequently developed a palpable purpuric rash in the left leg that was sampled. A leukocytoclastic vasculitis was diagnosed but no specific cause was found.
TABLE 21-1 Types of Vasculitis
Primary Vasculitis
Clinical Presentation
The clinical presentation is heterogeneous. Early biopsy-proven cases were reported to have a male predilection and be uniformly fatal. Subsequently, increasing numbers of cases have been diagnosed solely on the basis of digital subtraction angiography (DSA). These cases have demonstrated important differences from the biopsy-proven cases. They appeared to have a female predilection, present with headache and focal signs rather than progressive encephalopathy, have a benign CSF profile, and carry a better prognosis. The term benign angiopathy (BACNS) was coined to identify this subgroup.31 It appears there is a spectrum of disease severity under the banner of PACNS.
Pathology
Histopathologically there is focal and segmental inflammatory infiltrate of giant cells, plasma cells, and lymphocytes accompanied by vessel wall necrosis with or without perivascular parenchymal granuloma formation, myelin loss, and axonal degeneration. The heterogeneity of disease distribution accounts for negative brain or meningeal biopsy in about 25% of patients.
Imaging
CT
The imaging features of vasculitis are nonspecific. The diagnostic sensitivity of CT is lower than that of MRI. CT may be normal or demonstrate focal hemorrhage or low density ischemic lesions.32 Medium and large vessel changes are described under Special Procedures (see later). CTA is able to consistently identify cortical arterial branches with significant stenoses. Interpretation, however, remains limited by a 0.5-mm spatial resolution that is below the threshold for detecting small vessel vasculitides.
MRI
MRI is the modality of choice for assessing brain parenchymal change, but MRI does not have the spatial resolution to detect small vessel abnormalities. MRI-negative studies are described in patients with angiographically proven disease, but the majority of these MR studies did not use FLAIR or DWI,33,34 which accounts for the varying reported sensitivity of 50% to 100%. In comparison, the sensitivity of CSF analysis is 50% to 90%. The specificity of both tests, however, is low (∼36%). We and other authors reported MRI abnormalities in all patients with vasculitis, including some with normal initial angiography.35–37 Current MRA techniques may show large intracranial vessel stenosis but do not show smaller stenoses consistently. Abnormalities include bilateral, multiple, supratentorial white matter T2-weighted (T2W) hyperintensities, although basal ganglia and cortical lesions also occur (see Fig. 21-7). Infratentorial disease is uncommon in the absence of supratentorial involvement. Contrast enhancement of the lesions, meninges, and perivascular spaces is also described. Mass lesions may be seen in 15% of patients. Parenchymal hemorrhage and subarachnoid hemorrhage are uncommon (see Fig. 21-8) and occur in 10% of patients. DWI may facilitate the identification of new lesions against a background of white matter hyperintensities, and FLAIR might help detect cortical or periventricular lesions. A negative CSF and negative MRI are strong negative predictors of CNS vasculitis.38 High resolution imaging of the vessel wall is an emerging technique aimed at characterizing disease processes involving the intracranial circulation. This technique uses optimized T1 black blood precontrast and postcontrast to evaluate for the presence and pattern of enhancement. Although limited experience is available with this technique, early data suggest that the enhancement pattern may differentiate between vasculitis, atherosclerosis, and intracranial dissections.38a,38b
Special Procedures
In patients with PACNS, conventional angiography demonstrates abnormality in about 83% of cases. Yet, clinically, it is most common for clinically suspected arteritis to be negative even on angiography (40%-60%). Biopsy remains the reference standard for diagnosis and is frequently positive in the presence of negative vascular imaging. The classic findings of segmental narrowing and dilatation or beaded appearance may be seen in 20% to 65% of patients (see Fig. 21-7). Rarely, small presumed vasculitic aneurysms are present. The angiography may appear normal in up to 20% to 40% of cases, because the small vessels affected fall below the spatial resolution of the technique.39 The current spatial resolution of MRA and CTA also precludes assessment of small vessel changes less than 500 μm. However, medium-sized vessel involvement is within the spatial resolution of these modalities. Our experience in children shows that whereas MRA detected fewer lesions than did conventional angiography, the diagnosis is unaltered because of the multiplicity of lesions. The ability of MRA to accurately quantify the degree of stenosis is important because angiographic features are used to assess the response to treatment. Our and others’ experience show 78% to 100% sensitivity for stenosis greater than 50%.40,41
Stay updated, free articles. Join our Telegram channel

Full access? Get Clinical Tree


