Fig. 1
Three consecutive axial (a–c) and coronal (d–f) CT images are shown in a nonotospongiotic ear to insist on the careful inspection of the dense appearance of the normal bone in many regions. It is very important to systematically inspect the region of the fissula ante fenestram on the axial image set, situated just anterior to the oval window and anterior stapes crus, in order to be sure that fenestral otosclerosis is excluded (small arrows on images a–c). The same region can be inspected on the coronal images too (small arrows on images d–f). An intensely high density must be present in the otic capsule region surrounding the cochlea, in order to be sure that cochlear otosclerosis is excluded (large arrows on images a–f)
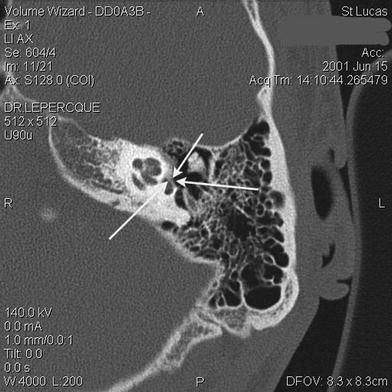
Fig. 2
The axial CT image at oval window level shows a hypodense region of otosclerotic origin in the footplate itself, and anterior to the oval window (arrows). Note that the footplate is thickened
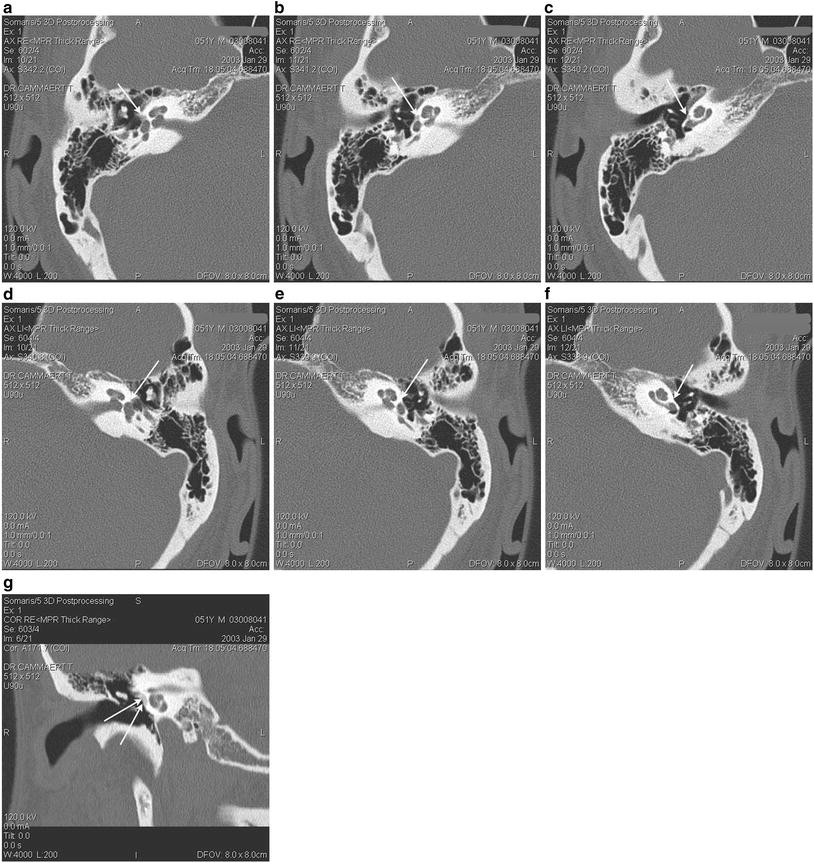
Fig. 3
In the right ear three consecutive CT images (a–c) show a lucent area just anterior to and extending to the oval window: fenestral otosclerosis (arrow). In the same patient, the normal contralateral ear is shown. Note the normal high density anterior to the footplate (d–f). In this same patient, a coronal reconstruction (g) obviously depicts the otospongiotic focus in the region of the promontory (arrows)
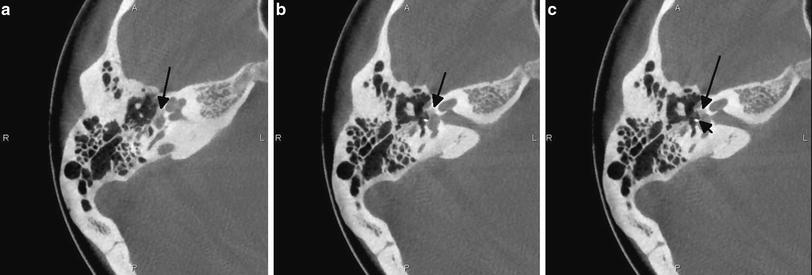
Fig. 4
On these axial CBCT images (a–c) of the right middle ear, a hypodense focus of otosclerosis is nicely depicted in the region just anterior to the oval window (large arrow). The patient is treated with a stapes prosthesis (small arrow)
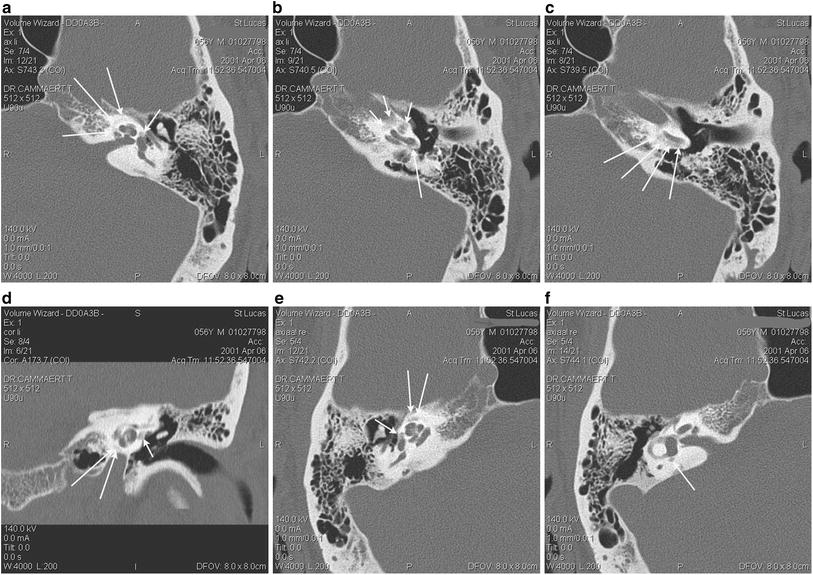
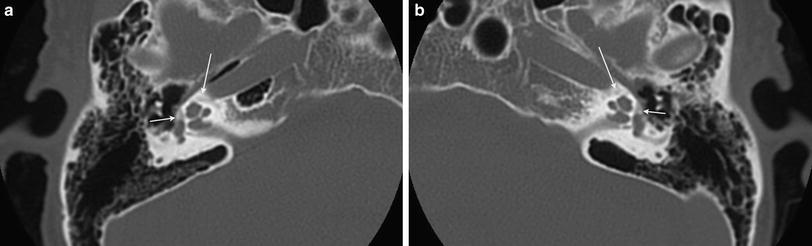
Fig. 5
Multiple CT images are shown from a patient with bilateral fenestral and retrofenestral otosclerosis. On the most cranial axial image on the left side (a) lucencies of otosclerotic origin are seen around the cochlea (large arrows) and anterior to the oval window (small arrow). On the image below (b) cochlear otosclerosis is seen medial to the apical and middle cochlear turns (small arrows), but also around the basal cochlear turn, and in the round window region (large arrows). On the slice more caudally (c) more otosclerotic foci are obviously present around the basal turn of the cochlea. The coronal image from the same left ear confirms the presence of fenestral (small arrow) and retrofenestral (large arrows) foci of otosclerosis (d). In the contralateral right ear, the axial image performed at footplate level (e) shows more otosclerotic lucencies at the fissula ante fenestram (small arrow) and in the pericochlear otic capsule (large arrows). On the slice performed 2 mm more caudally (f) otosclerosis is seen posterior to the vestibule (arrow)
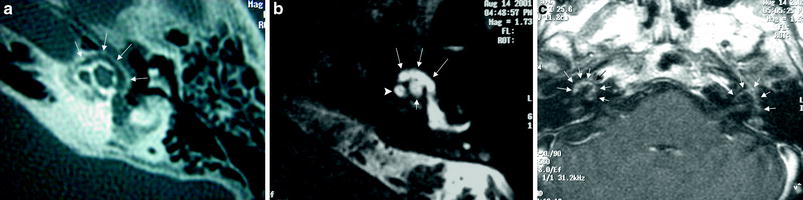
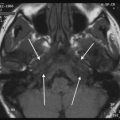
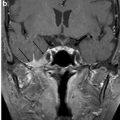
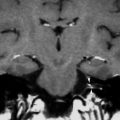
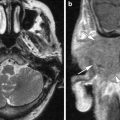
Fig. 6
The axial CT image at the level of the middle and apical turns of the left cochlea (a) shows otosclerotic changes around the cochlea: the so-called fourth ring of Valvassori is seen (arrows). The axial 3D FSE T2-weighted image at the same level (b) again demonstrates the fourth ring of Valvassori (large arrows), now seen as a semicircular hyperintensity around the middle (arrowhead) and apical (small arrow) turns of the cochlea. On the axial contrast-enhanced T1-weighted image through both inner ears (c) diffuse semicircular enhancement is noted around the cochlea bilaterally: the diagnosis of bilateral severe retrofenestral otosclerosis in the active phase can be made (Courtesy by Dr. B. Defoer, Antwerp, Belgium)
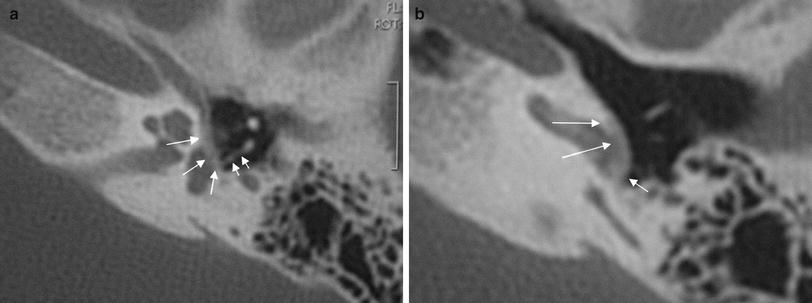
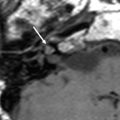
Fig. 7
The axial CT image at the level of the oval window (a) shows an otosclerosis focus at the fissula ante fenestram extending over the oval window, and with diffuse and severe thickening of the footplate (large arrows). Note the postoperative status with stapedectomie and replacement by a piston, posteriorly displaced (small arrows). The axial CT image at the level of the basal cochlear turn and round window (b) demonstrates the extension of the otosclerotic changes over the promontory toward the round window niche (large arrows). There is extension of the otosclerotic changes to the round window with total obliteration of the access to the round window (small arrow), thus making a later cochlear implantation virtually impossible (Courtesy by Dr. B. Defoer, Antwerp, Belgium)
MRI is sporadically used in case of otosclerosis. Otosclerosis very often leads to severe hearing loss in a chronic progressive manner. Initially an otospongiotic phase takes place and causes an inflammatory osteolytic process in the otic capsule. During this ‘active’ phase, the otospongiotic foci will enhance on T1-weighted SE MRI images performed after IV injection of gadolinium (Ziyeh et al. 1997; Stimmer et al. 2002). On the T1-weighted images before gadolinium injection, a ring of intermediate signal can be present in the pericochlear and perilabyrinthine regions, and an increased signal may also be seen on the T2-weighted images (Goh et al. 2002) (Fig. 6). MRI has also proven its usefulness in the investigation of complications of stapes surgery performed for otosclerosis. Some of these complications, such as reparative intravestibular granuloma formation, intralabyrinthine hemorrhage, and bacterial labyrinthitis are detectable with MRI, while they pass unrecognized on CT/CBCT examinations (Rangheard et al. 2001).
3 Differential Diagnosis
Osteogenesis imperfecta is a rare disease and is often associated with hearing loss. It is an inherited generalized disorder of type-I collagen synthesis (Zajtchuk and Lindsay 1975; Berghstrom 1981; Berger et al. 1985; Schuknecht 1993b). The classic triad of blue sclerae, spontaneous fractures, and hearing loss is known as the Van der Hoeve and De Kleyn syndrome (Schuknecht 1993b; Czerny and Temmel 1999). The CT/CBCT appearance can be undistinguishable from otosclerosis, with lucent bone anterior to the oval window and in the pericochlear otic capsule (Fig. 8). On MRI similar findings have been described as those seen in the active phase of otosclerosis: pericochlear soft tissue signal intensities and enhancement after contrast injection (Ziyeh et al. 2000).