Pediatric Applications of Perfusion Ultrasound
Karl Muchantef, MD
Thomas Scholbach, Dr. med. habil
Ricardo Faingold, MD
▪ Introduction
Knowledge of blood flow and tissue perfusion can influence clinical decisions and patient management in a gamut of disease processes. Many diseases are associated with perfusion changes, such as inflammatory processes, organ failure, transplant rejection, arterial stenosis, tumor growth and necrosis, hypoperfusion, and ischemia. The Doppler shift of ultrasound (US) frequency can be used to depict blood flow velocity and to quantify it. US and Doppler techniques are currently very popular and have many advantages over other modalities with potential in perfusion mapping: computed tomography (radiation exposure), magnetic resonance imaging (cost, availability, length of exam, sedation in young children), and nuclear medicine (limited morphologic information, radiation).
Several publications using color Doppler sonography (CDS) assessed quantification of tissue perfusion by counting color Doppler signals in still images.1,2 and 3 There are also reports on the use of quantitative Doppler signal analysis with and without contrastenhancing agents.4,5,6,7,8 and 9 Despite such developments, it is not a simple task to obtain blood flow and tissue perfusion data in a reliable, noninvasive, inexpensive, and radiation-free manner. This chapter discusses the most currently used Doppler techniques (color Doppler, power Doppler, pulsed Doppler, and contrast-enhanced US) and also the potential of perfusion quantification with dynamic CDS or dynamic tissue perfusion measurement (DTPM) in children. Spectral Doppler velocity measurements and resistive index (RI) are still the basis of many scientific medical investigations of perfusion, despite offering a limited representation of actual tissue perfusion, as detailed below.
▪ Color and Power Doppler
Color Doppler uses red and blue shades to depict blood flow toward or away from the transducer (according to equipment settings), with differing shades representing differing velocities of motion. The color hue assigned to a pixel results from the angle-dependent Doppler frequency shift returning from that pixel. By convention, higher velocities of blood flow are assigned a brighter color hue. The measured US frequency shift is displayed as an array of colors within a gray-scale image, depicting the local velocity of blood flow. Color Doppler hence provides an image with tissue morphology depicted in gray scale and blood flow depicted by color.10,11 Power Doppler imaging depicts the strength of the Doppler-shifted signal rather than the frequency shift of that signal. That is to say, the color hue depicted relates mainly to the volume of moving blood, rather than the velocity and direction of the flow. Directional information is lost in power Doppler imaging; its advantage is increased sensitivity to low flow as compared to color Doppler.11
▪ Spectral Doppler
In the case of spectral Doppler imaging, a time velocity tracing depicts variations in blood flow velocity at a point within a vessel during the cardiac cycle. Spectral Doppler analysis has gained tremendous popularity and found many clinical applications. Using the spectral tracing, the RI may be calculated from the equation:
where PSV is the peak systolic velocity, and EDV is the end-diastolic velocity. This ratio describes the relative degree of velocity drop during a complete heart cycle. The RI calculation is independent of the angle of insonation; the RI expresses the ratio of two velocities, both identically affected by the Doppler angle.
The RI is sometimes interpreted as a parameter of blood flow itself. It is often assumed that a high RI signifies a low perfusion state and an increasing RI indicates decreasing perfusion; however, this is not necessarily the case.12 RI relies upon only two velocity measurements (PSV and EDV) obtained at a single point in a single vessel. As a surrogate measure of tissue perfusion, RI measurements disregard a crucial point: tissue viability depends not only on the pulsatility of blood flow or the resistance against it but also on blood flow volumes (Table 35.1).
▪ Contrast-Enhanced Ultrasound
Microbubble-based intravenous contrast agents are not routinely used in pediatric imaging in North America. Intravenously injected microbubbles enhance US backscatter by producing harmonic frequencies that are multiples of the transmitted frequency and therefore increase the US signal from flowing blood, particularly in the arterial system and microvasculature.10 Level of saturation and velocity to reach the level of saturation are obtained with dedicated software. Contrast-enhanced ultrasound (CEUS) has many clinical applications,13,14 and 15 some of which are discussed later (Table 35.2).
TABLE 35.1 Resistive Index | |||||||
|---|---|---|---|---|---|---|---|
|
Dynamic Tissue Perfusion Measurement
A software-based DTPM technique is capable of extracting dynamic (changing with heart cycle) flow data of perfusion signals from color Doppler sonographic videos. Perfused area and actual local perfusion velocity within an arbitrarily chosen region of interest (ROI) are extracted automatically by software from a sonographic video (PixelFlux, Chameleon-Software, Leipzig, Germany).16 No ECG gating is required, and the software recognizes the variation of flow and is able to stablish the cardiac cycle based on a pattern.
The guiding idea behind DTPM is to quantify tissue perfusion by referring to all relevant parameters that influence the total amount of blood passing through a tissue section during a complete heart cycle. These are the mean perfusion velocity of all vessels and the mean perfused area of the tissue section under investigation. Both are directly proportional to the amount of transported blood. Both do also change significantly during one complete cardiac cycle. It is therefore necessary to start with the measurement of these two basic parameters at the beginning of a heartbeat and to continue in as short time intervals as possible to the end of the heartbeat. This is important because significant differences between momentary systolic and diastolic perfusion may exist even in tiny vessels.
From these data, a mean perfusion velocity, as well as a mean perfused area, are calculated thus referring all measurement to the very basic rhythm of perfusion—one complete heart cycle. By multiplication of these mean values—mean perfused area and mean perfusion velocity—mean perfusion intensity is calculated. Mean perfusion intensity thus also refers to the area of the tissue section that is captured by the ROI of the current investigation: mean velocity (v) of all pixels is multiplied by the area (A) of all colored pixels contained with the ROI and divided by the total area of the ROI (colored pixels plus gray-scale area of nonperfused tissue). Thereby, the mean flow intensity value of the ROI (I) is calculated.
TABLE 35.2 Contrast-Enhanced Ultrasound | |||||||
|---|---|---|---|---|---|---|---|
|
Following this algorithm, a dynamic (with respect to the everchanging values during a full heart cycle) mean perfusion intensity can be calculated of a tissue section in a freehand or geometrically standardized ROI (Fig. 35-1).
As with any measurement, a crucial point is standardization— in DTPM, it is the presetting of the US equipment. Color Doppler frequency as well as gain have to be kept constant for comparable investigations. Color flow velocity settings may be changed to avoid aliasing if necessary. The software recognizes the change of color scale values automatically (Table 35.3).
Practical Issues Regarding DTPM
Spectral Doppler, color Doppler, and power Doppler sonography are often used to assess blood flow and provide an estimate of organ perfusion. Quantitative evaluation of blood flow with CDS using pixel count per square centimeter has been described in assessment of bowel perfusion.1,2 There are also reports on the use of quantitative Doppler signal analysis with and without contrast-enhancing agents.5,6,7,8 and 9 However, it may be time-consuming and difficult to reproduce in the clinical and research settings. Evaluation of Doppler spectral waveform is helpful in determining the characteristics of blood flow patterns, which are affected by the metabolic status of the organ supplied by that vessel, hemodynamic status, and age of the patient.17 DTPM offers a standardized, quantitative assessment of tissue perfusion within a definable ROI. Data are extracted over the cardiac cycle and flow parameters obtained.
▪ Applications of Doppler US and DTPM
To demonstrate the broad applicability of Doppler US and DTPM, some examples of clinical applications are given below in infants, children, and adolescents.
Infants
Assessment of blood flow and organ perfusion in infants has been traditionally done by spectral Doppler and sometimes by CDS.2,17,18 Recent use of CDS with tissue perfusion quantification has shown that this technique is promising and with great potential as a noninvasive tool in the research setting and clinical practice.19,20
Kidneys
The use of RI is well established in the evaluation of the kidneys. It is well known that RI of renal arteries varies in the first 12 months of life. They are usually measured in the arcuate or interlobar arteries. In term infants, the RI ranges from 0.6 to 0.8, although in premature babies, RI may reach 0.9 in the renal arteries. The hemodynamic status and the structural and functional immaturity of the kidneys in neonates are responsible for these changes.17
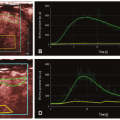
Acute kidney injury (AKI) has been associated with perinatal asphyxia, hypotension, or cardiac failure. It may develop with or without changes in creatinine levels or urine output. Decreased blood flow velocity in the renal arteries with pulsed Doppler imaging has been described in severe hypoxic-ischemic injury (HII).3 CDS evaluation of renal parenchyma20 appears to be a useful tool for quantification of renal perfusion in AKI (Fig. 35-2).
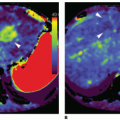
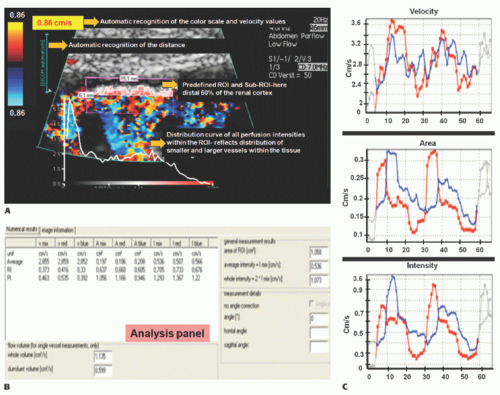 Figure 35-1. Tissue perfusion of the renal cortex. A: A standardized region of interest (ROI) is defined with a sub-ROI defining the distal 50% of the cortex. Each ROI contains colored pixels and nonperfused tissue. Numerical description of vessel distribution according to their perfusion intensities with associated distribution curve is included (white curve). B: Tables of dynamic tissue perfusion measurement (DTPM) results are shown in analysis panel and in (C). Time course diagrams of relevant perfusion parameters (graphs). |
Bowel
US Doppler interrogation of the gastrointestinal tract is useful for assessment of superior mesenteric artery (SMA) Doppler waveform and intestinal perfusion. The flow pattern in the SMA is of high resistance in the fasting state and becomes of low resistance with loss of reversal of diastolic flow in the postprandial state.17 In normal fasting neonates, bowel wall perfusion usually ranges from one to nine color Doppler signals per centimeter square (mean = 3.78, standard error of mean = 0.20).2
TABLE 35.3 Tissue Perfusion Measurement | |||||||
|---|---|---|---|---|---|---|---|
|
Necrotizing Enterocolitis
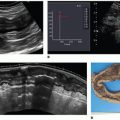
Intestinal mural perfusion can be assessed directly, in real time at the bedside, with CDS. In 2005, the use of color Doppler was described to assess bowel wall perfusion in necrotizing enterocolitis (NEC).2 In neonates with NEC, color Doppler US revealed three types of flow in the bowel wall: normal, increased, and absent. Normal CDS flow corresponded to the values obtained in control infants. CDS flow was considered increased when certain types of hyperemic flow pattern were different from the normal neonates. They were described as follows: “circular” flow pattern around the bowel; a “Y” pattern of distal mesenteric and subserosal vessel; and parallel CDS lines or a “zebra” pattern due to increased flow in mucosal folds. CDS perfusion was considered absent when no mural CDS signals were demonstrated (Fig. 35-3). These nonperfused bowel loops were correlated with abdominal x-rays (AXR) and with laparotomy and
pathologic specimens. The sensitivity of CDS to detect gangrenous bowel was 100% compared to 40% for AXR.2
pathologic specimens. The sensitivity of CDS to detect gangrenous bowel was 100% compared to 40% for AXR.2
Related posts:
 Vascular Anatomy and Microanatomy
 CT and MR Contrast-Enhanced Tissue Perfusion Imaging: Basic Methodology, Postprocessing, Reliability Testing
 Clinical Applications of ASL Brain Perfusion Imaging
 Perfusion CT Imaging in Oncology
 Ultrasound Perfusion Imaging: Techniques and Analytical Methods
 Contrast-Enhanced Ultrasound: Clinical Applications
Stay updated, free articles. Join our Telegram channel

Full access? Get Clinical Tree


