(1)
Cleveland Clinic, Emeritus Staff, Cleveland, OH, USA
Keywords
Spatial resolutionSensitivityRandom countsScatter fractionQuality controlAcceptance testingIntroduction
In PET/CT and PET/MR imaging, PET images are of primary interest, whereas CT and MR images complement PET images by attenuation correction and fusion of images for better delineation of lesions. So we will discuss the performance parameters of only PET scanners. However, quality control tests for all three scanners are presented. A major goal of the PET studies is to obtain a good-quality and detailed image of an object by the PET scanner, and so it depends on how well the scanner performs in image formation. Several parameters associated with the scanner are critical to good-quality image formation, which include spatial resolution, sensitivity, noise, scattered radiations, and contrast. These parameters are interdependent, and if one parameter is improved, one or more of the others are compromised. A description of these parameters is given below.
Spatial Resolution
The spatial resolution of a PET scanner is a measure of the ability of the device to faithfully reproduce the image of an object, thus clearly depicting the variations in the distribution of radioactivity in the object. It is empirically defined as the minimum distance between two points in an image that can be detected by a scanner. A number of factors discussed below contribute to the spatial resolution of a PET scanner.
Detector size: One factor that greatly affects the spatial resolution is the intrinsic resolution of the scintillation detectors used in the PET scanner. For multidetector PET scanners, the intrinsic resolution (R i) is related to the detector size d. R i is normally given by d/2 on the scanner axis at midposition between the two detectors and by d at the face of either detector (Fig. 6.1). Thus, it is best at the center of the FOV and deteriorates toward the edge of the FOV. For a 6-mm detector, the R i value is ~3 mm at the center of the FOV and ~6 mm toward the edge of the FOV. For continuous single detectors, however, the intrinsic resolution depends on the number of photons detected, not on the size of the detector, and is determined by the full width at half maximum (FWHM) of the photopeak.
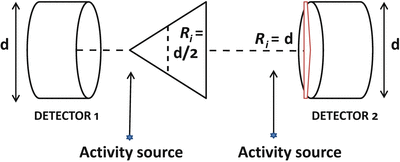

Fig. 6.1
Illustration of spatial resolution R i of a PET camera, the detector size of which is d. The R i at any position along the LOR between the two detectors is given by the full width at half maximum (FWHM) of the activity distribution profile obtained by counting a point source of activity across the detector face at the position. The R i is d/2 at the center of the FOV determined by the FWHM from a triangular profile, while it is d at the edge of the FOV (i.e., the face of the detector) indicated by the red-lined near-rectangular box
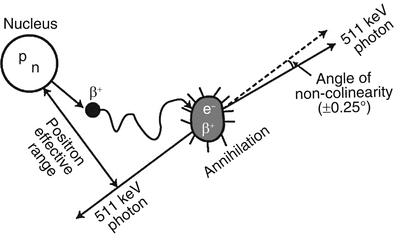
Positron range: A positron with energy travels a distance in tissue, losing most of its energy by interaction with atomic electrons and then is annihilated after capturing an electron (Fig. 6.2). Thus, the site of β + emission differs from the site of annihilation as shown in Fig. 6.2. The distance (range) traveled by the positron increases with its energy but decreases with the tissue density. Since the positrons are deflected after interaction with electrons resulting in a zigzag trajectory, the positron range is essentially an effective range, which is given by the shortest (perpendicular) distance from the emitting nucleus to the positron annihilation line. Furthermore, positrons are emitted with a distribution of energy, which also affects the effective range. The effective positron ranges in water for 18F  and 82Rb.
  are 2.2 and 15.5 mm, respectively (Table 1.2). Since coincidence detection is related to the location of annihilation and not to the location of β + emission, an error (R p) occurs in the localization of true position of the positron emission thus resulting in the degradation of spatial resolution. This contribution (R p) to the overall spatial resolution is determined from the FWHM of the positron count distribution, which turns out to be 0.2 and 2.6 mm for 18F and 82Rb, respectively (Tarantola et al. 2003).
 and 82Rb.
  are 2.2 and 15.5 mm, respectively (Table 1.2). Since coincidence detection is related to the location of annihilation and not to the location of β + emission, an error (R p) occurs in the localization of true position of the positron emission thus resulting in the degradation of spatial resolution. This contribution (R p) to the overall spatial resolution is determined from the FWHM of the positron count distribution, which turns out to be 0.2 and 2.6 mm for 18F and 82Rb, respectively (Tarantola et al. 2003).
Fig. 6.2
Positrons travel a distance before annihilation in the absorber and the distance increases with positron energy. Since positrons with different energies travel in zigzag directions, the effective range is the shortest distance between the nucleus and the direction of 511-keV photons. This effective range degrades the spatial resolution of the PET scanner (Reprinted with the permission of the Cleveland Clinic Center for Medical Art and Photography ©2009. All rights reserved)
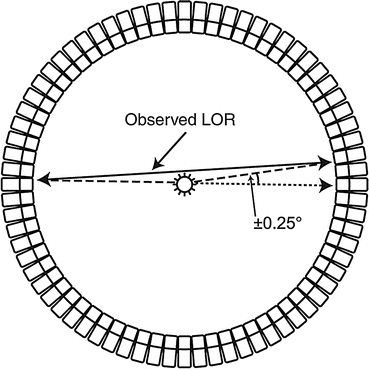
Noncolinearity: Another factor of concern is the noncolinearity that arises from the deviation of the two annihilation photons from the exact 180° position. That is, two 511-keV photons are not emitted at exactly 180° after the annihilation process (Fig. 6.3), because of some small residual momentum of the positron at the end of the positron range. The maximum deviation from the 180° direction is ±0.25° (i.e., 0.5° FWHM). Thus, the observed LOR between the two detectors does not intersect the point of annihilation, but is somewhat displaced from it, as illustrated in Fig. 6.3. This error (R a) degrades the spatial resolution of the scanner and deteriorates with the distance between the two detectors. If D is the distance in cm between the two detectors (i.e., detector ring diameter), then R a can be calculated from the point-spread function (PSF) as follows:

The contribution from noncolinearity worsens with larger diameter of the ring, and it amounts to 1.8–2 mm for currently available 80–90-cm PET scanners.

Fig. 6.3
Noncolinearity of 511-keV annihilation photons. Because there is some residual momentum associated with the positron, the two annihilation photons are not emitted exactly at 180° but at a slight deviation from 180°. Two detectors detect these photons in a straight line, which is slightly deviated from the original annihilation line. The maximum deviation is ±0.25° (Reprinted with the permission of the Cleveland Clinic Center for Medical Art and Photography ©2009. All rights reserved)

(6.1)
Reconstruction method used: Choice of filters with a selected cutoff frequency in the filtered backprojection reconstruction method may introduce additional degradation of the spatial resolution of the scanner. For example, a filter with a too high cutoff value introduces noise and thus degrades spatial resolution. An error (K r) due to the reconstruction technique is usually a factor of 1.2–1.5 depending on the method (Huesman 1977).
Localization of detector: The use of block detectors instead of single detectors causes an error (R ℓ ) in the localization of the detector by X, Y analysis and it may amount to 2.2 mm for BGO detectors (Moses and Derenzo 1993). However, it can be considerably minimized by using better light output scintillators, such as LSO.
Combining the above factors, the overall spatial resolution R t of a PET scanner is given by

In whole-body scanners, the detector elements are normally large, and therefore, R i(d or d/2) is large so that the contribution of R p is negligible for 18F-FDG  whole-body imaging. For 18F-FDG studies using a 90-cm diameter PET scanner with 6-mm detectors, R a ~ 2 mm, and assuming R p = 0, R ℓ = 2.2 mm, and K r = 1.5,
  at the center of FOV and
  at the edge of FOV of the scanner. However, the contribution of R p may be appreciable for high-energy positron emitters (e.g., 82Rb;
  ) and small-animal PET scanners (e.g., microPET system) having smaller detectors.

(6.2)
 whole-body imaging. For 18F-FDG studies using a 90-cm diameter PET scanner with 6-mm detectors, R a ~ 2 mm, and assuming R p = 0, R ℓ = 2.2 mm, and K r = 1.5,
  at the center of FOV and
  at the edge of FOV of the scanner. However, the contribution of R p may be appreciable for high-energy positron emitters (e.g., 82Rb;
  ) and small-animal PET scanners (e.g., microPET system) having smaller detectors.
The detailed method of measuring the spatial resolution of a PET scanner is given later in this chapter. The spatial resolutions of PET scanners from different manufacturers are given in Table 6.1.
Table 6.1
Performance data of different PET scanners
Manufacturers→a Models→ | Philipsb | Siemensc | GEc | |||
|---|---|---|---|---|---|---|
GEMINI TF | GEMINI TF | Biograph | Biograph | Discovery | Discovery | |
Features↓ | Big Bore | 64 (PET/CT) | mCT | TruePoint | VCT | PET/CT 600 |
Sensitivity – 3D (cps/kBq/cc) | 7.2 | 7.2 | 9.5 | 7.6 | 9.1 | 9.1 |
Transverse Resol. at 1 cm (mm) | 4.7 | 4.7 | 4.4 | 4.2 | 5.0 (2D) 5.0 (3D) | 5.1 |
Transverse Resol. at 10 cm (mm) | 5.2 | 5.2 | 5.8 | 4.8 | 5.4 (2D) 5.4 (3D) | 5.6 |
Axial resol. at 1 cm (mm) | 4.7 | 4.7 | 4.5 | 5.0 (2D) 5.0 (3D) | 5.6 | |
Axial resol. at 10 cm (mm) | 5.2 | 5.2 | 4.8 | 5.5 | 5.6 (3D) | 6.3 |
Peak noise Equivalent Count rate (kcps) (3D) | 94 | 110 | 100 | 165 170 (TrueV) | 78 | 76 |
Scatter fraction (%) | 31 | 30 | <36 | <36 | 36 | 38 |
Sensitivity
The sensitivity of a PET scanner is defined as the number of counts per unit time detected by the device for each unit of activity present in a source. It is normally expressed in counts per second per microcurie (or kilobecquerel) (cps/μCi or cps/kBq). Sensitivity depends on the geometric efficiency, detection efficiency, PHA window settings, and dead time of the system. The detection efficiency of a detector depends on the scintillation decay time, density, atomic number, and thickness of the detector material that have been discussed in Chap. 2. Also, the effect of PHA window setting on detection efficiency has been discussed in Chap. 2. The effect of the dead time on detection efficiency has been described in Chap. 3. In the section below, only the effects of geometric efficiency and other related factors will be discussed.
The geometric efficiency of a PET scanner is defined by the solid angle projected by the source of activity at the detector. The geometric factor depends on the distance between the source and the detector, the diameter of the ring, and the number of detectors in the ring. Increasing the distance between the detector and the source reduces the solid angle and thus decreases the geometric efficiency of the scanner and vice versa. Increasing the diameter of the ring decreases the solid angle subtended by the source at the detector, thus reducing the geometric efficiency and in turn the sensitivity. Also the sensitivity increases with increasing number of rings in the scanner.
Based on the above factors discussed, the sensitivity S of a single-ring PET scanner can be expressed as (Budinger 1998)

where A = detector area seen by a point source to be imaged, ε = detector’s efficiency, μ is the linear attenuation coefficient of 511-keV photons in the detector material, t is the thickness of the detector, and r is the radius of the detector ring. The proportionality to ε 2 arises from the two detectors with efficiency ε, i.e., ε × ε. So if the single-detector efficiency is reduced by half, the coincidence detection efficiency is ε/2 × ε/2 = ε 2/4.

(6.3)
Equation (6.3) is valid for a point source at the center of a single-ring scanner. For an extended source at the center of such scanners, it has been shown that the geometric efficiency is approximated as w/2r, where w is the axial width of the detector element and r is the radius of the ring (Cherry et al. 2003). Thus, the sensitivity of a scanner is highest at the center of the axial FOV and gradually decreases toward the periphery. In typical PET scanners, there are also multiple rings and each detector is connected in coincidence with as many as half the number of detectors on the opposite side in the same ring as well as with detectors in other rings. Thus, the sensitivity of multiring scanners will increase with the number of rings.
Note that the sensitivity of a PET scanner increases as the square of the detector efficiency, which depends on the scintillation decay time and stopping power of the detector. This is why LSO, LYSO, and GSO detectors are preferred to NaI(Tl) or BGO detectors (see Table 2.1). In 2D acquisitions, system sensitivity is compromised because of the use of septa between detector rings, whereas these septa are retracted or absent in 3D acquisition, and hence the sensitivity is increased by a factor of 4–8. However, in 3D mode, random and scatter coincidences increase significantly, the scatter fraction being 30–40% compared to 15–20% in 2D mode. The overall sensitivities of PET scanners for a small-volume source of activity are about 0.2–0.5% for 2D acquisition and about 2–10% for 3D acquisition, compared to 0.01–0.03% for SPECT studies (Cherry et al. 2003). The greater sensitivity of the PET scanner results from the absence of collimators in data acquisition.
Sensitivity is given by volume sensitivity expressed in units of kcps/μCi/cc or cps/Bq/cc. It is determined by acquiring data in all projections for a given duration from a volume of activity (uniformly mixed) and dividing the total counts by the duration of counting and the concentration of the activity in the source. Manufacturers normally use this unit as a specification for the PET scanners. The detailed method of determining volume sensitivity is described under acceptance tests in this chapter. The volume sensitivities of PET scanners from different manufacturers are given in Table 6.1.
Noise Equivalent Count Rate
Image noise is the random variation in pixel counts across the image and is given by  , where N is the counts in the pixel. It can be reduced by increasing the total counts in the image. More counts can be obtained by imaging for a longer period, injecting more radiopharmaceutical, or improving the detection efficiency of the scanner. All these factors are limited by various conditions, e.g., too much activity cannot be administered because of increased radiation dose to the patient, random coincidence counts, and dead-time loss. Imaging for a longer period may be uncomfortable to the patient and improving the detection efficiency may be limited by the design of the imaging device.
 , where N is the counts in the pixel. It can be reduced by increasing the total counts in the image. More counts can be obtained by imaging for a longer period, injecting more radiopharmaceutical, or improving the detection efficiency of the scanner. All these factors are limited by various conditions, e.g., too much activity cannot be administered because of increased radiation dose to the patient, random coincidence counts, and dead-time loss. Imaging for a longer period may be uncomfortable to the patient and improving the detection efficiency may be limited by the design of the imaging device.
The image noise is characterized by a parameter called the noise equivalent count rate (NECR) which is given by

where T, R, and S are the true, random, and scatter coincidence count rates, respectively. This value is obtained by using a 20-cm cylindrical phantom of uniform activity placed at the center of the FOV and measuring prompt coincidence counts. Scatter and random events are measured according to methods described later in this chapter. The true events (T) are determined by subtracting scatter (S) and random (R) events from the prompt events. From the knowledge of T, R, and S, the NECR is calculated by Eq. (6.4). The NECR is proportional to the signal-to-noise (SNR) ratio in the final reconstructed images and, therefore, serves as a good parameter to compare the performances of different PET scanners. The 3D method has a higher NECR at low activity. However, the peak NECR in the 2D mode is higher than the peak NECR in the 3D mode at higher activity. Image noise can be minimized by maximizing NECR.

(6.4)
Another type of image noise arises from nonrandom or systematic addition of counts due to imaging devices or procedural artifacts. For example, bladder uptake of 18F-FDG may obscure the lesions in the pelvic area. Various “streak”-type artifacts introduced during reconstruction may be present as noise in the image.
Scatter Fraction
The scatter fraction (SF) is another parameter that is often used to compare the performances of different PET scanners. It is given by


