div class=”ChapterContextInformation”>
9. Advanced Peripheral Artery Vessel Wall Imaging and Future Directions
Keywords
Peripheral arterial diseasePlaque imagingUltrasoundComputed tomography angiographyMagnetic resonance imagingIn the field of peripheral arterial disease (PAD), the ankle-brachial index (ABI) is considered the gold standard imaging modality for initial screening or diagnosis of lower extremity PAD based on current clinical practice guidelines [1]. While the ABI is an excellent study for diagnosing peripheral arterial occlusion, it has limited utility for assessing arterial wall disease. Being able to directly measure plaque and peripheral arterial remodeling in arterial walls may be better suited for defining disease burden. It is widely recognized that PAD is more complicated than a flow-limiting process and that atheromatous plaque is a nidus for inflammation with consequent risk of plaque rupture [2]. A recent histopathologic study has suggested that atherothromboembolic disease is a primary feature of PAD [3]. We will review the current imaging techniques presently used for vessel wall imaging including intravascular ultrasound (IVUS), fluoro-deoxy-glucose positron emission tomography/computed tomography (FDG-PET/CT), and magnetic resonance imaging (MRI).
Intravascular Ultrasound (IVUS)
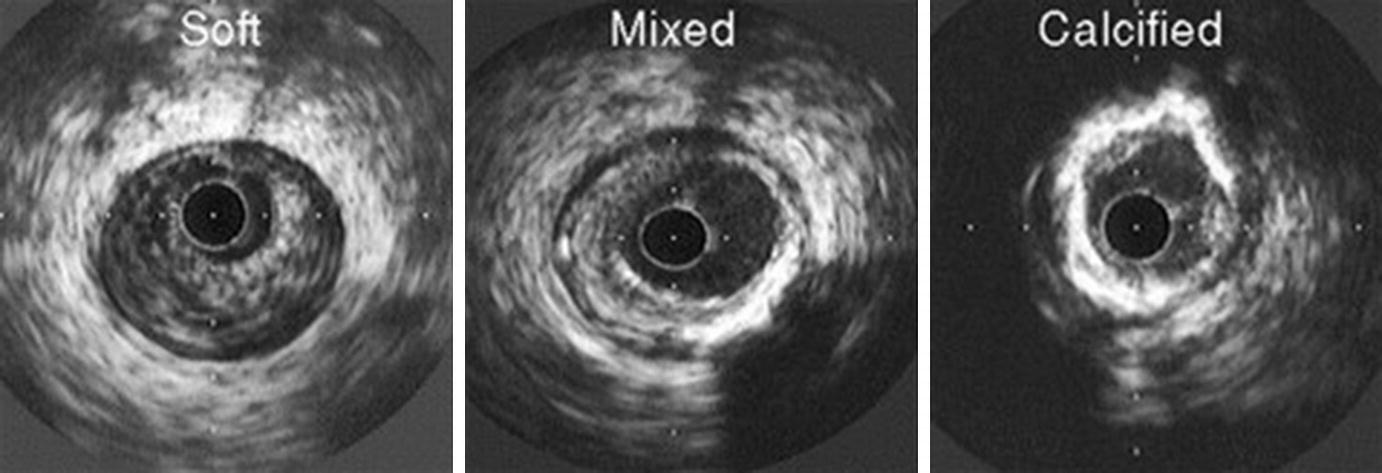
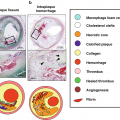
Atheroma morphology by IVUS. Soft (left), mixed fibrous and calcified (center), and heavily calcified atheromas (right) are illustrated. (From Nissen and Yock [5]; with permission from Wolters Kluwer Health, Inc.)
Computed Tomography Angiography (CTA) and FDG-Positron Emission Tomography/CT (FDG-PET/CT)
CTA has the advantage of higher spatial resolution compared to ultrasound. Since the arrival of multidetector scanners and multiple cross-sectional imaging allowing for rapid acquisition times, the use of CTA has grown. CTA also allows for three-dimensional (3D) imaging of the peripheral arterial tree which can be useful when planning revascularization strategies. CTA has shown to be effective in identifying >50% stenotic lesions in PAD with a sensitivity of 95% and specificity of 96% [11]. The presence of dense focal calcifications in the arterial wall can lead to overestimation of the degree of stenosis [12]. Other limitations of CTA include the need for iodinated contrast and ionizing radiation exposure.
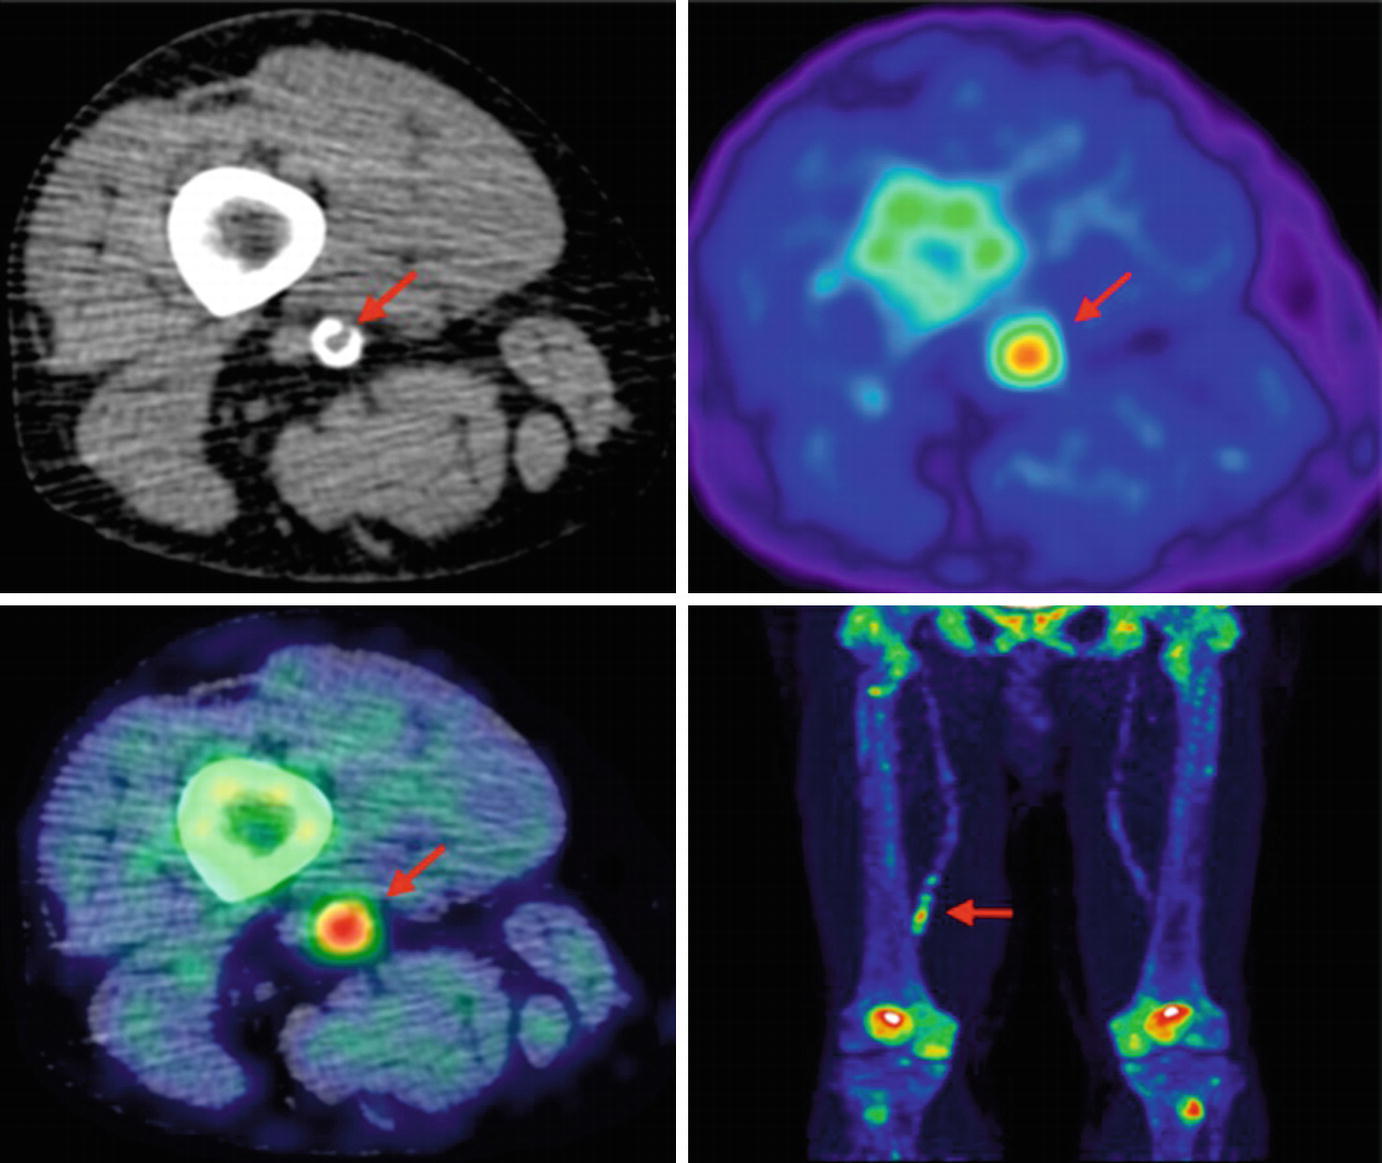
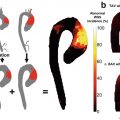
Lower limb 18F-NaF imaging: non-contrast CT (top left) with a rim of calcification of the vessel, 18F-NaF PET (top right), and fused 18F-NaF PET/CT (bottom left) of the superficial femoral artery (arrow) at the level of the adductor canal, demonstrating significant vessel uptake in this symptomatic patient. In addition, there is prominent uptake seen in the vessel at the same level on the coronal image (bottom right). (Reprinted from Evans et al. [2], page 7; http://creativecommons.org/licenses/by/4.0/; no changes were made)
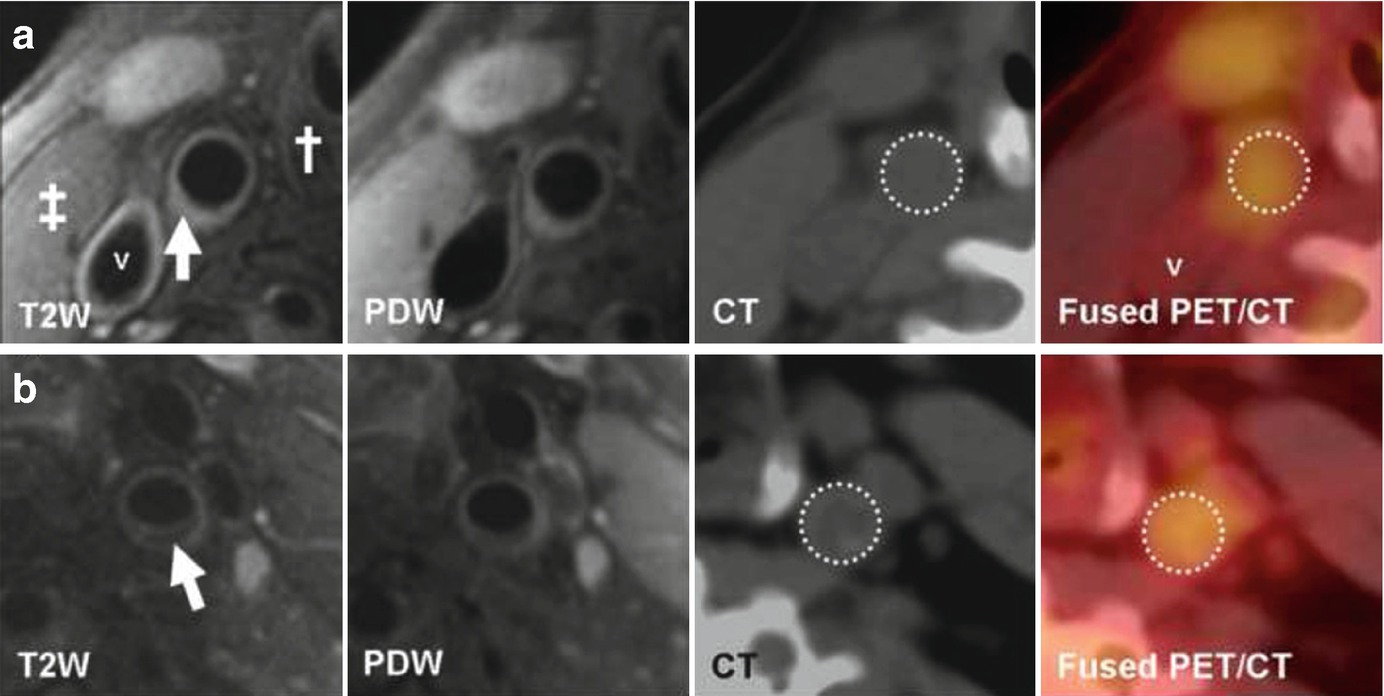
(Reprinted from Silvera et al. [15]; with permission from Elsevier) (a) Transverse MR and FDG-PET/CT images demonstrating a collagen rich plaque of the right common carotid artery. The T2-weighted (T2W) image demonstrates the right common carotid artery (white arrow), the jugular vein (“v”), the sterno-cleido-mastoid muscle (‡) and the thyroid cartilage (†). Carotid artery wall appears hyperintense on T2W (white arrow) and on proton density weighted (PDW) images. CT confirms the absence of calcification in the artery wall. The right common carotid artery is displayed on the computed tomography (CT) and on the fused positron emission tomography/CT (PET/CT) images (white dashed circle). (b) Transverse MR images and corresponding FDG-PET/CT images indicate a carotid artery lipid-rich necrotic core plaque, hypointense on T2W (white arrow) and on PDW images. CT image demonstrates the absence of calcification. The white dashed circle demonstrates FDG uptake into the entire artery section on the PET/CT image
Magnetic Resonance Imaging (MRI)
Contrast-Enhanced Techniques
Contrast-enhanced magnetic resonance angiography and CT angiography are both useful for diagnosing and assessing PAD; however, they don’t provide information on arterial remodeling and can underestimate the extent of atherosclerosis [16]. Furthermore, contrast agents limit the use of both of these modalities in certain patients, including those with advanced chronic kidney disease. Below we will summarize different MRI techniques that have been developed for arterial wall assessment.
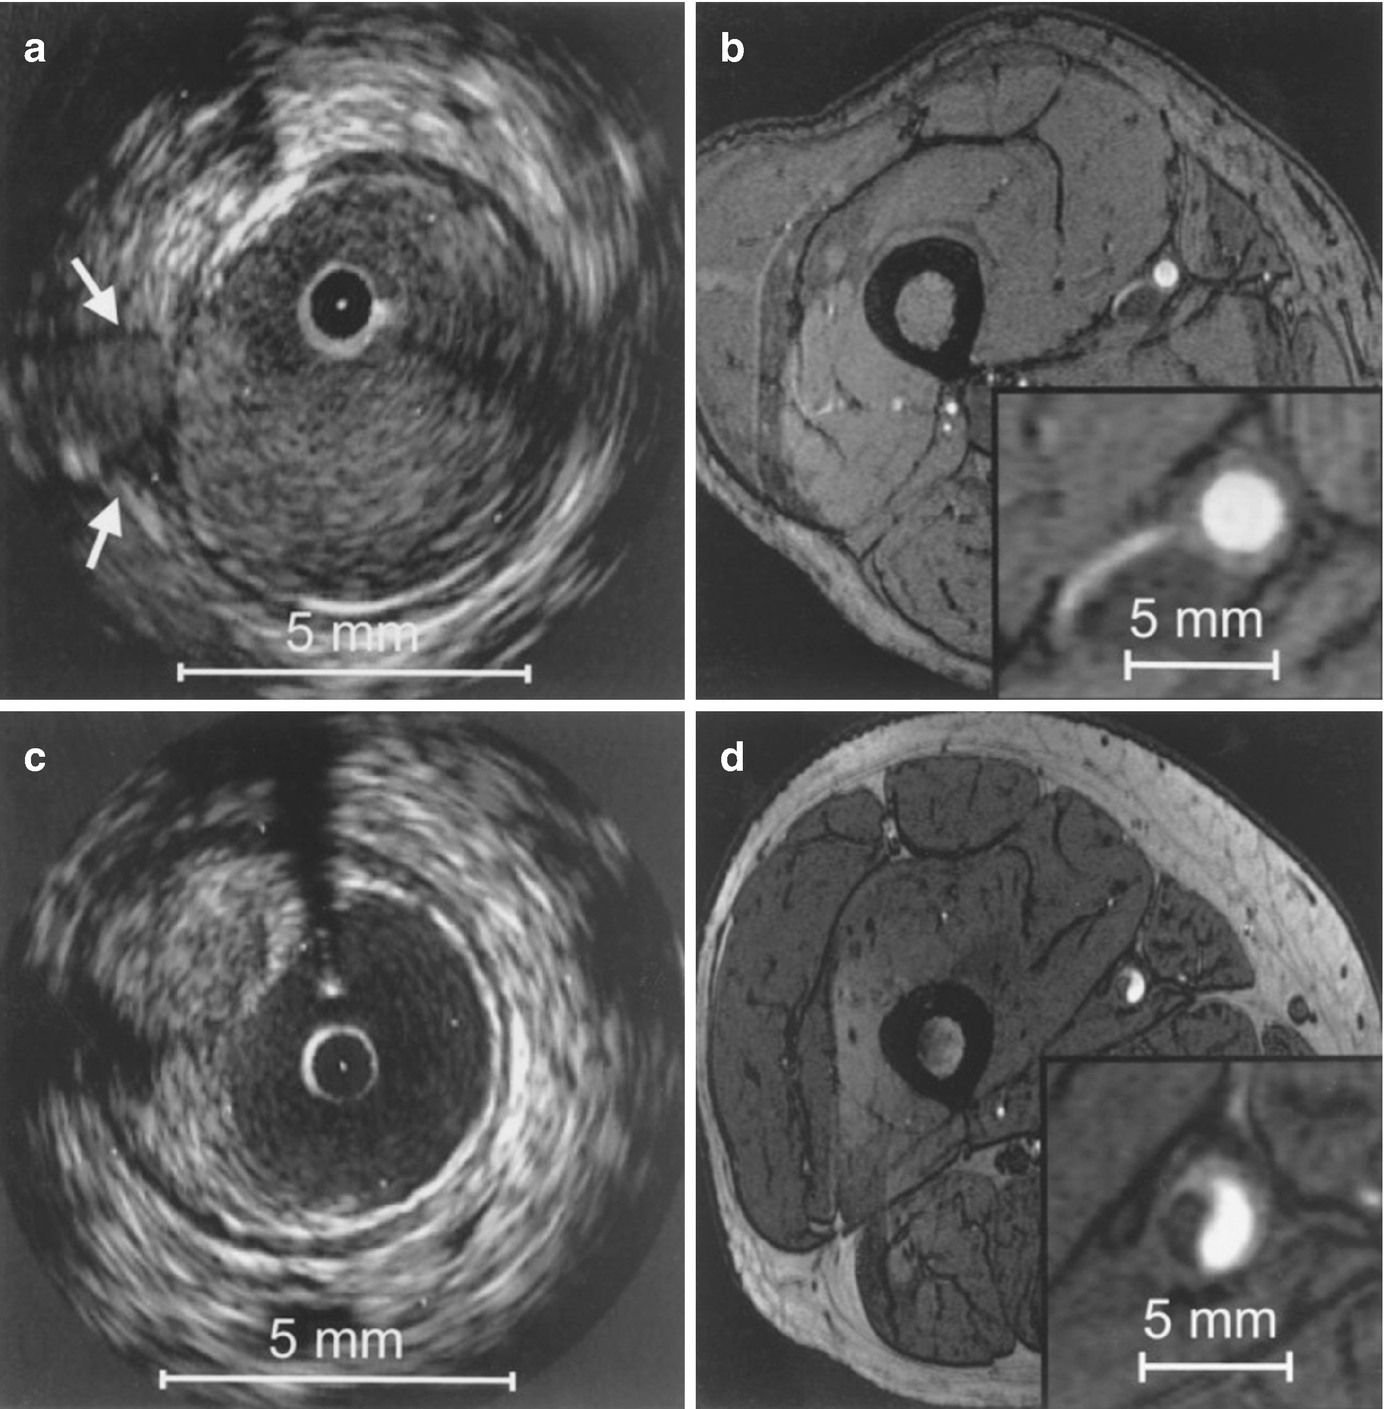
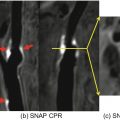
Correlation between IVUS and axial high-resolution (HR) 3D time-of-flight MR images in two different vessel segments. Insets in each MR image represent magnified views of the distal superficial femoral artery. HR MR images are acquired at a slice thickness of 2 mm with an in-plane resolution of 0.78 ′ 0.49 mm2, with no interslice gap. (a) IVUS visualization of a vessel segment with a side branch (white arrows); (b) corresponding HR MR image. The course of the side branch can be clearly followed. (c) IVUS visualization of a vessel wall segment with characteristic plaque formation. (d) corresponding HR MR image. The hypointense plaque can be clearly differentiated from the hyperintense lumen. (Reprinted from Meissner et al. [10]; with permission from Elsevier.)
Related posts:

Stay updated, free articles. Join our Telegram channel

Full access? Get Clinical Tree


