and Filiz Özülker1
(1)
Nuclear Medicine, Okmeydani Training and Research Hospital, Istanbul, Turkey
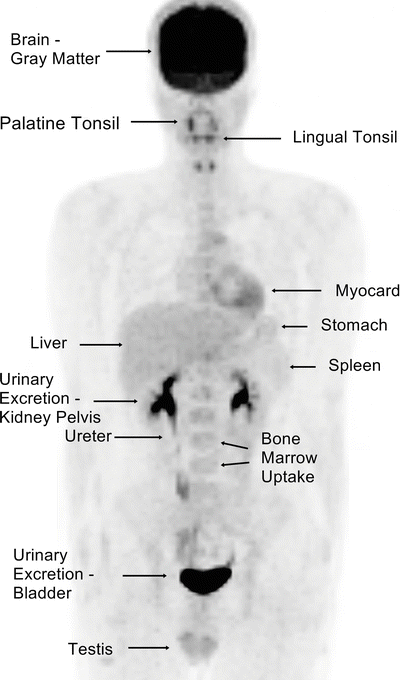
Fig. 1.1
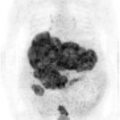
MIP image of normal distribution of 18F-FDG for man
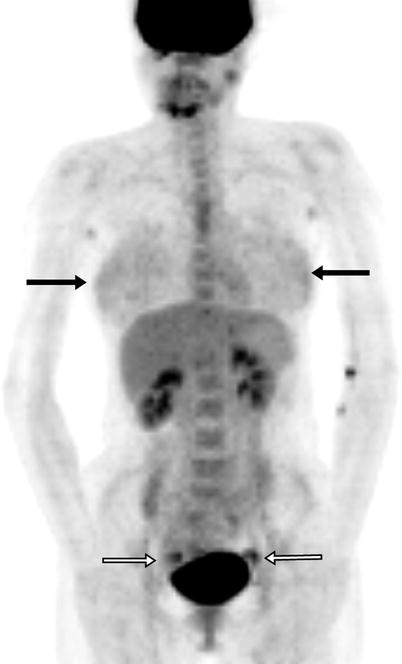
Fig. 1.2
MIP image of normal distribution of 18F-FDG for woman. Physiologic FDG uptake at breasts is seen (arrows), being more prominent in young or lactating patients. During ovulation, ovaries display increased FDG uptake (empty arrows)
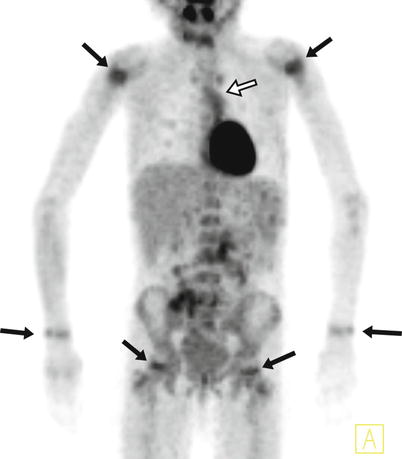
Fig. 1.3
MIP image of normal distribution of 18F-FDG for a 7-year-old girl. Mild uptake at epiphyseal plates normally can be seen (arrows). There is physiologic thymus uptake which is also normal for this age (empty arrow)
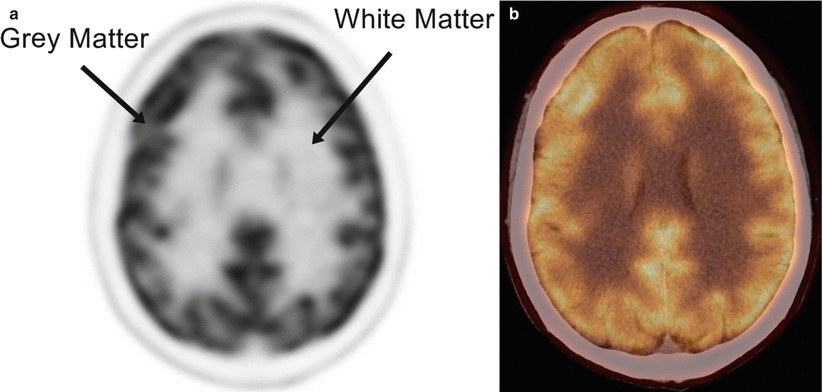
Fig. 1.4
Axial PET and fusion images (a, b). Since the main energy source of brain is glucose, very intense FDG uptake in gray matter, basal ganglia and thalami is seen
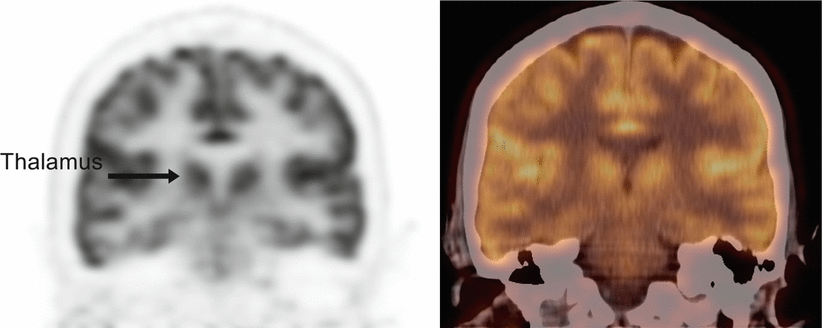
Fig. 1.5
Coronal PET and fusion images
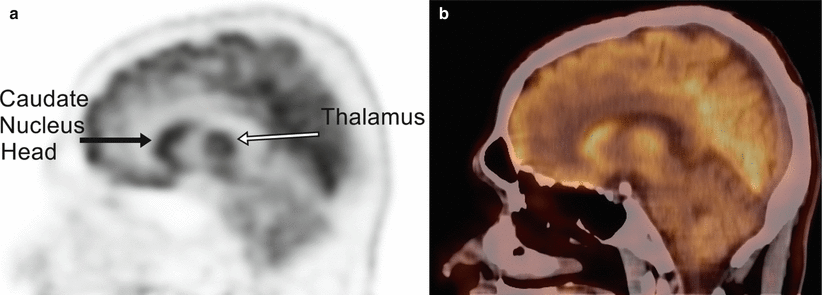
Fig. 1.6
Sagittal PET and fusion images (a, b)
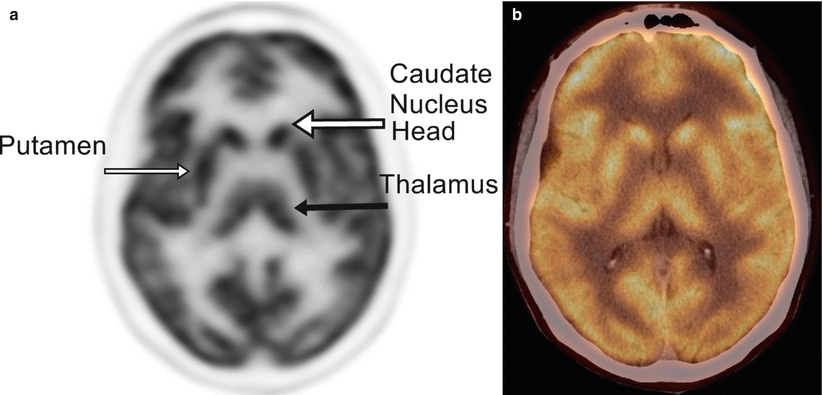
Fig. 1.7
Axial PET and fusion images (a, b)
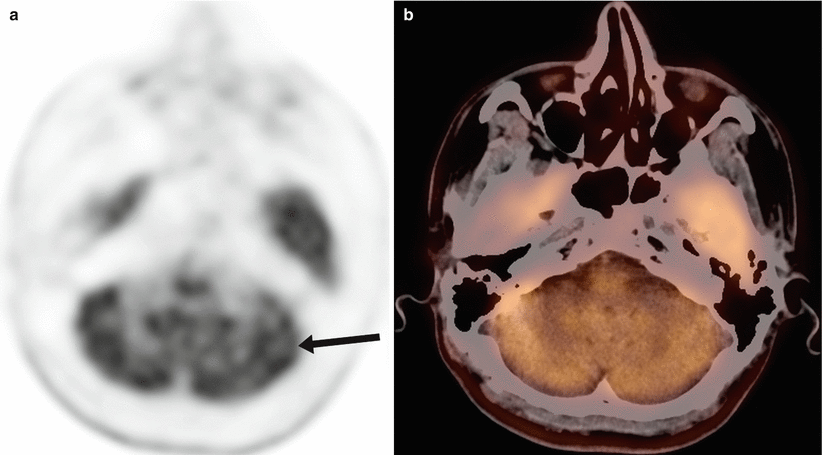
Fig. 1.8
Axial PET and fusion images show normal FDG uptake at cerebellum (arrow) (a, b)
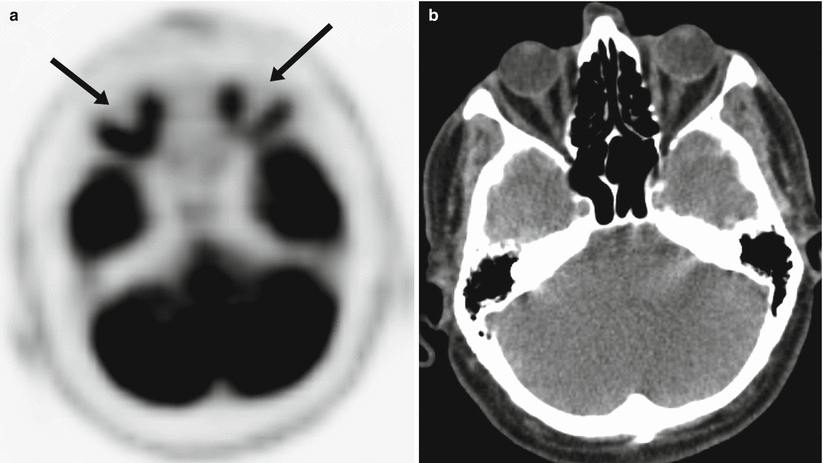
Fig. 1.9
Physiologic uptake at extraocular muscles (a, b). The 20 min period after administration of FDG is uptake phase. In this period waiting with eyes closed is very important to minimalize FDG uptake of extraocular muscles
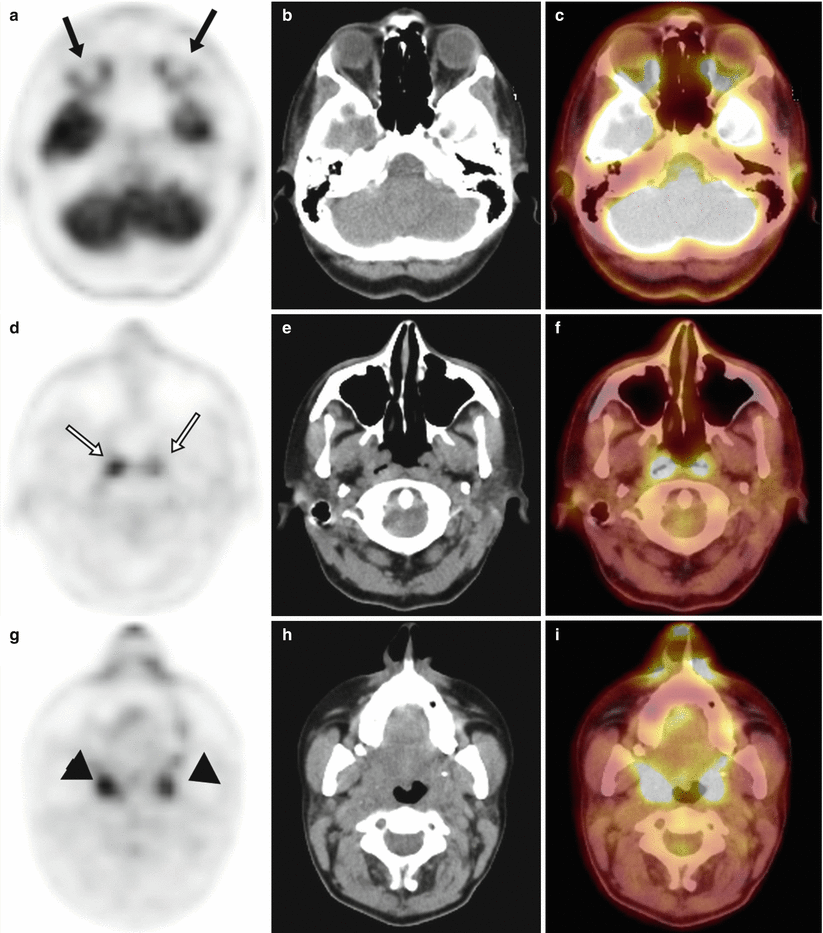
Fig. 1.10
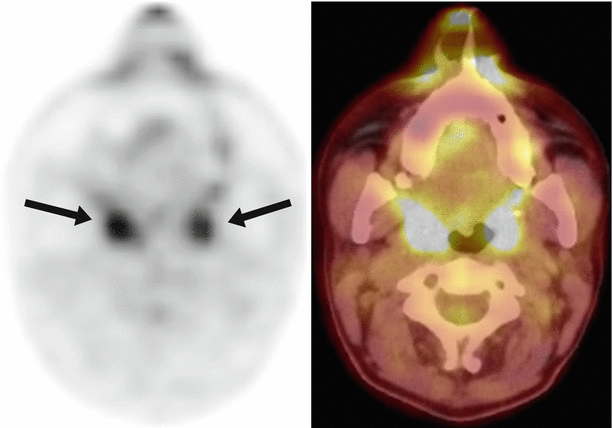
Axial slices of PET, CT, and fusion images show extraocular muscle uptake (arrow) (a–c), bilateral uptake at nasopharynx (empty arrows) (d–f), and bilateral uptake at palatin tonsils (arrow heads) (g–i). Generally bilateral intense uptake can be seen in lingual and palatin tonsils. If significant asymmetric uptake is seen in these areas, clinical correlation should be done to differentiate pathological condition
