Fig. 9.1
Proton MR spectra of Normal (a) and Grade 4 glioma (b): TE = 135 ms
In an early application of MRS, Tsien et al. [28] in a single voxel study using a TE = 270 ms, showed that Grade 4 lesions had lower NAA and Cr levels and higher Cho levels when compared to lower grade lesions. In a similar study using a TE = 135 ms, Kwock et al. [29]. found the same correlation; but in addition, they found that as long as the lesion had not been treated, the level of myoinositol (MI) observed at 3.5–3.6 ppm (using a short TE of 20 or 30 ms) could also aid in differentiating low from high grade gliomas (Fig. 9.2 and Table 9.1). These investigators found that there was a trend towards lower MI levels as the glioma became more malignant, namely, Grade 4 had barely detectable levels of MI, Grade 3 had levels equal to or less than found in surrounding brain tissue, and Grade 2 had elevated levels of MI compared to normal surrounding tissue. This observation was confirmed in high resolution magic angle spinning (HRMAS) “ex vivo” nuclear magnetic resonance spectroscopy studies of glioma tissue [23, 30]. The decrease in myoinositol to creatine (MI/Cr) ratio was shown to be due to a decrease in the level of myoinositol (MI) as the histological grade of the lesion increased (Fig. 9.3) [23].
Fig. 9.2
Proton MR spectra of (a) normal brain, (b) Grade 2 glioma, and (c) grade 4 glioma: TE = 30 ms
Table 9.1
Choline/Creatine (Cho/Cr) and Myoinositol/Creatine (Myo/Cr) Proton Metabolite Peak Area Ratios in Normal brain and Gliomas
TE = 135 ms | TE = 30 ms | ||
|---|---|---|---|
Cho/Cr | Cho/Cr | Myo/Cr | |
1. Normal Brain (n = 20) | 1.08 ± 0.19 | 0.91 ± 0.15 | 0.42 ± 0.16 |
2. WHO Grade 2 (n = 5) | 1.66 ± 0.28 | 1.28 ± 0.63 | 1.02 ± 0.13 |
3. WHO Grade 3 (n = 5) | 2.72 ± 0.49 | 2.06 ± 0.36 | 0.49 ± 0.21 |
4. WHO Grade 4 (n = 10) | 3.23 ± 1.06 | 2.15 ± 0.66 | 0.33 ± 0.17 |
Fig. 9.3
In Vitro High Resolution Proton Magnetic Resonance Spectroscopy of Primary Brain Tumors (Reprinted with permission [31])
In a similar study, using a single voxel MRS technique, Moller-Hartmann and colleagues [31] assessed 164 patients with suspected brain tumors. Comparing Cho/Cr peak intensity ratios obtained from the MRS studies with the anatomical MRI data of the lesions, they found that addition of proton MRS data to the MRI evaluation lead to a 15 % increase in the number of correct diagnoses with respect to the grade and type of lesion, 6.2 % fewer incorrect diagnoses, and 16 % fewer equivocal diagnoses. In addition, they found that the Cho/Cr peak intensity ratios (Table 9.2) increased with the grade of the glioma similar to what was reported by Kwock et al. [29] and Magalhases et al. [32].
Table 9.2
Choline to Creatine proton peak intensity ratios(Cho/Cr) of gliomas: TE = 135 ms
WHO Classificartion: | Grade 2 | Grade 3 | Grade 4 |
|---|---|---|---|
1. Moller-Hartmann et al. [31] | 1.33 ± 0.08 | 2.13 ± 0.12 | 3.93 ± 0.64 |
2. Magalhaes et al. [32] | 1.50 ± 0.32 | 1.62 ± 0.38 | 3.34 ± 1.15 |
3. Kwock et al. [29] | 1.66 ± 0.28 | 2.72 ± 0.49 | 3.23 ± 1.06 |
The reduction of NAA indicates a loss of neurons as they are destroyed or substituted by tumor. Reduction of Cr is related to an altered energy metabolism; with decreased Cr levels indicating more active metabolism whereas increased levels indicate hypometabolism [33]. The marked increase in Cho intensity in these malignant tumors has been attributed to increased activity of plasma membrane components involved in cellular proliferative [34] and migratory processes [35] within these tumors.
In clinicopathological studies, proton MRS spectral patterns obtained in MRSI studies of gliomas have shown to be able to differentiate high-grade from low grade lesions throughout the tumor [20–25]. Pruel and colleagues [25] applied linear discriminate analysis to the “in vivo” MRS metabolite to creatine (metabolite/Cr) signal-intensity ratio spectral profiles obtained from brain lesions and found that the MRS spectral profiles could be used to not only distinguish the grade of the glioma but also could distinguish the type of brain lesion (i.e., benign vs. malignant and primary brain tumor vs. metastatic lesion). The spectral profiles were correlated with biopsies obtained from these lesions with greater than 90 % accuracy. In 104 of 105 MR samples analyzed, the grade and type of malignant disease were classified correctly using the MRS spectral profiles, whereas conventional preoperative clinical diagnosis misclassified 20 of 91 lesions.
Along with Cho/Cr ratios, Choline to N-acetylaspartate ratios (Cho/NAA) have also been used to “histologically” grade primary brain tumors. In initial studies conducted by Dowling et al. [36] when Cho levels were found to be elevated by more than 2 SD above the norm and the NAA levels decreased by at least 2 SDs from the norm, regions biopsied for histological evaluation always contained tumor. Using this as a criterion, McKnight et al. [37] and Stadlbauer et al. [38] showed that a combination of increased concentrations of Cho and decreased concentrations of NAA (Cho/NAA metabolic ratios) were associated with the presence of metabolically active tumor cells which correlated positively with the grade of the lesion (Grade 2: Cho/NAA = 0.40 ± 0.16 and Grade 3: Cho/NAA = 0.81 ± 0.46 [38]). However of major importance was that these studies also showed that Cho/NAA maps could be co-registered with MR images and used to determine the location and spatial distribution of the most metabolically active tumor population within the lesion (Fig. 9.4) [38]. This metabolite map could then be used, not only for guiding tumor biopsy procedures to obtain tissue for histological analysis, but also for neurosurgical and radiotherapy treatment planning.
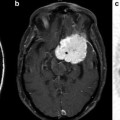
Fig. 9.4
(a, b) Transverse T2-weighted (6,490/98) MR images in (a) patient 6 (astrocytoma grade II) and (b) patient 7 (oligodendroglioma grade III) superimposed with color-coded segmented Cho/NAA ratio image. Voxels in predominantly red areas (enclosed by black line) were determined as voxels in the tumor center; all other voxel positions were determined as voxels in the tumor border (enclosed by white line). Green lines show volume of interest of the MR spectroscopic examination. Violet and blue minimum value, red maximum value. (c) Box plot shows a significant and definite difference (P 0.001) for quantified Cho/tNAA ratio averaged over the tumor center between patients with glioma grades II (n9) and III (n17). The central box represents values from lower to upper quartile (25–75 percentile), the middle line represents the median, and vertical bars extend from minimum to maximum value. Small black squares show individual data points. (Reprinted with permission [38])
Defining and Delineating Metabolically Different Tumor Regions with Proton MRS
Surgical and radiation therapy (XRT) treatment planning based solely upon conventional anatomical MR imaging is one of the reasons for the dismal prognosis of high grade gliomas (Grade 3 and 4; HGG). The extent of neurosurgical resection is a significant prognostic factor in HGG, and with the aid of computer assisted neuro-navigation systems have improved the neurosurgical procedures for the resection of HGGs [39–41]. Patients receiving gross total resection live longer and have improved functional abilities than do patients who undergo subtotal tumor resection [40]. However, HGGs are morphologically and phenotypically heterogeneous and extensively infiltrate brain parenchyma. The MR techniques currently used to plan the surgical resection of the lesion or selecting specific surgical biopsy targets, as previously indicated have been shown [8, 9, 12, 13] to be inadequate of accurately delineating both the extent of tumor infiltration and/or defining and locating the different intratumoral populations within the lesion [namely, (1) the active proliferating tumor population, (2) the migratory tumor population, and (3) the quiescent psuedopalisading hypoxic tumor population]. Establishing the extent of tumor process is one of the major problem areas in HGG neurosurgical planning. Surgical resection is currently targeted to areas based on gadolinium (Gd) enhancement observed on T1-weighted MR images following intravenous injection of gadolinium-DPTA (Gd-DPTA). Enhancement is attributed to BBB breakdown associated with increased tumor angiogenesis in regions of active tumor growth [4, 6]. However, Gd- enhancement, as previously indicated, is not always a reliable indicator of viable tumor due to the presence of non-enhancing tumor regions and contrast-enhancing necrosis [4, 5, 12]. In addition because of the infiltrative nature of HGG, it has been demonstrated that it can extend, nonuniformly, several centimeters beyond regions of contrast enhancement [5]. Thus, reliance on Gd-enhanced MR images for neurosurgical planning can underestimate tumor volume and lead to subtotal resections of the lesion.
Surgical resection is then followed by concomitant adjuvant XRT and chemotherapy. Prior to the availability of computerized X-ray tomography (CT), whole brain or large field external beam XRT techniques were used to treat HGG since conventional imaging techniques were unable to accurately assess the extent of tumor [13]. Consequently XRT toxicity to normal brain tissue within the treatment field was common and dose-limiting. With the advancements in 3D conformal XRT techniques, the therapeutic index of XRT in tumor versus normal brain has been substantially increased [42, 43]. However, conformal XRT treatment of HGG especially intensity modulated radiation therapy (IMRT) and radio-surgical XRT techniques require a more accurate definition of the extent and location of the target volumes if these techniques are to be used effectively. Incorrect definition of target volumes can lead to recurrences either at the edge of the target volumes or within the lesion if incorrectly defined.
Currently, the Radiation Therapy Oncology Group (RTOG) recommends using CT and/or MRI to identify tumor volumes for radiotherapy treatment planning [44]. For MRI, fluid attenuated inversion recovery (FLAIR) and T2-weighted MR images are the recommended imaging sequences to use for planning the radiation treatment paradigm. Essentially the same MR imaging methods utilized to delineate the tumor volumes prior to the advent of the more precise RT targeting techniques. Generally, the standard conformal radiotherapy plan targets the abnormal MR imaging area plus a uniform margin of between 1 and 4 cm in all directions to account for tumor infiltration [12, 13]. Using either T2-weighted or contrast enhanced T1-weighted MR images to define target volumes, Price et al. [8] found that in 20 patients, “both T2- and gadolinium-enhanced T1 weighted images missed 1 region of gross tumor. In the infiltrating tumor region, enhanced T1-weighted imaging could identify only 11 of 20 regions and T2-weighted could identify 12 of 20.” Similarly, in a study comparing T2 and FLAIR imaging for target delineation in HGG, Stall et al. [9] found that the FLAIR clinical target volumes (CTV) and the planning target volumes (PTV) were significantly larger than the T2 CTVs and PTVs. In addition, they found that the different sequences showed a discordant location for the target volumes (Fig. 9.5; [45]).
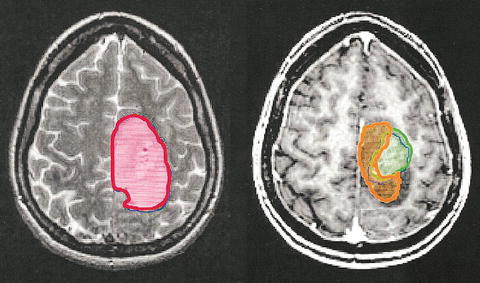
Fig. 9.5
Comparison of lesion extent measured using T2 weighted MRI (red), T1 weighted MRI following injection of contrast agent (green), and MRS to measure high Cho/NAA (orange) for a patient with a grade 4 glioma (with permission [45])
The primary therapeutic goal in neuro-oncology is the complete eradication of tumor; therefore, for patients diagnosed with HGG, to obtain the maximum benefit from these new radiotherapeutic and neuro-navigational surgical techniques, it is essential to know as accurately as possible the extent of the tumor borders. However, by utilizing just the conventional MR and CT imaging techniques to plan the radiotherapeutic and/or neurosurgical approaches, as recommended by the RTOG guidelines, we have not improved our ability to define tumor boundaries nor our ability to more accurately assess the degree of tumor infiltration to treat the tumor or normal brain more effectively.
To achieve the goal of “complete eradication of the tumor” or at least better local tumor control, better noninvasive imaging techniques must be employed to (1) not only delineate the extent of the tumor better for neurosurgical and radiotherapy treatment planning but also to (2) determine the extent and characterize the differences in the major intratumoral populations within the lesion. The latter is needed to identify the tumor populations that are responsible for the recurrence and/or resistant to the HGG treatment paradigm used, so that once identified, treatment strategies can be developed to target this tumor population within the lesion.
In 2001, Dowling et al. [36] took an important step in establishing MRS as a potential technique to map tumor extension. Utilizing a 3-dimensional (3D) MRS technique, they evaluated the 3D MR spectra obtained from 28 brain tumor patients and correlated the histological findings from specific sites to the corresponding MR spectral voxels. Their results showed the following:
1.
If the level of NAA is normal, the tissue within that voxel is normal. Conversely, abnormal levels of NAA correlate with abnormal tissue regardless of the underlying histological findings (Figs. 9.6 and 9.7).
Fig. 9.6
Proton MRSI of uninvolved brain region adjacent to low grade lesion. (Note level of NAA in abnormal FLAIR tumor region vs. uninvolved tumor region shown in square)
Fig. 9.7
Infiltrative Grade 4 Glioma: Note level of Cho relative to Cr and NAA in enhancing and non-enhancing brain regions. Both spectra indicative of tumor being present
2.
3.
The peak area intensity of Cho correlated with percentage of tumor in the sampled voxel.
4.
Non-detectable to near-normal levels of NAA and Cho are seen in areas of gliosis and necrosis).
5.
Image areas with similar appearance and enhancement may show different spectral patterns and histological characteristics (Fig. 9.8).
Fig. 9.8
MR Images with similar appearance but show either same spectral patterns or different spectral patterns suggesting different histological characteristics
On the basis of these data, 3D MRSI may be an important method that can be used to map tumor margins, identify areas with the highest proliferative fractions for targeted therapy and biopsy, and identify post therapy sites of tumor recurrence.
In a patient study of 34 HGG, Pirzkall et al. [12] determined whether the metabolic information provided by MRSI defined volumes could improve the accuracy of target volumes for RT treatment planning compared to target volumes defined by MRI. Using elevated Cho and decreased NAA as criteria, Pirzkall et al. [12], compared the MRSI defined volumes to that defined by the Gd-enhanced T1 and T2-weighted MRI studies. They found that the T2 studies estimated, as judged by the volume of the hyperintense T2 region, the region at risk of containing microscopic disease as being as much as 50 % greater than by MRSI. On the other hand, the Gd-enhanced T1 studies suggested a lesser tumor volume and different location of active disease compared to MRSI studies (see Fig. 9.4). They concluded that “the use of MRSI to define target volumes for RT treatment planning would increase, and change the location of the volume receiving a boost dose as well as reduce the volume receiving a standard dose.” This study suggests that the inclusion of MRSI data into the treatment planning process could potentially improve tumor control while reducing normal tissue radiation complications. This was clearly shown to have occurred in a XRT study of 26 patients with grade 4 gliomas by a study conducted by Chan et al. [46]. Patients with MRSI abnormalities (i.e., elevated Cho/NAA levels) outside of the MRI defined target volume had decreased median survival times relative to those with MRSI abnormalities inside the MRI defined target volumes (10.4 vs. 15.7 months).
MRS Spectral Profile of (a) Proliferative, (b) Hypoxic/Psuedopalisading, and (c) Infiltrating Glioma Populations
Related posts:
 Imaging Metabolic and Molecular Functions in Brain Tumors with Positron Emission Tomography (PET)
 BOLD fMRI for Presurgical Planning: Part II
 BOLD fMRI for Presurgical Planning: Part I
 Role of Amide Proton Transfer (APT)-MRI of Endogenous Proteins and Peptides in Brain Tumor Imaging
 Future Clinical Applications of Molecular Imaging: Nanoparticles, Cellular Probes, and Imaging of Gene Expression
 Ultra-High Field MRSI (7T and Beyond)
Stay updated, free articles. Join our Telegram channel

Full access? Get Clinical Tree


