Fig. 8.1
MRI and FDG PET images of a patient with grade 2 astrocytoma, (a) The T2–FLAIR image reveals edema. (b) There is no enhancement on T1-MRI with Gd, (c) A FDG-PET image demonstrates a level of FDG metabolism that is similar to normal white matter, which indicates that it is a low-grade lesion
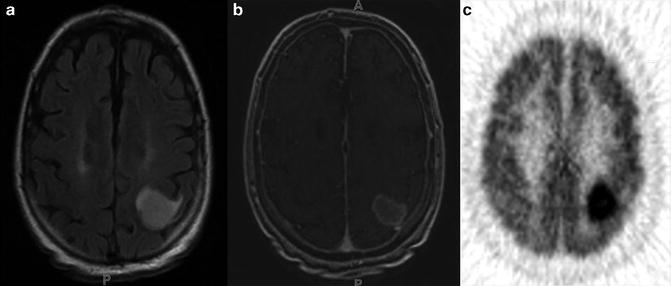
Fig. 8.2
MRI and FDG PET images of a patient with glioblastoma multiforme. (a) The T2–FLAIR image reveals edema, (b) The T1-MRI with Gd demonstrates a contrast-enhancing tumor, (c) A FDG-PET image demonstrates metabolically active tumor
Independent of prior therapy for both low- and high-grade astrocytomas, FDG accumulation can yield important information about prognosis. Patronas et al. pioneered the use of FDG PET results as a prognostic factor in gliomas, showing that patients with hypermetabolic tumors had an average survival of 5 months, while patients with eumetabolic or hypometabolic tumors had an average survival of 19 months [6]. In studies of patients with low-grade tumors, the development of focal areas of hypermetabolism has been associated with poorer prognosis [5–7].
The physiological high background FDG accumulation in gray matter structures such as the cerebral cortex and basal ganglia, makes the lesions less conspicuous and limits the ability of FDG PET to detect and characterize small lesions. The uptake of FDG is nonspecific and inflammatory/infectious lesions demonstrate variable FDG uptake [4–7]. Image interpretation can be greatly facilitated by coregistration with MRI and/or databases of FDG uptake in normal brains. A negative FDG PET can also be helpful to exclude a high-grade glioma [4–7].
MET is the most studied PET AA imaging modality for brain tumors, with an overall sensitivity of 76–97 % and specificity of 75–100 % in brain tumor detection and differentiation of benign from malignant lesions [9–15]. Ogawa et al. found 97 % sensitivity for MET-PET in 32 patients with high-grade astrocytomas but only 61 % sensitivity in low-grade astrocytomas [9]. Although the sensitivity is lower compared to the high-grade gliomas, a MET PET scan is particularly useful in detecting low-grade gliomas which are difficult to identify with enhancement characteristics on anatomical images [10, 11]. Ribom et al. reported that 94 % of low-grade gliomas demonstrated increased MET uptake, while only 38 % showed contrast enhancement on CT or MRI [11]. Similar results have been reported for high-grade gliomas. Kracht found that 29 of 53 surgical specimens of grade 3 and 4 astrocytomas presented with no signs of contrast enhancement on MRI but showed increased MET uptake [10]. Furthermore, Chung et al. reported that 89 % of 35 brain tumors with decreased or iso- FDG activity on PET could be detected and differentiated with high sensitivity and good contrast using MET PET [12]. The reported causes of false positives on a MET PET brain scan include demyelination, necrosis, subacute or chronic ischemia, leukoencephalitis, brain abscess, acute infarct, and hematoma. The mechanism of MET accumulation in benign inflammatory lesions is not clear, but thought to be due to the increased methionine uptake in the perivascular mononuclear infiltrate, gliotic reaction, increased blood flow, and blood–brain barrier breakdown [4, 9, 12, 13].
MET uptake correlates with cell proliferation, in vitro Ki-67 expression, proliferating cell nuclear antigen, and microvessel density, making it a potential biomarker for active tumor proliferation [4, 13]. However, unlike FDG PET, MET PET has not revealed a clear predictive value for grading with visual analysis [7, 14, 15]. Although the prognosis depends on the histological tumor grade, MET PET is a significant prognostic factor, even superior to FDG PET, independent of tumor grade and prior treatment. High MET uptake has been shown to be statistically associated with a poor survival time [7, 9–11, 14, 15].
FET is one of the most promising 18F AA radiotracer, which can be produced in large amounts for clinical purposes, and exhibits a similar diagnostic potential to MET [8, 16–18]. Unlike MET and FDG, FET exhibits low uptake in nonneoplastic inflammatory cells [8, 16–18]. The tumor specificity has been the major reason for the specific interest in FET, which was thought to be related to selective uptake of FET via a specific subtype of the LAT system [17, 18]. The sensitivity and specificity of FET were reported to be between 93 and 100 %, and 100 %, respectively, for both low- and high-grade gliomas with higher results for high-grade glioma [8, 16–20]. In a comparative study, MRI had a sensitivity of 96 % for the detection of tumor tissue, but a specificity of only 53 %. In contrast, the combined use of MRI and FET PET increased the specificity to 94 % with a sensitivity of 93 %. The combined use of MRI and FET PET was clearly superior to that of MRI alone for the noninvasive distinction of tumor tissue and peritumoral brain tissue in patients with cerebral gliomas [20]. In a similar study, Floeth et al. demonstrated that sensitivity and specificity for tumor detection were 100 and 81 % for MR spectroscopy (MRS) and 88 and 88 % for FET PET. The accuracy in distinguishing neoplastic from nonneoplastic tissue could be increased from 68 % with the use of MRI imaging alone to 97 % with MRI imaging in conjunction with FET PET and MRS [17].
Assessment of tumor grade with FET PET has been considered of little value because of the individual variability of SUV FET [16, 17, 20–23]. However, the ratio of FET SUV to background has been found to correlate with clinical outcomes in patients with gliomas [22]. Interestingly, nonspecific incidental brain lesions, seen as circumscribed growth patterns on MRI and having normal or low FET uptake, were reported to be strong predictors for a benign course. If there was eventual development of a glioma, a diffuse growth pattern on MRI and increased FET uptake indicated a high risk for the development of a high-grade glioma [23].
FDOPA, is another amino acid analogue that is taken up by normal brain at the blood–brain barrier by the neutral amino acid transporter, trapped in striatum and was thought to be transported into but not trapped in tumors [24–26]. FDOPA has demonstrated a high specificity of 90–100 % for diagnosis of initial and recurrent gliomas in all grades. FDOPA uptake preceded tumor detection on MRI and FDOPA uptake has been reported in gliomas with no enhancement on MRI [26]. FDOPA PET demonstrated higher sensitivity than FDG PET and FDOPA uptake correlated better with Ki-67 values, and was a more powerful predictor of tumor progression and survival compared to FDG PET [25–27]. There are controversial studies related to correlation with neoplastic grade; however, compared to other AA radiotracers, FDOPA uptake kinetics have been demonstrated to correlate better with tumor grade [25–27].
FLT, developed as a PET tracer to evaluate tumor cell proliferation, and the uptake of FLT has been demonstrated to correlate with thymidine kinase-1 (TK1) activity and the proliferation index Ki-67 in gliomas [28, 29]. FLT seems to be superior to MET and FDG in noninvasive tumor grading, assessment of proliferation activity, progression and survival of the patients with gliomas of different grades [24, 30]. However, Jacobs et al. reported 78.3 % sensitivity for FLT PET for the detection of tumors, which was lower than the 91.3 % sensitivity of MET PET, especially for low-grade astrocytomas [30].
Choline has been targeted as a PET imaging molecule, a likely marker of metabolic activity, preferentially taken up by tumor cells, but not by chronic inflammatory cells. In gliomas, FCH uptake has been demonstrated to correlate well with tumor grade [31–34]. Abnormal metabolite profiles of increased levels of choline and decreased levels of N-acetyl acetate (NAA) correlate with high-grade intracranial malignancies on MRS. High-grade gliomas are distinguishable from oligodendrogliomas and other low-grade gliomas by higher uptake of choline tracers seen with PET and higher levels of choline metabolites using MRSI. However, with MRS, increased levels of choline metabolites may also be found in demyelinating lesions, which reduces the specificity of MRSI for diagnosing high-grade malignancies [17, 32]. Kwee et al. reported a case in which PET imaging with FCH aided in distinguishing a demyelinating lesion from a suspected high-grade glioma [32].
Hypoxia is the driving force in angiogenesis and it has been shown to be associated with resistance to therapy, poorer survival, and more malignant tumor phenotypes. Cher et al observed FMISO uptake in high-grade gliomas but not in low-grade gliomas. They also found a significant correlation between FMISO uptake and Ki-67 and VEGFR-1 expression [35]. Increased FMISO uptake was also demonstrated to be associated with shorter survival in this patient population [35, 36]. FMISO PET provides a noninvasive assessment of hypoxia in gliomas and is prognostic for treatment outcomes in a majority of patients.
Tumor Delineation for Surgery and Biopsy Planning
FDG PET has limited application in delineation of gliomas. Although distribution FDG has been demonstrated to correlate with tumor borders and histological anaplasia, both AA radiotracers and FLT PET demonstrated better tumor delineation compared to FDG PET [12, 16, 24, 30, 33, 34].
Many studies have demonstrated that the margins of both low- and high-grade brain tumors assessed by MET uptake, are frequently wider than the anatomic boundaries demonstrated by MRI [10, 38–40]. Miwa et al. found that in 100 % of 10 cases, the area of abnormal MET uptake (MET area) was larger than the gadolinium-enhancing area (Gd area). In 90 % of cases, the MET area was located within a 3-cm radius of the Gd area, and the distance was positively correlated with tumor size. In 100 % of the 10 cases, the area of T2 prolongation surrounding the tumor was larger than the MET area, suggesting that peritumoral edema extends beyond the margins of the neoplasm. MET uptake has been reported to correlate with histological tumor spread and to provide a better definition of the true extent of gliomas than CT or MRI [38].
Image guidance with PET scan has been proved to provide independent and complementary information to assess tumor extent and plan tumor resection better than with anatomical imaging guidance alone [10, 29, 31, 38–42]. Pirotte et al. demonstrated that final target contours defined with FDG and MET PET were different from those obtained with MRI alone. Complete resection of the area of increased PET tracer uptake has been demonstrated to prolong the survival of patients with high-grade glioma. Removal of the MRI contrast enhanced area was not correlated with a significantly better survival [39]. Tanaka demonstrated that the addition of MET PET to navigation systems was more effective than the conventional navigation system to decrease the mass of the tumor remnant in the resectable portion of the tumor. They reported that multimodality navigation system-guided surgery benefited patient survival significantly more than the conventional navigation-guided surgery [40].
Although the data is limited, similar results have been published for FET for delineation of the extent of gliomas. Ewelt et al. used FET PET and MRI coregistered data to guide neuronavigated biopsies before resection. FET uptake correlated with biopsy results in 86 % of 17 patients with high-grade gliomas, whereas with Gd enhanced MRI it was only 57 %. In biopsies corresponding to 13 patients with low-grade gliomas, FET was positive in 41 % (7/17), and Gd scans were negative in all but one instance [41]. Stadlbauer et al. demonstrated a correlation between tumor invasion and FET uptake with stereotatic biopsies. They concluded that their findings may help to distinguish between edema versus tumor-associated neurological deficits and could prevent the destruction of important structures during tumor operations by allowing more precise preoperative planning [42].
In addition to poorly defined borders, another characteristic feature of glial tumors is their heterogeneous nature, with frequent geographic variation of tumor grade. Stereotactic biopsies of localizations that are based on PET seem to be more successful to find accurate brain tumor tissue than are biopsy tractories based on CT or MRI [18, 26, 31–33, 38]. Herholz et al. found that cell density, but not nuclear polymorphism, correlated significantly with FDG uptake in both – and high-grade gliomas [43]. MET uptake was shown to directly correlate with tumor viability, endothelial proliferation, and mitotic activity [10–12, 14, 16, 34, 43]. Decreased MET uptake in necrotic parts and high uptake in anaplastic parts of the tumor tissue has been assumed to improve the results of brain tumor biopsies [34]. Similar results have been published for DOPA and FET PET, which have been demonstrated to be superior to FDG-PET for biopsy guidance and treatment planning in both low- and high-grade gliomas [8, 20, 21, 24, 25, 27]. Although FLT PET is unable to identify the margins of gliomas, an increase in FLT uptake was found to correlate with contrast enhancement seen on MRI, and the maximum uptake of FLT correlated with the highest MIB-1 labeling index within the tumor [24, 27–30]. Planning of biopsy trajectories has been improved with the use of FLT, particularly in low-grade astrocytomas [24, 27–30].
Tumor Delineation for Radiotherapy and Radiosurgery Planning
Radiation therapy (RT) improves survival in high-grade gliomas but most patients relapse, usually within the radiation fields. This is thought to be due to uncertainties in target delineation and difficulties in identifying radioresistant regions for dose escalation. Coregistration of PET has been demonstrated to enable the visualization of the metabolically active components of brain tumors during planning for RT and radiosurgery (RS) [44–48]. Koga et al. reported that coregistration of FDG PET, MRI and diffusion-tensor tractography decreased the treated volume and the maximal dose to the white matter tracts [44].
PET based on AA tracers is currently the best choice, and the most data are available for the use of MET in radiation treatment planning [45, 46]. Grosu et al. reported that of the 39 patients undergoing RT planning for malignant gliomas after surgical resection, 74 % had a MET defined tumor volume larger than the contrast-enhanced T1-weighted MRI-defined volume. The region of increased MET uptake extended up to 45 mm beyond the Gd enhanced area. They reported that patients with high-grade gliomas who were reirradiated using MET-PET in the treatment planning had statistically significant longer survival times in comparison to patients whose treatments were based on MRI/CT alone [45].
Similar results were reported for FET, the size and geometrical location of tumor volume defined with FET PET was different than the tumor volume described with MRI in 100 % of 19 patients [47]. Weber et al. reported that using biological and morphological target volumes during the RT planning process a 66 % reduction in non-central tumor failure could be achieved [48].
Hypoxia is one of the resistance mechanisms to the cytotoxic therapies such as chemotherapy and radiation. Preliminary clinical data suggest that FMISO PET images provide a spatial description of hypoxia in brain tumors that is independent of blood–brain barrier disruption and tumor perfusion. Since hypoxic tissue is relatively resistant to radiation therapy, perfusion–hypoxia patterns may lead to a better prediction of treatment response in patients with gliomas [35, 36].
Monitoring Treatment Response and Diagnosis of Recurrence
After intensive irradiation or chemotherapy for brain tumors, the basic assumption for imaging is to visualize the biological activity of the tumor. Early detection of recurrent or residual tumor is of particular interest since the treatment course will be changed if residual or recurrent tumor is present.
Conventional imaging strategies can be nonspecific and not a direct measurement of tumor activity [49–54]. Since PET activity reflects tumor metabolic activity, using PET to guide treatment and assess residual recurrent tumor has been demonstrated to be helpful to differentiate between tumor and nonspecific postoperative changes [49–54]. Increased FDG uptake after treatment is compatible with residual high-grade tumor (see Fig. 8.3). In a study of 47 patients with primary and metastatic brain tumors who underwent stereotactic radiosurgery, Chao et al. found FDG PET to have a sensitivity of 75 % and specificity of 81 % for differentiating recurrent tumor from radiation necrosis [49].
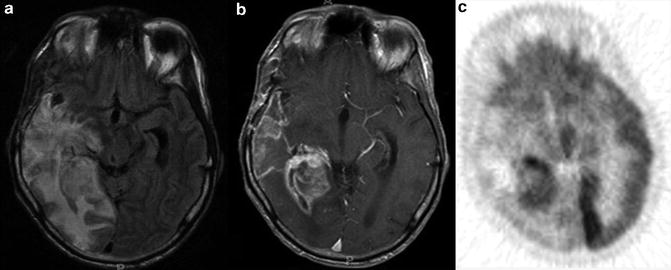
Fig. 8.3
A glioblastoma multiforme was removed surgically and followed with radiation therapy. (a) The signal hyperintensities on the T2–FLAIR MRI overestimate the real tumor size by also delineating perifocal but nontumoral changes, (b) The T1-MRI with Gd shows the contrast-enhancing area and seems to underestimate the tumor size, (c) A FDG-PET image demonstrates the metabolically active part of the tumor, which is essential for biopsy or for following the response to treatment. The entire cortex and the adjacent gray matter structures appear hypometabolic, which suggests edema in the adjacent cortex
The feasibility and usefulness of MET PET for of assessment of response to therapy have been demonstrated in several studies. A stable or decreased MET uptake is seen in patients with no evidence of disease or stable disease; an increased uptake is seen in patients with progressive disease (see Fig. 8.4). Compared to MRS, MET PET has been demonstrated to be a powerful tool for diagnosis of recurrent tumor [50]. MET PET was able to differentiate tumor recurrence from necrosis in 4 of 9 patients with elevated Choline on MRS [50]. Van Laere et al. demonstrated pathologically increased MET uptake in 28 of 30 patients and FDG uptake in 17 of 30 of the same patients with recurrence or progression of primary brain tumors after previous therapy, and they considered MET the agent of choice because of its high sensitivity and clearer delineation of the suspected recurrence [51].
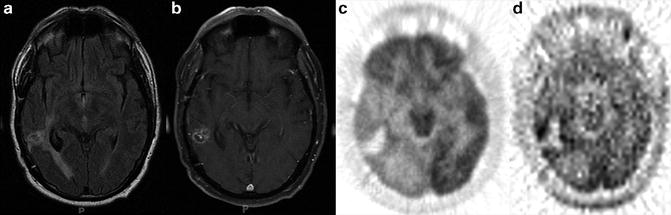
Fig. 8.4
A glioblastoma multiforme was treated with radiosurgery, (a) The T2–FLAIR image reveals edema, (b) The T1-MRI with Gd is not specific for residual or recurrent tumor, (c) FDG-PET images demonstrate mild FDG uptake around the treated tumor bed, which also is not specific for residual or recurrent tumor, (d) [11C]Methionine (MET) PET images demonstrate increase MET uptake around the tumor bed, which indicates a metabolically active tumor
Similarly, FET PET has been demonstrated to be a sensitive tool to predict treatment response after radiation and chemotherapy. Piroth et al. that a decrease in FET uptake significantly correlated with a longer median disease-free survival and overall survival in patients with glioblastoma after radiochemotherapy [52]. FET uptake has been reported to represent an early indicator of response to chemotherapy in low-grade gliomas. The authors concluded that the assessment of response based on only MR should be reconsidered [53].
Related posts:
 DTI for Presurgical Mapping
 BOLD fMRI for Presurgical Planning: Part I
 Role of Amide Proton Transfer (APT)-MRI of Endogenous Proteins and Peptides in Brain Tumor Imaging
 Diffusion Tensor Imaging: Introduction and Applications to Brain Tumor Characterization
 Proton Magnetic Resonance Spectroscopy and Spectroscopic Imaging of Primary Brain Tumors
 Ultra-High Field MRSI (7T and Beyond)
Stay updated, free articles. Join our Telegram channel

Full access? Get Clinical Tree


