(2.1)
where S is the diffusion-weighted signal, S 0 is the signal without diffusion weighting, and D is the estimated diffusivity or apparent diffusion coefficient (ADC). Acquiring diffusion-weighted images with at least two different b values allows the determination of the diffusivity for each image voxel.
In white matter, diffusion is anisotropic, as axonal membranes and myelin sheaths restrict and/or hinder this molecular motion in a particular direction. Apparent diffusivity of water is generally higher in directions parallel to fiber tracts than in the perpendicular direction [12]. Three-dimensional probability distribution of diffusivity can be described by a diffusion tensor ellipsoid with three eigenvectors and the corresponding eigenvalues (λ1, λ 2, and λ 3). The eigenvector associated with the largest eigenvalue denotes the predominant orientation of fibers in a given imaging voxel. If a particular voxel has a high degree of anisotropy, one of the eigenvalues will be much higher than the other two.
Most commonly used indices for diffusion tensor are mean diffusivity (MD) and fractional anisotropy (FA) [13], which can be calculated according to (2.2) and (2.3), respectively:
where  denotes mean of the three eigenvalues. MD is a measure of the directionally averaged magnitude of diffusion and is related to cell density, size, and parenchyma permeability. FA represents the degree of diffusion anisotropy, and reflects the degree of alignment of cellular structure [13].
(2.2)
(2.3)
denotes mean of the three eigenvalues. MD is a measure of the directionally averaged magnitude of diffusion and is related to cell density, size, and parenchyma permeability. FA represents the degree of diffusion anisotropy, and reflects the degree of alignment of cellular structure [13].Although FA is a good indicator of diffusion anisotropy, it does not provide information on the shape of the diffusion ellipsoid. For example, it cannot distinguish a flat ellipsoid from an oblong one. Westin et al. [14] have modeled diffusion anisotropy using a set of three basic metrics that depend on the shape of the diffusion tensor: linear anisotropy coefficient (CL) where diffusion is mainly along the direction corresponding to the largest eigenvalue; planar anisotropy coefficient (CP) where diffusion is mainly restricted to the plane spanned by the two eigenvectors with the two largest eigenvalues; and spherical anisotropy coefficient (CS), which indicates isotropic diffusion. The CL, CP, and CS values can be calculated using the following equations:
(2.4)
(2.5)
(2.6)
The CL, CP, and CS values lie in the range from 0 to 1 and the sum of these three metrics is equal to 1 (Fig. 2.1).
Fig. 2.1
Three shapes of diffusion ellipsoid
Each anisotropy measure shows unique features in different regions of white matter. These differences arise from the relative contribution of the linear, planar, and spherical shape components of the diffusion tensor. Linear ellipsoid is typically found in regions with parallel arrangement, such as corpus callosum and pyramidal tract. Planar ellipsoid corresponds to regions of fibers with different orientations, or bundles of fibers that are randomly oriented in a plane, such as centrum semiovale and subcortical white matter regions. The gray matter appears isotropic with high CS [15]. These studies suggest that tensor shape measurements allow one to explore the tissue microstructural difference.
Application to Brain Tumor Characterization
Water diffusion is affected by tissue constitutes, such as macromolecules, membranes, and organelles, as well as by tissue microstructure and organization. From the metrics derived from DTI, one can infer information about the brain tissue that cannot be obtained using conventional MRI. In brain tumors, microstructural tissue characteristics vary significantly between tumor types, including the cellularity, presence of tumor necrosis, fibrous tissue within tumors, tumor infiltration, and so forth. DTI is a promising tool for detecting such microscopic difference in tumors.
Most of DTI studies in brain tumors focused on the analysis of different parts within the tumor using various DTI metrics. But it is often helpful to measure reactive and infiltrative changes in the tissue surrounding the tumor. The neoplastic mass can be generally subdivided into two regions: the solid part of the tumor and central necrotic or cystic part of the tumor. Similarly, the peritumoral edematous region can be separated into two regions: proximal region surrounding the enhancing part of the tumor potentially including infiltrative tumor cells, and more distal region mainly comprising vasogenic edema. These four subregions of a neoplasm can be substantially different from each other in terms of their DTI metrics. A variety of methods to analyze diffusion information have been proposed and range from simple mean/median value to histogram analysis over the selected regions of interest (ROIs). Systematic analysis of various DTI metrics including tensor shape measures from these different areas may provide a robust way for characterization of brain neoplasms.
Mean Diffusivity and Tumor Cellularity
Of all the histologic features used in tumor classification, cellularity has been the main target of assessment with DTI. MD measures the magnitude of diffusion within cerebral tissues. The higher the tumor cellularity, the lower the MD value due to decrease in the extracellular space (i.e., increased hindrance to extracellular water diffusion, assuming that the intracellular water diffusion is restricted) [12, 16]. This inverse correlation between MD and cellularity has been reported in both glial [9] and nonglial tumors [17].
MD values have been used in differentiating tumor grades [7, 8, 18, 19] and types [8, 20–22], however, with mixed results. Some reports have suggested that mean MD [20, 23, 24], minimum MD [7] [25], or MD ratio [18, 19] is helpful for grading and tumor differentiation, while others indicated the limited use of MD in the differentiation of neoplasms [8, 26–28]. Those studies in which MD was found useful have generally observed lower diffusivities in high-grade or more cellular tumors. It has been accepted that primary cerebral lymphomas and medulloblastomas have lower MD values because of densely packed cells in these tumors [8, 17]. Also atypical or malignant meningiomas were found to have lower MD values compared with typical meningiomas [18, 19, 29]. However, MD itself is very limited in ++ tumor classification with low sensitivity and specificity [21, 22]. Besides cellularity, other factors such as extracellular matrix, viscosity, and mucins may also affect the measurement of MD [30, 31].
MD has also been used to monitor tumor treatment response. In most malignant tumors, successful treatment is reflected by increases in MD values. This may be due to the cellular death and vascular changes in response to treatment. Results from animal models [32] and clinical studies [33] provide supportive evidence for the use of MD as a responsive biomarker. A novel method called functional diffusion mapping (fDM) has been introduced to map voxel-by-voxel changes of apparent diffusivity over time [2, 34].
Diffusion Anisotropy of Tumor
FA is the most commonly used anisotropy index. FA reflects the degree of alignment of tissue microstructure, and as such its use may not be limited to the white matter tracts alone [12]. Regions of relatively high anisotropy have been reported in brain abscesses [35], glioblastomas [36, 37], and areas of hemorrhage [38], indicating that the tissues other than the white matter can also have preferentially oriented structures.
In contrast to MD, the relationship between FA and tumor cellularity is unclear, as both positive [36, 37, 39] and negative [9, 40] correlation has been reported. While Inoue et al. [41] stated that FA values of low-grade gliomas were significantly lower than those of high-grade gliomas, Stadlbauer et al. [9] reported lower FA values in high-grade gliomas. A recent study reported that mean and maximal FA from the solid part of the tumor are useful in grading nonenhancing gliomas [26]. For tumor type differentiation, Wang W et al. [42] and Reiche et al. [43] reported lower FA from the enhancing regions of glioblastomas compared with brain metastases, whereas Wang S et al. [22] observed higher FA in the enhancing regions of glioblastomas than in those of metastases. One likely reason for these contradictory results is the lack of standardized methods, both for acquisition as well as postprocessing and selection of ROI. It has also been demonstrated by Wang et al. [21] that FA in glioblastomas is higher than that in both brain metastases and primary cerebral lymphomas (Figs. 2.2, 2.3, 2.4, and 2.5). Among these three tumor types, lymphomas have the highest cellularity, followed by glioblastomas and brain metastases [44–46]. These findings indicate that diffusion anisotropy may not directly correlate with tumor cellularity. It has been reported that FA of tumor can be affected by several factors including extracellular-to-intracellular space ratio, extracellular matrix, tortuosity, and vascularity [30, 31]. Further study is warranted to help understand the underlying tumor microstructure contributing to FA.
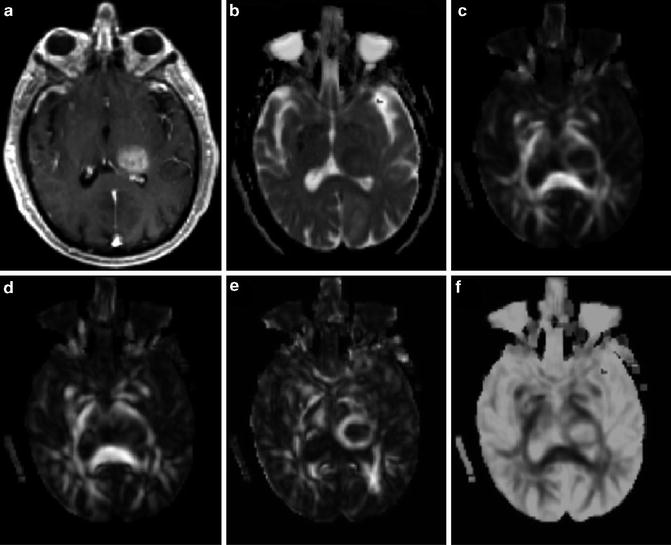
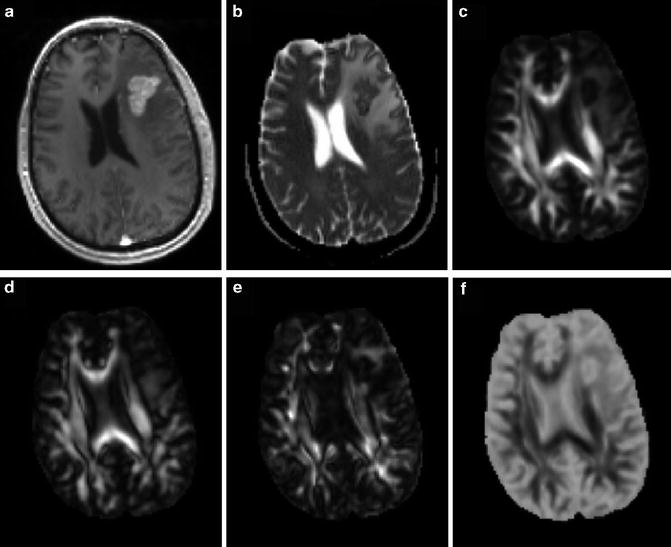
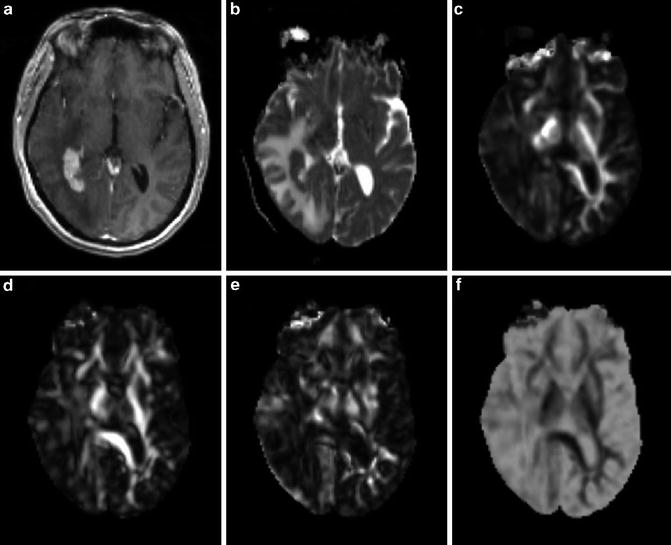
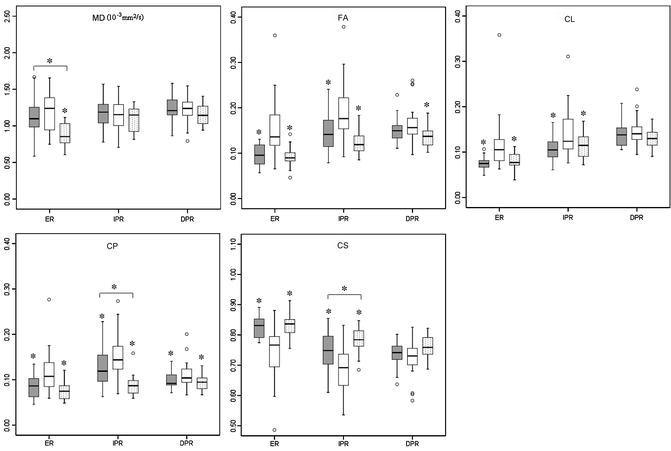
Fig. 2.2
A 71-year-old male with a glioblastoma in the left thalamus. Axial contrast-enhanced T1-weighted image (a) shows solid enhancement. MD map (b) shows restricted diffusion of the enhancing part (0.75 × 10⁻³/mm2/s). FA (c), CL (d), and CP (e) from the enhancing part (0.18, 0.15, and 0.15, respectively) are higher than those for brain metastasis (Fig. 2.3) and primary cerebral lymphoma (PCL, Fig. 2.4). CS (f) from the enhancing portion (0.68) is lower compared with brain metastasis and PCL. Reprinted and modified with permission from Wang et al. [21]
Fig. 2.3
A 53-year-old male with metastatic lung adenocarcinoma in the left frontal lobe. Axial contrast-enhanced T1-weighted (a) shows a solid enhancing lesion. MD map (b) shows restricted diffusion of the enhancing part (0.95 × 10⁻³/mm2/s). Lower FA (c), CL (d), and CP (e) are noticed from the enhancing part (0.10, 0.08, and 0.09, respectively) relative to normal-appearing white matter compared with the glioblastoma. CS (f) appearance looks similar to glioblastoma (Fig. 2.2f), but has a higher value (0.82)
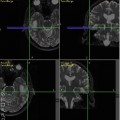
Fig. 2.4
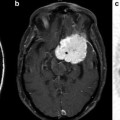
A 58-year-old female with primary cerebral diffuse large B cell lymphoma in the right peritrigonal area. Axial contrast-enhanced T1-weighted (a) shows a solid enhancing lesion with extensive edema. MD map (b) shows restricted diffusion of the enhancing part (0.80 × 10⁻³/mm2/s). Lower FA (c), CL (d), and CP (e) are noticed from the enhancing part (0.08, 0.08, and 0.06, respectively) relative to normal-appearing white matter compared with the glioblastoma. CS (f) from the enhancing part appears higher (0.85) compared with glioblastoma
Fig. 2.5
Box plots of diffusion characteristics in brain metastases (gray), glioblastomas (white), and primary cerebral lymphomas (PCLs, dotted). The solid line inside the box represents the median value, while the edges represent the 25th and 75th percentiles. Straight line (bars) on each box indicates the range of data distribution. Circles represent outliers (values more than 1.5 box length from the 75th/25th percentile). *Above gray or dotted box indicates significant difference (p < 0.05) for glioblastomas vs. metastases or glioblastomas vs. PCLs, respectively. *Above a horizontal line between gray and dotted boxes indicates significant difference (p < 0.05) between metastases and PCLs. ER: enhancing region. IPR: immediate peritumoral region. DPR: distant peritumoral region. Reprinted and modified with permission from Wang et al. [21]
Shape-Based Diffusion Tensor Metrics
Information on the geometric nature of diffusion tensor provides further differentiation of tumor types based on tensor shape in addition to FA [14, 15, 47]. Both CL and CP values contribute to FA observed in tissue and their relative values indicate the shape of diffusion ellipsoid [15]. Anisotropy changes within and surrounding the tumor have been demonstrated in animal studies, indicating that tensor shape is related to the macroscopic organization of tumor cells [48–50]. The types of the tumor, the degree of invasiveness, and growth rate can affect the diffusion properties [49, 50]. Tensor shape measurements have also been used to characterize pathologic changes in the human brain. Zhang et al. [47] reported lower CL in brain metastases than in contralateral normal brain. Elevated FA and CP along with decreased CS were observed in fibroblastic meningiomas compared with other subtypes of meningiomas [29, 51, 52]. Kumar et al. [53] reported high CP and low CL in the abscess cavity compared with normal white matter, thus distinguishing true from pseudo white matter tracts. It has also been reported that epidermoid cysts have high CP [54] and tuberculomas showed lower CL, CP, and higher CS [55] compared with normal white matter. Wang et al. [21] also demonstrated higher FA, CL, and CP from the enhancing part of glioblastomas in comparison to both brain metastases and primary cerebral lymphomas (Figs. 2.2, 2.3, 2.4, and 2.5). These results suggest that tensor shape measurements provide additional information about tissue characteristics, which may further aid in tumor classification.
DTI and Tumor Infiltration
Peritumoral region is usually defined as the area of abnormality surrounding the enhancing part of the tumor. In metastatic brain tumors or noninfiltrative primary tumors such as meningiomas, peritumoral edema is widely regarded as vasogenic edema. In this region, increased extracellular water is present due to leakage of plasma from altered tumor capillaries. Also this region does not include any tumor cells. In gliomas, however, the peritumoral region includes both vasogenic edema and infiltrating tumor cells.
Investigators have tried to use DTI to differentiate tumor-infiltrated edema from pure vasogenic edema [20, 22, 24], which may be beneficial for accurate preoperative diagnosis of glioblastomas and metastases. Lu et al. [20] reported a significant difference between tumor-infiltrated edema and pure vasogenic edema using a parameter called “tumor infiltration index,” which measures departure from a linear relationship between MD and FA. These authors also reported higher MD in metastasis compared to glioblastomas. However, other studies demonstrated lower MD and minimum MD or MD ratio in the peritumoral region of metastases compared to that of glioblastomas [24, 56]. In contrast, van Westen et al. [57] reported no difference in MD and FA values in the peritumoral region of glioblastomas, metastases, and meningiomas. Recently, Kinoshita et al. [58] claimed that “tumor infiltration index” could not differentiate vasogenic edema from tumor-infiltrated edema. The difference in defining the ROIs for the peritumoral region in these studies may in part be responsible for the discrepancy. A number of studies have focused on the area close to the enhancing region (peritumoral region) either by manually placing a number of small ROIs around the tumor [23, 24] or by using a band of arbitrarily chosen thickness around the tumor [28, 59]. In the study reported by Wang et al. [22
 Imaging Metabolic and Molecular Functions in Brain Tumors with Positron Emission Tomography (PET)
 BOLD fMRI for Presurgical Planning: Part II
 BOLD fMRI for Presurgical Planning: Part I
 Role of Amide Proton Transfer (APT)-MRI of Endogenous Proteins and Peptides in Brain Tumor Imaging
 Proton Magnetic Resonance Spectroscopy and Spectroscopic Imaging of Primary Brain Tumors
 Ultra-High Field MRSI (7T and Beyond)


Related posts:
Imaging Metabolic and Molecular Functions in Brain Tumors with Positron Emission Tomography (PET)
BOLD fMRI for Presurgical Planning: Part II
BOLD fMRI for Presurgical Planning: Part I
Role of Amide Proton Transfer (APT)-MRI of Endogenous Proteins and Peptides in Brain Tumor Imaging
Proton Magnetic Resonance Spectroscopy and Spectroscopic Imaging of Primary Brain Tumors
Ultra-High Field MRSI (7T and Beyond)
Stay updated, free articles. Join our Telegram channel
Full access? Get Clinical Tree
