(1)
where APTR is the APT ratio, calculated by the following equation:
![$$ {\rm APTR}=\frac{k[{\rm amide}\kern0.17em {\rm proton}]}{[{\rm water}\kern0.17em {\rm proton}]{{\rm R}}_{1\mathrm{w}}}(1-{{\rm e}}^{-{R}_{1\mathrm{w}}{t}_{{\rm sat}}}), $$](/wp-content/uploads/2016/04/A191776_1_En_10_Chapter_Equ2.gif)
(2)
APT Imaging of Gliomas in Preclinical Models
APT imaging was first applied to an intracranial glioma rat model in 20038,248,24 by Zhou et al. [8, 25]. Figure 1 shows the imaging features of conventional MRI and APT imaging in 9L gliosarcomas (Fig. 1a) and human glioblastoma xenografts (Fig. 1b) implanted in the rat brain. In both tumor models, due to higher water content, the tumor masses are hyperintense on T2, T1, and apparent diffusion coefficient (ADC) images and hypointense on MTR images compared to contralateral normal brain. On the APT images, the tumor mass can be clearly identified as hyperintensity with a distinct separation from the peritumoral edema and adjacent white matter. The quantitative results indicate that APT contrast between the tumor core and contralateral brain tissue is about 3.9 % of water intensity (1.5 % ± 0.7 % vs. −2.4 % ± 0.2 %) for 9L gliosarcomas (Fig. 1a). This contrast reduces to 1.6 % (−1.2 % ± 0.6 % vs. −2.8 % ± 0.4 %) for the human glioblastoma xenografts (Fig. 1b). It should be noted that hyperintense (T2, T1, ADC) or hypointense (MTR) regions on conventional MR images are generally larger than those on the APT image. These regions may be associated with peritumoral edema, which is a common finding in brain tumors. Although the tumor mass is visible in all of the MR images, the tumor contour is much clearer in the APT images compared to conventional MR images. The hyperintense regions on the APT images have good correspondence with hematoxylin and eosin (H&E)-stained tumor sections. 9L gliosarcomas reveal a homogeneous mass from the tumor core to the boundary. High-density spindle-shaped tumor cells can be observed in the tumor core without necrosis or cystic changes. Human glioblastoma xenografts contain necrotic zones surrounded by a pseudopalisading rim, which is a hallmark of highly aggressive human glioblastomas. These regions of necrosis are distinctly absent from the 9L gliosarcomas. These results indicate that the APT imaging is able to identify the most active components in glioma animal models and to differentiate the tumor core from the adjacent peritumoral edema and normal-appearing white matter.
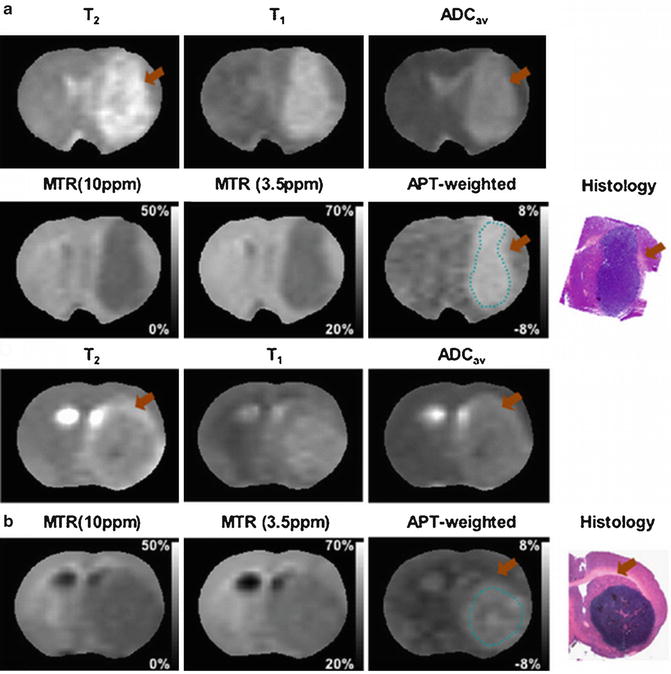
Fig. 1
Examples of MR images and histology for 9L gliosarcoma (a) and human glioblastoma xenograft (b) models. On the APT images, both tumors show hyperintense lesions compared to contralateral normal brain. The APT images appear to more accurately identify the tumor contour compared to conventional MRI. Some T2-hyperintense regions (orange arrow) are white matter edema, not a tumor mass. Histology confirms higher cellularity of tumor cells in the 9L gliosarcoma and necrosis in the human glioblastoma xenografts (reproduced, with permission, from Salhotra A, et al. NMR Biomed. 2008;21:489–497)
APT Imaging of Gliomas in Patients
The primary goal of the treatment of malignant gliomas is maximizing tumor removal while minimizing damage to surrounding brain tissue to preserve neuronal function. Optimal neurosurgery and radiotherapy rely on accurate information of the local extent of a tumor and its infiltration into the brain parenchyma. These factors determine the treatment strategy. For example, radiotherapy is delivered to the gross tumor volume with a 2–3-cm margin for the clinical target volume [25]. Therefore, one of the major goals of brain tumor imaging is tumor localization and infiltration characterization [26]. Microstructural tissue characteristics in malignant gliomas vary significantly. Pseudopalisading necrosis is a neuropathological hallmark of glioblastoma multiforme. Typically the necrotic lesion is surrounded by radially arranged anaplastic cells along with tumor cell infiltration, vascular or cytotoxic edema, and reactive gliosis in the peritumoral edema [27]. These components in malignant brain tumors modify the sensitivity to ionizing radiation, affecting the prognosis. It has been indicated that the overall survival time after radiotherapy for brain tumors is decreased by 27 % in patients with necrosis compared with the patients without necrosis [28]. Therefore, determination of cellular components is another major aim of brain tumor imaging.
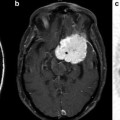
Preliminary clinical investigations have shown the potential advantages of APT imaging to identify the histological components of gliomas and determine the relationships between the tumor core and adjacent structures, such as peritumoral edema and normal-appearing white matter [10–12]. Figure 2a shows MR images for a 35-year-old man with a glioblastoma in the left frontal lobe. Both the Gd-enhancing tumor core (red arrow) and the cystic cavity (black arrow) have hyperintense signal characters on APT imaging. The mean APT signal intensities in the tumor core are significantly higher than in the necrotic regions (3.8 % ± 0.5 % vs. 2.9 % ± 0.6 %, p = 0.004). In this example, peritumoral edema and adjacent normal-appearing white matter have isointense APT signal intensities compared to contralateral normal brain, and can be easily distinguished from the hyperintense tumor core. Quantitative analysis of the APT signal intensities in a cohort of high-grade gliomas (n = 12) are shown in Fig. 2b. The results indicate that APT signal intensities in the tumor core are significantly higher than those in the necrosis (p = 0.004), peritumoral edema (p < 0.001), and ipsilateral and contralateral normal-appearing white matter (both p < 0.001) [11]. APT imaging in combination with standard MRI techniques may help to determine the heterogeneous pathological components in malignant brain tumors, which may provide valuable information for preoperative planning and treatment guidance.
Fig. 2
(a) Example of clinical APT imaging of glioblastoma. Tumor core (red arrow) and cystic cavity (black arrow) show APT hyperintensity, compared to the contralateral brain tissue. Necrosis (pink arrow) also shows APT hyperintensity, while peritumoral edema (orange arrow) has very limited APT signal enhancement compared to normal white matter. (b) Quantitative analysis of the APT signal intensities (n = 12). (I) tumor core; (II) necrosis; (III) cystic component; (IV) immediate edema; (V) peritumoral edema; (VI) ipsilateral normal-appearing white matter; (VII) contralateral normal-appearing white matter. The APT intensity is the percentage of the bulk water signal (reproduced, with permission, from Wen Z, et al. NeuroImage 2010;51:616–622)
Another important clinical application of brain tumor imaging is tumor grading. A suite of MR methods, such as T1-weighted image, T2-weighted image, and Gd-T1-weighted image, are applied as a mainstay for glioma grading. However, Gd enhancement is not always specific for tumor grading as some low-grade gliomas enhance occasionally, such as pilocytic astrocytomas [4], whereas approximately 10–30 % of high-grade gliomas have no Gd enhancement [2, 3]. Pilot clinical studies show that APT imaging provides quantitative information that may assist in the grading of gliomas [10–12]. Figure 3 shows MR images for a patient with low-grade glioma (grade II) in the left frontal lobe. The mass has typical MRI features of hyperintensity on T2-weighted and FLAIR images, hypointensity on T1-weighted and MTR images, and no enhancement on the Gd-T1-weighted image. On the APT image, the tumor core is isointense when compared to the contralateral normal brain, which is distinctly different from the typical high-grade glioma appearance (Fig. 2). Zhou et al. quantitatively analyzed the APT signal intensities in the tumor core between high-grade gliomas (n = 6) and low-grade gliomas (n = 3) [12]. APT signal intensities of high-grade gliomas were significantly higher than in the contralateral normal-appearing white matter (p = 0.008), while they were similar to contralateral normal-appearing white matter (p = 0.8) in low-grade gliomas. There were significantly positive correlations between signal intensities of APT imaging and tumor grade (p = 0.004).
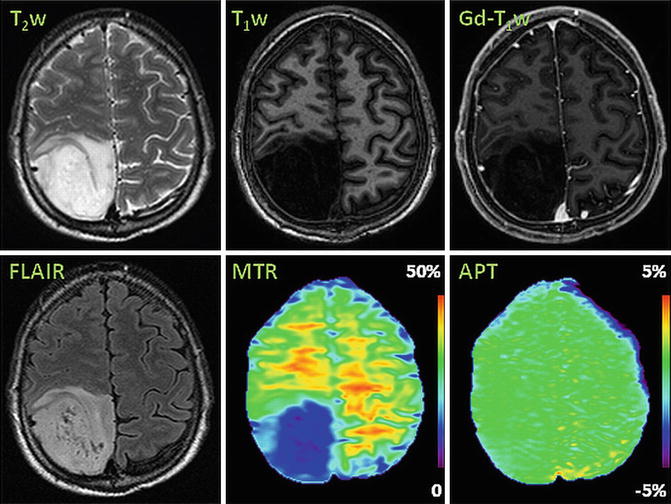
Fig. 3
Example of APT imaging of low-grade glioma (grade II). APT image shows isointensity in the lesion with respect to the contralateral normal brain
Differentiation Between Radiation Necrosis and Gliomas in Preclinical Animal Models
Radiotherapy is frequently recommended as a part of standard care for the management of malignant gliomas [25]. The efficacy of radiotherapy is limited by the fact that it not only kills the tumor cells, but it also frequently injures normal brain tissue. The incidence of biopsy-proven radiation necrosis has been reported to be as high as 24 % [29]. Radiation necrosis and tumor recurrence cannot be reliably differentiated by conventional MRI because both are associated with edema, contrast enhancement due to the BBB disruption, and mass effects [30, 31]. There are numerous ongoing investigations into the ability of functional and molecular imaging techniques to assess tumor tissue properties and treatment effects [32–35]. The cardinal pathological features of radiation necrosis include coagulative necrosis with loss of normal brain tissue, and vascular hyalinization or fibrinoid deposition [29, 36, 37], leading to loss of mobile proteins and peptides. On the contrary, active gliomas typically consist of a solid tumor mass with high cellular density, as well as highly aggressive tumor cells infiltrating into adjacent brain tissue [38], resulting in higher expression of mobile proteins and peptides [39, 40]. APT imaging, thus, may have advantages to resolve this diagnostic dilemma in neuro-oncology.
Figure 4 shows MR images and H&E-stained histopathological sections of radiation necrosis, SF188/V + human glioma, and 9L gliosarcoma in a rat model [41]. The radiation necrosis was produced using a small animal radiation research platform [42]. These animals received a single, well-collimated X-ray beam in the left hemisphere (single dose of 40 Gy; 10 × 10 mm2 region) under the planar fluoroscopic image guidance. Radiation necrosis was confirmed with the enhancement on the Gd-T1-weighted image (Fig. 4a, black solid arrow). On the APT image, the lesion was isointense to hypointense compared to contralateral normal brain. Histological evaluation revealed coagulative necrosis with loss of normal brain tissue in the necrotic center as well as dilated vessels (white arrows) in the peri-necrotic regions. Both SF188/V + (Fig. 4b, pink open arrow) and 9L gliosarcomas (Fig. 4c, red open arrow) showed obvious Gd enhancement, which was indistinguishable from radiation necrosis (Fig. 4a). On the APT images, both tumors showed hyperintense tumor cores. Quantitative analysis of APT signal intensities on radiation necrosis and experimental gliomas is shown in Fig. 4d, where APT signal intensities of SF188/V + human gliomas and 9L gliosarcomas are significantly higher than those for the radiation necrosis and contralateral brain tissue (all p < 0.001). It can be concluded that APT imaging shows a distinct imaging pattern that can be used to distinguish between these two pathologies.
Fig. 4
APT imaging differentiation of radiation necrosis and glioma in a rat tumor model. (a) Radiation necrosis has isointense to hypointense signal characters on the APT image. Histology confirms that coagulative necrosis and vacuolation changes (black arrowhead), as well as dilated damaged vessels (white arrowhead), are the major pathological changes for this necrosis. On the contrary, SF188/V + human glioma (b) and 9L gliosarcoma (c) have hyperintense ATP signals, which can be distinguished from radiation necrosis. (d) There are opposite APT signal intensities between the radiation necrosis and gliomas (n = 9 each group) (reproduced, with permission, from Zhou J, et al. Nature Med. 2011;17:130–134)
Assessment of Brain Cancer Treatment Response
Related posts:
 Imaging Metabolic and Molecular Functions in Brain Tumors with Positron Emission Tomography (PET)
 BOLD fMRI for Presurgical Planning: Part II
 BOLD fMRI for Presurgical Planning: Part I
 Diffusion Tensor Imaging: Introduction and Applications to Brain Tumor Characterization
 Proton Magnetic Resonance Spectroscopy and Spectroscopic Imaging of Primary Brain Tumors
 Ultra-High Field MRSI (7T and Beyond)
Stay updated, free articles. Join our Telegram channel

Full access? Get Clinical Tree


