Pulmonary Perfusion Imaging with MR
Sebastian Ley, MD
▪ Introduction
The main task of the lung is establishing a highly effective gas exchange. For this purpose, ventilation and perfusion of the lung need to match on a local level. Many conditions, including pulmonary embolism, pulmonary hypertension (PH), chronic obstructive disease, and tumors, alter pulmonary perfusion. Furthermore, pulmonary perfusion changes after surgical lung resection and during physiologic processes, such as change of body position or during physical activity. Therefore, assessment of the pulmonary perfusion is of physiologic and clinical importance. For studying such a large heterogeneous moving organ in detail, techniques providing good to excellent spatial resolution are required. One of these techniques is magnetic resonance imaging (MRI). For more than 20 years, MRI has been available as a technique for assessment of pulmonary perfusion.1 Given the tremendous technical developments of the recent years regarding hardware and new sequences, MR-based perfusion imaging became broadly available. Two principal techniques are established: arterial spin-labeling and contrast-enhanced perfusion.2 These two techniques are presented theoretically and within the clinical context.
▪ Non-Contrast-Enhanced Pulmonary Perfusion
Technique
MR offers the possibility to mark a specific part of spins magnetically by selective radiofrequency (RF) excitation, leading to a specific magnetization to a selected fraction of blood. This technique is called arterial spin labeling (ASL) and requires no intravenous application of contrast material and is therefore considered to be completely noninvasive.3
In principle, two ECG-gated images of a selected slice (one slice location) are taken 5 to 8 seconds apart during a single apnea.4 Images are acquired in diastole using a pulse sequence. To visualize pulmonary perfusion, the first image is preceded by a slice-selective inversion/saturation RF preparation overlaid on the imaged slice, the effect of which is to minimize the available MR signal in the imaged slice. The preceding saturation pulse is followed by the pulse sequence after one cardiac ejection to bring in unsaturated blood, resulting in a bright-blood image. For the second image, the process is repeated, except that this time the tagging preparation is spatially nonselective, so that blood flowing into the imaged slice has also been subject to the signal minimization (dark-blood image). Subtraction of the dark-blood image from the bright-blood image eliminates signal from any static elements in both images, leaving an image of blood delivered to the slice in one systolic ejection period.5 Most important is that on the subtraction image, the signal from a volume element (voxel) is proportional to the amount of pulmonary arterial blood delivered during the previous heart cycle.3,6,7,8,9,10,11 and 12 In principle, ASL preparation can be combined with many fast data recording techniques. True fast imaging with steady precession (true FISP) sequences in particular has been found to be ideally suited for assessment of pulmonary perfusion.
Specific types of ASL techniques that allow for quantification of regional pulmonary perfusion during a single breath hold are called “flow-sensitive alternating inversion recovery” (FAIR) and “flow-sensitive alternating inversion recovery with an extra radiofrequency (RF) pulse” (FAIRER).13,14 The potential sources of artifacts are cardiac and respiratory motion. Cardiac motion and pulsatile flow of the descending aorta can generate smearing and flow artifacts, respectively. Spatial variation between the control images can lead to ghosting of the blood vessels, and spatial movement between the control and tag images causes the appearance of the adjacent dark-bright pairs of the blood vessels.
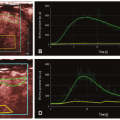
A closely related technique, called the T1 method, has also been used to measure pulmonary perfusion (Fig. 25-1).15,16 Methodologically, this technique is similar to the ASL techniques. It differs primarily in how the experiment is conceptualized—as the delivery of a bolus of tagged spins or as an apparent alteration of the longitudinal relaxation time. Perfusion-weighted images are acquired in a single shot by completely saturating the static background tissue before image acquisition. The decrease of the lung T1 values in the same slice position from the global to the selective experiment is statistically significant and results from the wash-in effect of the noninverted blood water 1H spins outside the imaging slice. Because the perfusion-weighted image is acquired in a single shot, artifacts arising from patient motion or different respiratory levels can be avoided. Furthermore, only very short acquisition times (≤5 seconds per slice) are required for the perfusion-weighted image, facilitating rapid and comfortable examinations. This is especially important for lung imaging, as some patients are not able to hold their breath for more than a few seconds.
 Figure 25-1. Arterial spin-labeling (ASL) image in a healthy volunteer (coronal orientation). The spatial resolution is 3.9 × 3.9 × 10 mm. The major drawback of this technique is low signal-to-noise ratio making a detailed evaluation difficult. |
Lately, a technique called Fourier decomposition (FD) has been proposed for non-contrast-enhanced functional lung MRI.17 This method was implemented on a standard 1.5-T whole-body MR system with an optimized two-dimensional (2-D) balanced steadystate free precession (bSSFP) sequence to produce time-resolved data stacks. Application of image registration combined with Fourier analysis of the data along the temporal dimension allowed for spectral separation of the signal changes caused by lung parenchyma contraction and blood flow.18
The non-contrast-enhanced sequences have the advantage that measurements can be made repeatedly over very short time periods (seconds). The absence of contrast also means that the measurements can be repeated indefinitely as it has not to be cleared out from the blood before reimaging is possible (also, the absolute number of measurements is limited by the total amount of contrast material that can be applied in 1 day). There are some limitations of these techniques: (a) more difficulty in implementation compared with dynamic contrast-enhanced imaging, (b) requirement of a regular cardiac cycle, (c) requirement of single-slice technique and five to eight slices to cover the whole lung, and (d) the limited voxel resolution (i.e., 5 × 5 × 30 mm3).14
Quantification
ASL-based techniques allow for calculation of relative pulmonary blood flow (rPBF) in mL/100 g/min.13,19,20 For conversion of rPBF into PBF, the lung density is required, which is usually assumed to be constant with 0.33 g/mL (at functional residual capacity).21 However, this might not be the case in lung diseases like fibrosis or emphysema. Normal values are reported to be in the range of 5.5 mL/g/min.
Using a rapid IR Snapshot FLASH technique, a spin-labeling method within the imaging slice was used in combination with a simple two-compartment lung tissue model. The measured pulmonary perfusion rates of the healthy lung parenchyma were on the order of 400 to 600 mL/100 g/min, depending on the subject investigated and the actual slice position in the lung.22
In healthy volunteers (n = 6), a quantitative comparison between non-contrast-enhanced and contrast-enhanced techniques was performed.23 Two coronal slices (middle and dorsal part of the lung) were assessed, and maps of rPBF were calculated—no absolute perfusion measures were calculated. By placing 10 regions of interest in each lung, a right-to-left perfusion ratio analysis was performed. For the dorsal slice, the differences between both techniques were not statistically different. The middle position however showed a 16% to 43% underestimation of FAIR-derived rPBF in the right lung. This was explained by tracer saturation for the right lung as the right pulmonary artery is in the plane of both pulses needed for tagging and readout. In an internal control, this difference was not present if slices were acquired in a sagittal orientation.
The Fourier decomposition method was tested qualitatively against gadolinium-enhanced MR perfusion in patients with cystic fibrosis showing a good intrareader agreement between both techniques.24 However, it was shown that the image quality of Fourier decomposition technique was significantly inferior to that of gadolinium-enhanced MR perfusion in patients with non-small cell cancer.25
Application
Based on the strength and limitations noted above, the clinical application so far has been limited. However, the strength of the techniques lies in the ability to study physiologic aspects of the lung perfusion on a regional level.26,27,28 and 29 Important for all perfusion studies is to notice that the signal-to-noise ratio (SNR) of ASL images is low, particularly in the anterior portions of the lung. Therefore, positioning the patient so that the area of interest is down, gravity may increase SNR and improve visibility of perfusion defects. Also, signal intensity and subsequently perfusion increase during examination on end-expiratory breath hold compared to end-inspiratory breath hold.30,31
Normal aging is associated with a decline in pulmonary function and efficiency of gas exchange. The effect of aging on spatial heterogeneity of pulmonary perfusion was studied on 56 healthy, nonsmoking volunteers with an age range of 21 to 76 years.32 Relative dispersion increased significantly with increasing age by 0.1 per decade until age 50 to 59 years, and a significant positive relationship between relative dispersion and age was found. No regional lung density measurements were performed. Therefore, it was not possible to investigate if the age-related parenchymal changes were the cause for this phenomenon. In an early study, Keilholz et al.33 demonstrated the ability of ASL to depict the gravity-dependent perfusion effects. Healthy volunteers were placed inside the scanner on their right and left lateral side, and coronal images were acquired within a 10-s breath hold using a FAIRER HASTE sequence. In both positions, an increase in the intensity of the dependent lung was found (229% for left lateral, 40% for right lateral). No change was seen along an isogravitational plane. These results were confirmed for volunteers lying on their back.16
In six rabbits, a pulmonary emboli model was introduced using a balloon catheter, which was placed in the left pulmonary artery.34 After occlusion of the left pulmonary artery, a set of FAIRER images followed by a contrast-enhanced angiography was performed. The huge perfusion defect (whole left lung) was depicted by both imaging techniques. It has to be noted again that 8 seconds were required for a single slice of ASL, while the 3-D acquisition of the contrast-enhanced perfusion needed 30 seconds. A similar experiment was done in five rabbits where ASL perfusion and ventilation images using hyperpolarized helium-3 were assessed.35 After occlusion of the pulmonary artery by a balloon catheter, the ventilation was unchanged and the ASL perfusion images demonstrated the large perfusion defect.
In patients susceptible to high-altitude pulmonary edema (HAPE), it was possible to demonstrate the uneven hypoxic pulmonary vasoconstriction compared to nonsusceptible patients by assessing the relative dispersion of blood flow.36
Future Developments
Up to now, only few reports exist on the clinical application of non-contrast-enhanced perfusion techniques. Due to the lengthy acquisition times and relatively low signal increase, the clinical usage will be limited in the future. The main application will be in exploration of physiologic processes were the possibility of unrestricted measurements outweighs the prolonged acquisition time.3 It may be the imaging technique of choice for pregnant women to rule out pulmonary emboli. However, in this stetting, other native imaging techniques, like steady-state free precession sequences, also showed a good clinical potential.37 In patients with severely impaired kidney function, application of contrast media should be avoided to reduce the risk of nephrogenic systemic fibrosis (NSF). As this patient population increases, the demand of non-contrast-enhanced techniques for visualization of pulmonary perfusion increases. Thus, this patient population could benefit from future developments within this area.
▪ Contrast-Enhanced MR Perfusion
Technique
Contrast-enhanced lung perfusion is realized by rapid imaging of the first pass of contrast material through the lungs after intravenous bolus injection. To visualize the peak enhancement of the lungs, the temporal resolution of contrast-enhanced MRI of lung perfusion has to be below the transit time of a contrast bolus through the lungs being in the range of 3 to 4 seconds.38
Especially with older machines, 2-D approaches are quite commonly used as they can be acquired in a timely fashion such as 0.3 second for each slice. As a drawback, they lack sufficient spatial resolution and anatomic coverage to characterize most of the perfusion defects or inhomogeneities. For clinical usage, a reasonable spatial resolution and anatomic coverage are required to allow for visualization of perfusion changes on a segmental level. Thus, nowadays 3-D techniques are most frequently used. Even if the temporal resolution is not sufficient for quantification of pulmonary perfusion, a visual analysis can be performed in any case allowing to visualization of the perfusion distribution and defects. Most frequently, a 3-D gradient echo pulse sequence (FLASH) with a short TE and TR with a resulting temporal resolution of 1.0 to 1.5 seconds for each 3-D data set is used, dependent on the used slice thickness of 10 mm down to 5 mm.39,40 Improvements in k-space sampling techniques such as the use of parallel imaging techniques allow for increased spatial resolution without reduction of temporal resolution.41 A second strategy is to use echo sharing (time-resolved echoshared angiographic technique [TREAT], time-resolved imaging of contrast kinetics [TRICKS]), where the low-frequency k-space data are updated more often than are the high-frequency k-space data, which are interpolated between consecutive time frames, thus leading to an effective shortening of the total acquisition time. Image quality of both techniques was assessed in nine patients.42 Using the same temporal resolution, the voxel size was decreased by 24% in the TREAT data sets compared to the standard perfusion technique (both techniques used parallel imaging with an acceleration factor of 2). For central and peripheral vascular perception, the TREAT perfusion was rated significantly superior to the standard technique. Basic evaluation of MR perfusion was performed qualitatively in comparison to perfusion scintigraphy. Intermodality comparison showed a good agreement (kappa = 0.74) in 14 patients with various diseases (chronic obstructive pulmonary disease [COPD], lung cancer, …).43 Rapid acquisition of multiple images during bolus contrast administration is essential to pulmonary perfusion imaging. A direct comparison between different k-space acquisition techniques was performed recently.44 Three k-space acquisition techniques were compared for image quality and SNR: (a) generalized autocalibrating partial parallel acquisition (GRAPPA) with an internal acquisition of reference lines, (b) GRAPPA with a single “external” acquisition of reference lines before the measurement, and (c) a combination of GRAPPA with an internal acquisition of reference lines and view sharing. All examinations were performed in 10 healthy volunteers (5-mL gadobutrol with an injection speed of 2.5 mL/s) with a constant voxel size: 3.9 × 3.9 × 5 mm3. At 1.5 T, view sharing resulted in the best image quality and SNR. Furthermore, the temporal resolution was the shortest with 1.07 seconds. k-t BLAST (broad-use linear speed-up technique) is a method employed to reduce scan time using undersampling of data in k-t space.41 With this technique, faster images with an acceleration factor of 5 are achieved with acceptable error.
Contrast Media
So far, most of the studies used 0.1-mmol Gd-DTPA/kg body weight for visualization of pulmonary perfusion. Different amounts of contrast media (0.05 mmol/kg body weight and 0.1 mmol/kg body weight), contrast media concentrations (0.5 mmol/L and 1 mmol/L), and injection protocols (2.5 mL/s and 5 mL/s) were compared in 10 healthy volunteers.45 By analyzing the SNR, no difference was found between the different contrast media concentrations giving the same injection speed. For both contrast agents, a dose of 0.1 mmol/kg body weight was superior to the half-dose protocol. In combination with a rapid injection (5 mL/s), the highest SNR in all vascular segments were achieved. Regarding the contrast media injection speed, a small bolus profile and fast attenuation of the lung parenchyma are optimal. It was found that with increased speed, the mean transit time (MTT) for the pulmonary arteries decreased significantly.46 However, this decrease was not linear: a fourfold increase in injection rate leads to a twofold decrease in MTT. In the same study, it was found that the cardiac function parameters had no significant influence on the bolus profile. Overall, an injection speed of 3 mL/s was recommended for pulmonary perfusion.47 A summary of frequently used contrast media injection regimens are provided in Table 25.1.
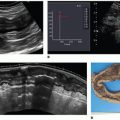
Basic postprocessing for improvement of visualization of perfusion is done by subtraction of the data set with the highest signal intensity from a baseline data set (Fig. 25-2). In most cases, this allows for a rapid analysis of the clinical situation of the patient. However, for any detailed analysis, therapy monitoring, or presurgical estimation of the regional pulmonary function, a quantitative analysis is important.
Quantification
Quantification of pulmonary perfusion is based on the indicator dilution theory where the maximum of signal intensity and the temporal course of the signal change are used. For quantification, an arterial input function (AIF) has to be defined by placing a region of interest (ROI) in the main pulmonary artery. The tissue response function of the lung parenchyma can be either determined by multiple single small ROIs or, better, for the whole lung. The placement of ROIs usually is done manually with known interand intraobserver variabilities during (repeated) evaluations. This has significant implications on the quantification results derived from this technique. Recently, a technique for automatic lung segmentation was published overcoming this above-mentioned shortcomings.56
Assuming a linear relation between the signal and the concentration of contrast agent, signal intensity-time curves are converted to concentration-time curves.57 Hypothesizing a negligible amount of extravasating contrast agent during the first pass of the bolus in the lungs, the principles of the indicator dilution theory58 were applicable. The central volume theorem states the relationship between the perfusion parameters regional pulmonary blood
flow (PBF mL/100 mL lung tissue/min), regional pulmonary blood volume (PBV) (PBV mL/100 mL lung tissue), and the mean transit time (MTT, s):
flow (PBF mL/100 mL lung tissue/min), regional pulmonary blood volume (PBV) (PBV mL/100 mL lung tissue), and the mean transit time (MTT, s):
TABLE 25.1 Summary of Used Contrast Media Injection Protocols and Spatial Resolution of Perfusion-Weighted MR | ||||||||||||||||||||||||||||||||||||||||||||
|---|---|---|---|---|---|---|---|---|---|---|---|---|---|---|---|---|---|---|---|---|---|---|---|---|---|---|---|---|---|---|---|---|---|---|---|---|---|---|---|---|---|---|---|---|
|
Related posts:
 Vascular Anatomy and Microanatomy
 CT and MR Contrast-Enhanced Tissue Perfusion Imaging: Basic Methodology, Postprocessing, Reliability Testing
 Clinical Applications of ASL Brain Perfusion Imaging
 Myocardial Perfusion Imaging with PET/SPECT: Techniques and Clinical Applications
 Ultrasound Perfusion Imaging: Techniques and Analytical Methods
 Contrast-Enhanced Ultrasound: Clinical Applications
Stay updated, free articles. Join our Telegram channel

Full access? Get Clinical Tree


