Pulmonary Thromboembolic Disease
Michael B. Gotway
Gautham P. Reddy
Deep venous thrombosis (DVT) and pulmonary embolism (PE) represent different ends of the spectrum of a single disease—venous thromboembolism (VTE). VTE is a common problem, yet there are many approaches for establishing the diagnosis, and numerous methods for the investigation of VTE may be employed. Familiarity with risk factors for VTE, the clinical presentations of VTE, laboratory evaluation of VTE, and the imaging evaluation of suspected VTE is extremely important for all physicians, particularly radiologists.
CHEST RADIOGRAPHY
Chest radiographic findings of PE have been extensively studied. Although chest radiographs in patients with PE may be completely normal, some abnormality usually is present. Among the patients in the original Prospective Investigation of Pulmonary Embolism Diagnosis I (PIOPED I) study who did not have prior cardiopulmonary disease, chest radiographs were abnormal in 84% of patients with proven PE and 66% of those without PE. However, radiographic abnormalities in the setting of PE generally are nonspecific and transient and usually do not allow a specific diagnosis of PE. Nevertheless, in the proper clinical setting, certain radiographic findings or combinations of findings may suggest the diagnosis of PE and thus serve to direct further imaging to either establish or exclude this diagnosis.
Pulmonary Vascular Abnormalities
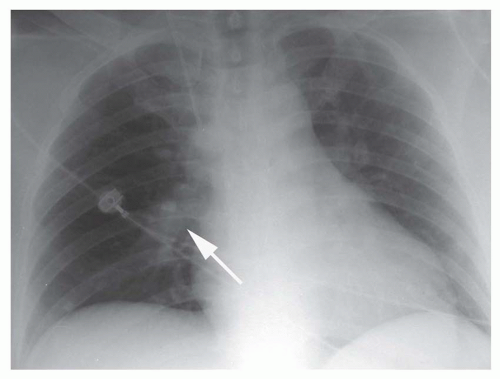
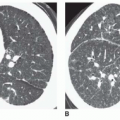
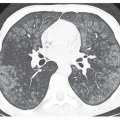
Focal peripheral lucency beyond an occluded vessel, often accompanied by mild dilation of the central pulmonary vessels, known as Westermark’s sign, (Fig. 27-1), is a very nonspecific finding seen in only 7% to 14% of cases of documented PE in the PIOPED I study. Westermark’s sign is thought to be caused by embolic obstruction of the pulmonary artery or hypoxic vasoconstriction secondary to ventilation of poorly perfused lung. This sign often is a subtle finding, in many cases not recognized prospectively, and can be mimicked by other common lung diseases, such as emphysema.
Enlargement of the central pulmonary vasculature also may occur with PE and also is frequently subtle and easily overlooked. This finding may be the result of distention of the vessel by thrombus or by acute rise in pulmonary arterial pressure secondary to the presence of distal emboli. Enlargement of the right descending pulmonary artery, occasionally with a “sausage-like” configuration, may be seen in a number of patients with acute PE, and the size and shape of the artery may normalize following resolution of the embolic event. Enlargement of the right descending pulmonary artery is not specific to PE and may result from pulmonary hypertension of any cause.
Pulmonary edema rarely may occur in association with PE. This finding most often is seen in patients with underlying cardiopulmonary disease and may be caused by left ventricular failure precipitated by PE.
Focal Parenchymal Opacities
Focal parenchymal abnormalities, particularly atelectasis, were the most common chest radiographic abnormalities in patients with PE in the PIOPED I series, occurring in just over two thirds
of the patients. Linear opacities often occur near the lung bases and are thought to represent areas of subsegmental atelectasis related to mucous plugging, hypoventilation, or, perhaps, to distal airway closure or focal depletion of surfactant. Such opacities commonly are transient; if they persist, they may represent areas of scarring secondary to prior infarction.
of the patients. Linear opacities often occur near the lung bases and are thought to represent areas of subsegmental atelectasis related to mucous plugging, hypoventilation, or, perhaps, to distal airway closure or focal depletion of surfactant. Such opacities commonly are transient; if they persist, they may represent areas of scarring secondary to prior infarction.
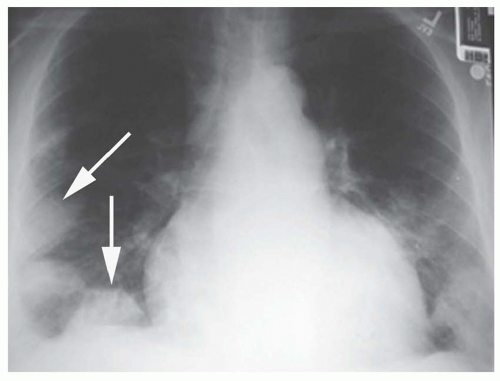
Focal air-space consolidation may occur in patients with PE and may represent pulmonary hemorrhage without infarction or true pulmonary infarction with ischemic necrosis of lung tissue. Estimates of the frequency of pulmonary infarction in patients with PE vary from 10% to 60%. Infarction is most likely to occur when diminished cardiopulmonary reserve is present because both the pulmonary and bronchial arterial systems are impaired. Infarcts often are multiple and occur most frequently in the subpleural regions of the lower lobes, usually within 12 to 24 hours of the onset of symptoms. Infarcts are variable in size and often do not show an air bronchogram, a finding that may favor the diagnosis of infarction over pneumonia. Infarcts typically are ill defined but may progress over several days to a discrete focal opacity. The classic description of a pulmonary infarct, the “Hampton hump,” is a circumscribed, subpleural opacity with a rounded or truncated convex medial border facing toward the pulmonary hilum (Fig. 27-2). This finding is neither common nor specific, however.
Cavitation within a bland (uninfected) infarct is uncommon. Bland infarct cavitation is more likely when the infarct is larger than 4 cm in diameter. When cavitation occurs, it usually is apparent within 2 weeks of the appearance of the air-space opacity.
When air-space opacities are secondary to pulmonary hemorrhage without infarction, resolution of the abnormality usually is rapid; however, true infarction with ischemic tissue necrosis usually takes weeks or months to resolve, leaving linear scars or occasionally associated with pleural thickening. Resolution of pulmonary infarction has been likened to the “melting of an ice cube,” implying that an infarct clears by peripheral dissolution, whereas pneumonia will gradually clear in an irregular, patchy fashion.
Pleural Effusion and Diaphragmatic Abnormalities
Pleural effusion is detected on chest radiography in about half of patients with PE and usually is unilateral and small. When pulmonary infarction occurs, pleural effusions may be larger, hemorrhagic, and may take longer to resolve. Diaphragmatic elevation is common in patients with PE, but this finding is nonspecific.
Chest Radiography for the Diagnosis of Pulmonary Embolism
Chest radiographic abnormalities in patients with PE usually are nonspecific and neither establish nor exclude the diagnosis of PE. The sensitivity and specificity of chest radiography for the diagnosis of PE are only 33% and 59%, respectively. The main value of chest radiographs is for the detection of diagnoses that may clinically simulate PE, such as pneumothorax, pulmonary edema, pneumonia, or rib fractures. In addition, a recent chest radiograph is required for the interpretation of ventilation/perfusion ( ) scintigraphy.
 ) scintigraphy.
LOWER EXTREMITY VENOUS ULTRASOUND
The primary source of PE is thrombosis within the deep venous system of the lower extremities; about 90% of PEs originate from lower extremity DVT. Less common sources of pulmonary emboli include the deep veins of the pelvis, the renal veins, and the veins of the upper extremities. PE arising from DVT in these less common sites often occurs in a suggestive clinical context, whereas up to 50% of lower extremity DVT episodes may be clinically silent. Additionally, DVT often is asymptomatic, even in the presence of clinical evidence of PE. In nearly one third of patients with PE but without clinical evidence of DVT, contrast venography (CV) may reveal the presence of silent DVT. Because the clinical examination is unreliable for the detection of DVT, and the morbidity and mortality related to undiagnosed VTE are significant, much effort has been directed toward the development of accurate methods for DVT detection. Traditional methods for DVT detection, such as impedance plethysmography and CV, have been replaced in clinical practice for the most part by laboratory and imaging techniques, including D-dimer assays, indirect CT venography (CTV), contrast-enhanced magnetic resonance venography (MRV), and lower extremity ultrasound. CV traditionally has been considered the gold standard for DVT detection.
However, because CV is invasive, expensive, and occasionally can induce venous thrombosis, it is not an optimal screening technique for DVT. Rather, lower extremity ultrasonography has supplanted other imaging and physiologic methods for the initial evaluation of suspected DVT. The noninvasive nature, availability, ease of performance, and accuracy of ultrasonography have resulted in its widespread use as the initial diagnostic study in the evaluation of suspected DVT.
However, because CV is invasive, expensive, and occasionally can induce venous thrombosis, it is not an optimal screening technique for DVT. Rather, lower extremity ultrasonography has supplanted other imaging and physiologic methods for the initial evaluation of suspected DVT. The noninvasive nature, availability, ease of performance, and accuracy of ultrasonography have resulted in its widespread use as the initial diagnostic study in the evaluation of suspected DVT.
Technique
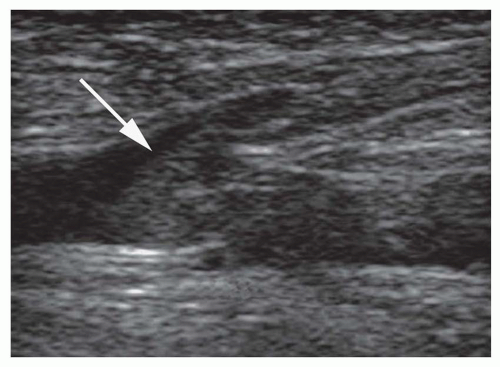
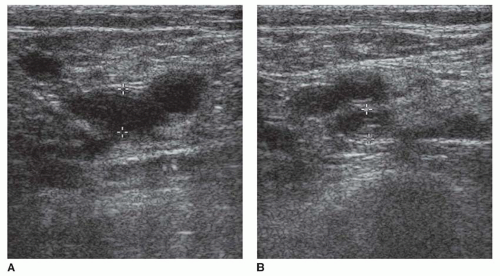
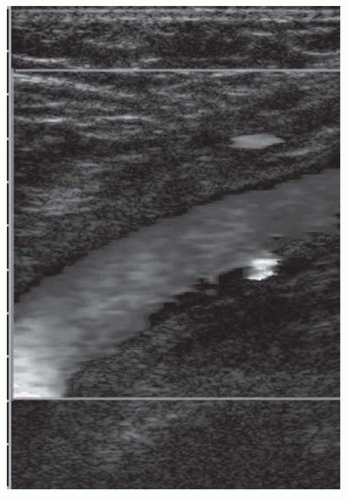
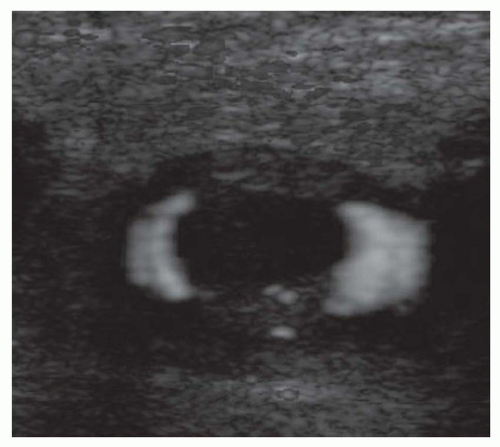
Ultrasound techniques used in the evaluation of DVT variously include real-time gray scale imaging (with and without compression), continuous wave and pulsed Doppler, color Doppler imaging, and ancillary techniques, such as the Valsalva maneuver and manual blood flow augmentation. A high-frequency linear array transducer is preferred to provide optimal spatial resolution. For larger patients, a lower-frequency transducer may be required to provide adequate tissue penetration to visualize the deep venous system of the lower extremity successfully. The lower extremity veins are imaged in both longitudinal and transverse planes from the level of the inguinal ligament to the popliteal trifurcation, including the common femoral vein, the superficial femoral vein, the popliteal vein, and the saphenous vein at its junction with the common femoral vein. Normal veins appear as tubular, anechoic structures. Although thrombosis occasionally may be seen with gray-scale sonography (Fig. 27-3), real-time imaging alone is not sufficient to exclude DVT, because thrombus may have variable echogenicity and often is anechoic, especially when acute; therefore, compression ultrasonography has become the most reliable maneuver to assess for DVT. With compression ultrasonography, the venous system is visualized in the transverse plane and serially compressed from the inguinal ligament to the popliteal fossa in 1- to 2-cm intervals by exerting gentle pressure with the transducer. The diagnosis of DVT is established by demonstrating lack of venous compression due to intraluminal thrombus (Fig. 27-4).
Additional methods employed during lower extremity venous ultrasound examinations for suspected DVT include the Valsalva maneuver, spectral Doppler analysis, and color Doppler analysis. In response to a Valsalva maneuver, a normal vein dilates to more than 50% of its original diameter as a result of impaired venous drainage upstream from the area sampled, whereas veins with acute thrombus have pathologic changes in their walls that prevent such dilation. Lack of appropriate response to a Valsalva maneuver also may indicate thrombosis or obstruction of more central veins outside the field of view, such as the inferior vena cava (IVC). The Valsalva maneuver requires adequate patient cooperation and generally is limited to assessment of the common femoral vein, which is sufficiently large to demonstrate the caliber changes induced by the altered blood volume caused by the maneuver. Although an abnormal venous response to the Valsalva maneuver supports the diagnosis of DVT when there is a lack of venous compressibility, and a normal response may corroborate the findings of a normal compression ultrasound examination, normal or abnormal Valsalva maneuvers alone are not sufficiently sensitive or specific to establish or exclude the diagnosis of DVT.
Spectral Doppler analysis is particularly useful for vessels that cannot be visualized directly (such as the medial portions of the subclavian veins, the central IVC, the superior vena cava [SVC], and brachiocephalic veins). The spectral Doppler waveform of patent central vessels normally shows respiratory phasicity. A monophasic waveform suggests venous obstruction remote from the point of venous interrogation. This abnormal waveform can indicate central DVT, although stenosis or extrinsic compression of the central veins may result in a similar waveform.
Color Doppler imaging is a useful addition to lower extremity compression ultrasonography. Color Doppler is valuable for identifying deep venous structures and interrogating deep vessels where the application of direct venous compression is difficult, such as the superficial femoral vein in the adductor hiatus and the iliac veins (Fig. 27-5). In patients who may be difficult to image, such as obese or postoperative patients, or those with swollen extremities, color Doppler imaging is a useful tool for identifying and interrogating venous anatomy. Venous thrombosis is shown on color Doppler imaging as absence of color flow within the vessel lumen (Fig. 27-6) at baseline and with augmentation. In patients with clinically suspected DVT and a technically adequate examination, color Doppler imaging demonstrates high sensitivity (95%) and specificity (98%) for the diagnosis of femoropopliteal DVT. However, for asymptomatic, high-risk patients (e.g., patients who have just undergone orthopedic surgery or trauma patients), the sensitivity of color Doppler imaging for the detection of femoropopliteal DVT is much lower, perhaps due to the presence of short-segment or nonocclusive thrombus, a relatively high proportion of thrombi limited to the calf veins, or an overall decrease in prevalence of lower extremity DVT in settings where routine DVT prophylaxis is used.
Flow augmentation using spectral Doppler is performed by placing the Doppler gate on the examined vein in the longitudinal plane and manually compressing the calf. A normal response is a rapid rise and fall in blood flow velocity in the interrogated vessel. Such a response implies that the venous system is patent between the point of interrogation and the area of manual compression. Lack of a normal response to flow augmentation may indicate nonocclusive thrombus, although this observation is not specific for this diagnosis.
Accuracy of Compression Ultrasound
The compression ultrasound examination has been proved to be accurate in multiple studies that compared compression ultrasonography with CV and impedance plethysmography in symptomatic patients. When results of various series are combined, compression ultrasonography demonstrates a sensitivity of at least 93% and a specificity of 98% for femoropopliteal DVT, and these numbers would probably be enhanced some with the routine addition of spectral and color Doppler techniques. The overall diagnostic accuracy of compression ultrasonography in the symptomatic patient is lower, however, when the analysis includes potential calf vein thrombosis.
The reliability of a negative compression ultrasound examination is high. Outcome studies have shown no deleterious effects resulting from withholding anticoagulation therapy in patients with clinically suspected DVT who have negative compression ultrasonography examinations at presentation and at follow-up testing over the next week.
Data on the accuracy of compression ultrasonography in asymptomatic, high-risk patient populations (e.g., following orthopedic surgery) are conflicting, with some series showing poor sensitivity for lower extremity ultrasound (including spectral and color Doppler techniques), but other studies showing better results. Conflicting data may be the result of differences in study design and study populations.
Calf Veins
The importance of diagnosing isolated calf vein thrombosis is controversial. Although many investigators postulate that clinically significant PE does not originate from calf veins, not all sources agree that calf vein thrombosis is self-limited. Venographic studies have shown that 40% of untreated calf vein thrombi will remain below the knee, 40% will lyse, and 20% may extend into the femoropopliteal system. Once calf vein thrombi extend above the knee, 50% may be associated with abnormal  scintigraphy, indicating possible PE. Many physicians do not treat calf vein thrombosis aggressively, but anticoagulation certainly is warranted for patients with proximal thrombi, so it may be clinically useful to detect calf vein thrombi before proximal migration has occurred. Calf vein thrombosis can be demonstrated with serial imaging with compression ultrasonography or by direct examination of the veins of the calf. Outcome studies employing compression ultrasonography in symptomatic patients have shown that it is safe to withhold anticoagulation in patients with a negative initial compression ultrasound examination, provided that symptoms prompting the initial compression ultrasound examination do not persist. If lower extremity symptoms persist following the initial examination, a repeat sonogram should be obtained; a small number of patients with an initially negative examination but persistent symptoms will be found to have femoropopliteal DVT on the subsequent compression ultrasound exam. This observation presumably reflects proximal migration of previously undetected calf vein thrombosis.
 scintigraphy, indicating possible PE. Many physicians do not treat calf vein thrombosis aggressively, but anticoagulation certainly is warranted for patients with proximal thrombi, so it may be clinically useful to detect calf vein thrombi before proximal migration has occurred. Calf vein thrombosis can be demonstrated with serial imaging with compression ultrasonography or by direct examination of the veins of the calf. Outcome studies employing compression ultrasonography in symptomatic patients have shown that it is safe to withhold anticoagulation in patients with a negative initial compression ultrasound examination, provided that symptoms prompting the initial compression ultrasound examination do not persist. If lower extremity symptoms persist following the initial examination, a repeat sonogram should be obtained; a small number of patients with an initially negative examination but persistent symptoms will be found to have femoropopliteal DVT on the subsequent compression ultrasound exam. This observation presumably reflects proximal migration of previously undetected calf vein thrombosis.
Another method of addressing suspected calf vein thrombosis is direct examination of the calf veins with ultrasound. The technique of calf vein sonography is not uniformly standardized, and rates of technically adequate examinations vary widely because calf vein sonography is difficult to perform. Several studies have demonstrated encouraging results for calf vein thrombosis detection when examinations are technically satisfactory, though results are variable. Again, color Doppler imaging is a useful adjunct to routine compression ultrasound in the evaluation of symptomatic patients with potential calf vein thrombosis. However, compression ultrasonography, with or without color Doppler, is an insensitive test for calf vein thrombosis for asymptomatic high-risk patients. As with compression ultrasonography in the calf, the utility of color Doppler imaging may be limited by the difficulty in obtaining a technically adequate study.
Upper Extremity Venous Thrombosis
Ultrasound is an excellent screening tool for the assessment of potential upper extremity thrombosis. Routine compression ultrasonography can be utilized in the jugular and brachial venous systems, but the medial aspects of the subclavian veins, the brachiocephalic veins, and the SVC are inaccessible to direct compression. Therefore, interrogation of these vessels requires spectral and color Doppler techniques. Thrombosis may identified by the absence of color Doppler flow within the vessel lumen, occasionally accompanied by echogenic material completely or partially filling the vessel lumen. Spectral Doppler analysis is particularly valuable in the evaluation of potential upper extremity thrombosis. The patency of central venous structures that cannot be visualized directly is inferred by the presence of normal respiratory phasicity. Monophasic flow in the jugular or subclavian veins suggests a central venous abnormality such as DVT, stenosis, or extrinsic compression. Familiarity with these methods is important because the incidence of PE in the setting of upper extremity DVT may be as high as 12%. Furthermore, the incidence of upper extremity DVT has risen in recent years, largely due to the increased use of long-term indwelling catheters for total parenteral nutrition, chemotherapy, and other indications.
COMPRESSION ULTRASONOGRAPHY IN THE EVALUATION OF VENOUS THROMBOEMBOLISM
Compression ultrasonography is often used as an initial study in patients presenting with clinical suspicion of PE, particularly when patients present with unilateral DVT symptoms. Overall compression ultrasonography yields a diagnosis of DVT in 20% to 50% patients subsequently proven to have PE. In such instances, anticoagulation may be instituted without further testing. This approach is rapid and inexpensive, avoids the use of ionizing radiation, and is warranted for patients with lower extremity symptoms. However, compression ultrasonography is not recommended by either the American or British Thoracic Societies as a firstline examination for nonpregnant patients suspected of PE, in the absence of lower extremity symptoms, due to an unacceptably low positive predictive value. Although 90% of PEs originate in the lower extremity venous system (making it reasonable to begin the evaluation of VTE here), in one third of patients with proven PE, lower extremity CV is negative for DVT. Nonocclusive thrombus, unrecognized complete embolization of the thrombus without residua in the legs, and thrombus originating in nonimaged venous segments (e.g., deep pelvic veins), may account for this apparent discrepancy. So, it is clear that a negative lower extremity compression ultrasound examination is insufficiently sensitive to exclude PE in patients with clinical suspicion of PE.
For patients with nondiagnostic, (i.e., intermediate- or low-probability),  scintigraphy results, compression ultrasonography may be obtained in an effort to avoid further diagnostic imaging. In this setting, if the compression ultrasound examination is positive, anticoagulation may be instituted without the need for further testing. Compression ultrasonography has been shown to be cost-effective when used in this fashion, because only those patients with normal lower extremity compression ultrasound examinations need further evaluation for suspected PE.
 scintigraphy results, compression ultrasonography may be obtained in an effort to avoid further diagnostic imaging. In this setting, if the compression ultrasound examination is positive, anticoagulation may be instituted without the need for further testing. Compression ultrasonography has been shown to be cost-effective when used in this fashion, because only those patients with normal lower extremity compression ultrasound examinations need further evaluation for suspected PE.
VENTILATION-PERFUSION SCINTIGRAPHY
Scintigraphy has occupied a central role in the evaluation of VTE for more than three decades. Although CT scanning has emerged as the initial diagnostic test at many institutions for patients suspected of PE, planar  lung scanning still is commonly used for the investigation of suspected PE.
 lung scanning still is commonly used for the investigation of suspected PE.
Pulmonary Anatomy and Physiology
A basic understanding of normal pulmonary physiology is required to appreciate the alterations in lung function that occur in patients with PE. Reflex pneumoconstriction may occur in alveoli that are ventilated but not perfused (i.e., abnormally “high”  ); abnormally low carbon dioxide tension elicits this response. However, this reflex is not commonly observed and generally is transient, because patients inhale carbon dioxide from tracheal dead space into the poorly perfused alveoli, and bronchial circulation continues to deliver some carbon dioxide to ischemic alveoli, thus moderating this reflex bronchoconstriction. Abnormalities of ventilation may produce regional alveolar hypoxia, which, in turn, induces reflex pulmonary vasoconstriction. Thus, alveolar hypoxia (i.e., areas of abnormally low
  ) causes redistribution of pulmonary blood flow away from hypoventilated alveoli. These pulmonary responses to alterations in regional ventilation and perfusion provide the basis for
  scintigraphy.
 ); abnormally low carbon dioxide tension elicits this response. However, this reflex is not commonly observed and generally is transient, because patients inhale carbon dioxide from tracheal dead space into the poorly perfused alveoli, and bronchial circulation continues to deliver some carbon dioxide to ischemic alveoli, thus moderating this reflex bronchoconstriction. Abnormalities of ventilation may produce regional alveolar hypoxia, which, in turn, induces reflex pulmonary vasoconstriction. Thus, alveolar hypoxia (i.e., areas of abnormally low
  ) causes redistribution of pulmonary blood flow away from hypoventilated alveoli. These pulmonary responses to alterations in regional ventilation and perfusion provide the basis for
  scintigraphy.
Technique
Ventilation Scintigraphy
The agent most commonly used for ventilation scintigraphy is xenon-133 (133Xe). 133Xe is an inert gas with a principal photon energy of 81 keV and a physical half-life of 5.3 days. The advantages of 133Xe are that it is relatively inexpensive, is widely available, and allows the acquisition of single-breath, equilibrium, and washout images. A disadvantage of 133Xe is its low photon energy (81 keV), which generally requires that ventilation scans be obtained before perfusion scans. If technetium perfusion images are acquired prior to the 133Xe ventilation study, the downscatter from the technetium-99m (99mTc) photons (140 keV principal photon energy) will be detected in the xenon window of the pulse height analyzer and will degrade the ventilation images. If the ventilation study must be performed or repeated after the perfusion study has been completed, ventilation images can be improved if a 99mTc background image is obtained using the 133Xe window. This background image can then be subtracted from the subsequent 133Xe ventilation images to improve image quality.
133Xe images usually are obtained in the upright posterior projection to allow evaluation of the largest amount of lung volume. The single-breath image is obtained by having the patient exhale completely and then inhale approximately 5 to 20 mCi (200 to 740 MBq) 133Xe gas, after which a 15- to 30-second breathhold is performed to obtain a static image. Then, the patient is instructed to breathe a mixture of the exhaled xenon and oxygen for 3 to 5 minutes, as tolerated, while static equilibrium images are obtained; images thus acquired represent the distribution of aerated lung volume. Finally, washout images are acquired by having the patient breathe fresh air, while serial 15- to 30-second images are obtained for a period of 3 minutes as xenon clears from the lungs. Normal xenon clearance is bilaterally symmetric and usually is complete in 2 to 3 minutes. Areas of delayed clearance may indicate regional air trapping and are commonly seen in patients with obstructive lung disease.
127Xe has been used for ventilation scintigraphy and has the advantage of higher photon energies (172, 203, and 375 keV),
which allow the perfusion study to be performed first. Performing the perfusion study first allows the projection that best shows perfusion defects to be chosen for the ventilation study, thereby allowing a direct comparison between ventilation and perfusion studies and permitting the omission of the ventilation study if the perfusion scan is normal. 127Xe also has a relatively long half-life (36.4 days). However, the advantages of 127Xe are outweighed by the limited availability and expense of this agent. Krypton-81 (81Kr) also has the advantage of a higher photon energies (176 and 192 keV), but krypton is expensive and has a short half-life (13 seconds) which prevents single-breath and washout imaging.
which allow the perfusion study to be performed first. Performing the perfusion study first allows the projection that best shows perfusion defects to be chosen for the ventilation study, thereby allowing a direct comparison between ventilation and perfusion studies and permitting the omission of the ventilation study if the perfusion scan is normal. 127Xe also has a relatively long half-life (36.4 days). However, the advantages of 127Xe are outweighed by the limited availability and expense of this agent. Krypton-81 (81Kr) also has the advantage of a higher photon energies (176 and 192 keV), but krypton is expensive and has a short half-life (13 seconds) which prevents single-breath and washout imaging.
Ventilation imaging also can be performed with aerosols labeled with 99mTc. Technetium-labeled aerosols have the advantage of the ideal technetium photon energy (140 keV), widespread availability, the optimal half-life of this agent, and they do not require the special exhaust systems that must be employed with xenon studies. Disadvantages of aerosols include the inability to obtain single-breath and washout images and a slightly higher rate of technically inadequate studies compared with xenon imaging. This latter difficulty results from central tracer deposition and inadequate peripheral penetration of the tracer, a problem that is more common in smokers.
The most widely used aerosol is 99mTc-labeled diethylenetriamine pentaacetic acid (DTPA). A dose of 25 to 35 mCi (900 to 1,300 MBq) of 99mTc-DTPA is inhaled via nebulizer, and initial images are obtained in the upright position for approximately 200,000 counts. Multiple projections may be obtained. The DTPA aerosol is absorbed across the alveolarcapillary membrane with a clearance time of half-life of 45 to 60 minutes, occasionally faster in smokers. When the aerosol study is performed prior to perfusion imaging, only 1 mCi (37 MBq) of activity related to the aerosol is present in the lungs; thus, the aerosol contributes little activity to the perfusion image when 4 to 5 mCi (148 to 185 MBq) are used for the latter.
Perfusion Scintigraphy
Pulmonary perfusion scintigraphy is performed with 99mTc-labeled macroaggregated albumin (MAA). MAA particles range in size from 10 to 40 μm, allowing them to localize in precapillary arterioles by mechanical blockade. The physiologic effect of pulmonary vascular blockade usually is insignificant, because less than 0.1% of precapillary pulmonary arterioles are occluded and the blockage is temporary because the biologic half-life of 99mTc-MAA particles in the lungs is only 6 to 8 hours.
About 1 to 5 mCi (37 to 185 MBq) of 99mTc-MAA is injected intravenously during quiet respiration, with the patient supine. Supine injections are performed to minimize the normal perfusion gradient between lung apex and base in the upright patient and ensure even tracer distribution. Blood withdrawn into the syringe during venipuncture must not be allowed to remain in the syringe, because small blood clots may form. These will be labeled with tracer, and injection of these labeled clots will result in “hot spots” on the perfusion image. The tracer is injected slowly over several respiratory cycles. The number of particles injected ranges from 200,000 to 700,000, with fewer particles employed in children, pregnant women, or patients with right-to-left shunts or pulmonary hypertension. In such circumstances, the number of particles injected should be decreased to 100,000. Any further decrease in the number of particles produces tracer inhomogeneity and results in degraded images.
Imaging is performed immediately after tracer injection, preferably with the patient in the upright position to minimize diaphragmatic motion and maximize lung volume. Imaging may be performed in either the supine or decubitus positions, as needed. Imaging is performed with a large field-of-view camera and either a parallel-hole, all-purpose, or diverging collimator. Planar images are obtained in multiple projections (usually anterior, posterior, both posterior oblique, and both lateral projections). Other specialized projections may be obtained as desired. Each projection is acquired for approximately 500,000 to 750,000 counts. The first lateral view is acquired for 500,000 counts and the opposite lateral view is acquired for the same amount of time needed to obtain the first lateral view.
Interpretation
A normal ventilation scan shows relatively homogeneous pulmonary tracer activity on the single-breath and equilibrium images. During the washout phase, tracer activity slowly clears, with the bases clearing slightly more slowly than the remainder of the lungs. Clearing usually is complete in 2 or 3 minutes. 99mTc-DTPA aerosols also demonstrate homogeneous tracer activity from lung apex to base but, unlike xenon scans, the trachea and bronchi normally may be seen. Occasionally, swallowed activity may be detected in the esophagus and stomach.
Normal perfusion scans reveal homogeneous pulmonary tracer activity with predictable defects in the expected locations of the heart, pulmonary hila, and aortic arch, depending on the projection obtained.
Various schemes have been devised to interpret  scintigraphy. These schemes rely on the principle that PE causes decreased or absent pulmonary blood flow in a portion of lung, producing a perfusion defect. Because the alveoli serving these occluded vessels remain ventilated, a
  “mismatch” is created. Unfortunately, many causes of perfusion defects unrelated to PE exist, and PE itself does not always result in a
  mismatch. Hence, PE is neither diagnosed nor excluded by
  lung scanning; rather, the probability of PE in any given patient is generated by interpretation of the lung scan. These probabilities are based on criteria that evaluate the shape, number, location, and size of perfusion defects on the perfusion scan in combination with the findings on the ventilation lung scan and chest radiograph. Perfusion
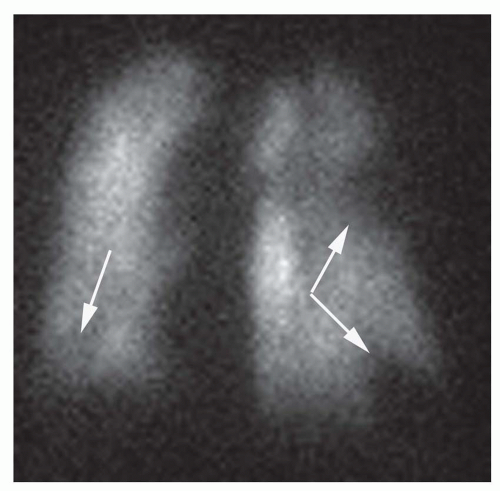
defects are classified as lobar, segmental, or subsegmental; defects that do not conform to segmental lung anatomy are considered nonsegmental defects. The shape of perfusion defects also is important. Perfusion defects resulting from PE usually are wedge-shaped and contact the pleural surface (Fig. 27-7). Defects that do not extend to the pleural surface may show a rim of activity immediately beneath the pleural surface but peripheral to the perfusion defect—a finding known as the “stripe” sign. Such perfusion abnormalities usually are not the result of PE. The number of perfusion defects also may be of some value in determining the likelihood of PE. Solitary perfusion defects usually are not related to PE, whereas multiple subsegmental perfusion defects are associated with PE in up to 50% of cases. The size of a perfusion defect also is significant. Sizes are graded as follows: a small perfusion defect occupies less than 25% of an anatomic lung segment; a moderate perfusion defect represents 25% to 75% of a lung segment; and a large perfusion defect constitutes greater than 75% of an anatomic lung segment. The perfusion scan is interpreted with reference to the chest radiograph, and the size of a perfusion defect is compared to any corresponding chest radiographic abnormality. The chief interpretive schemes (McNeil, Biello, PIOPED, and revised PIOPED classification schemes) have been divided into four diagnostic categories based on the probability of PE at pulmonary angiography: high-probability, intermediate/indeterminate-probability, low-probability, and normal perfusion scintigraphy. In addition to these categories, the original PIOPED criteria included a very low probability group in which the prevalence of angiographically documented PE was 9%.
 scintigraphy. These schemes rely on the principle that PE causes decreased or absent pulmonary blood flow in a portion of lung, producing a perfusion defect. Because the alveoli serving these occluded vessels remain ventilated, a
  “mismatch” is created. Unfortunately, many causes of perfusion defects unrelated to PE exist, and PE itself does not always result in a
  mismatch. Hence, PE is neither diagnosed nor excluded by
  lung scanning; rather, the probability of PE in any given patient is generated by interpretation of the lung scan. These probabilities are based on criteria that evaluate the shape, number, location, and size of perfusion defects on the perfusion scan in combination with the findings on the ventilation lung scan and chest radiograph. Perfusion
 defects are classified as lobar, segmental, or subsegmental; defects that do not conform to segmental lung anatomy are considered nonsegmental defects. The shape of perfusion defects also is important. Perfusion defects resulting from PE usually are wedge-shaped and contact the pleural surface (Fig. 27-7). Defects that do not extend to the pleural surface may show a rim of activity immediately beneath the pleural surface but peripheral to the perfusion defect—a finding known as the “stripe” sign. Such perfusion abnormalities usually are not the result of PE. The number of perfusion defects also may be of some value in determining the likelihood of PE. Solitary perfusion defects usually are not related to PE, whereas multiple subsegmental perfusion defects are associated with PE in up to 50% of cases. The size of a perfusion defect also is significant. Sizes are graded as follows: a small perfusion defect occupies less than 25% of an anatomic lung segment; a moderate perfusion defect represents 25% to 75% of a lung segment; and a large perfusion defect constitutes greater than 75% of an anatomic lung segment. The perfusion scan is interpreted with reference to the chest radiograph, and the size of a perfusion defect is compared to any corresponding chest radiographic abnormality. The chief interpretive schemes (McNeil, Biello, PIOPED, and revised PIOPED classification schemes) have been divided into four diagnostic categories based on the probability of PE at pulmonary angiography: high-probability, intermediate/indeterminate-probability, low-probability, and normal perfusion scintigraphy. In addition to these categories, the original PIOPED criteria included a very low probability group in which the prevalence of angiographically documented PE was 9%.
The Original PIOPED (PIOPED I) Series
The original PIOPED I series represents the largest prospective study examining the role of  scintigraphy in patients with suspected PE. PIOPED I scan interpretation criteria were designed to provide diagnostic categories that could be applied to all patients studied with
  scintigraphy. Of 5,587 requests for lung scintigraphy in the PIOPED I series, 3,016 patients were eligible to participate in the trial and 1,493 patients ultimately were enrolled in the study. Among the enrolled patients, 931 were selected for mandatory angiography and eventually, 755 of these patients completed the protocol. Sixty-nine of the patients selected for angiography did not undergo the procedure because their
  lung scans were interpreted as normal, and 107 patients selected for angiography did not undergo the procedure despite the requirement of the study protocol.
  lung scans were compared with pulmonary angiograms, and the interobserver variability for both studies was noted. Patient outcomes were followed for 1 year after study entry. Diagnostic
  scans were obtained in 931 of 933 patients. Among patients with diagnostic scintigraphy, 13% (124 of 931 patients) had high-probability scan interpretations, 39% (364 of 931 patients) had intermediate-probability scan interpretations, 34% (312 of 931 patients) had low-probability scan interpretations, 14% (131 of 931 patients) had normal/near-normal scan interpretations, and 2% had normal scan interpretations. The frequencies of angiographically proven PE for each
  scan category were reported in the PIOPED I series, and familiarity with these data are important for any physician dealing with patients suspected of PE. The prevalence of angiographically proven PE in the PIOPED I series was 88% for high-probability lung scan interpretations, 33% for intermediate-probability scan interpretations, 16% for low-probability scan interpretations, and 9% for normal/near-normal scan interpretations.
 scintigraphy in patients with suspected PE. PIOPED I scan interpretation criteria were designed to provide diagnostic categories that could be applied to all patients studied with
  scintigraphy. Of 5,587 requests for lung scintigraphy in the PIOPED I series, 3,016 patients were eligible to participate in the trial and 1,493 patients ultimately were enrolled in the study. Among the enrolled patients, 931 were selected for mandatory angiography and eventually, 755 of these patients completed the protocol. Sixty-nine of the patients selected for angiography did not undergo the procedure because their
  lung scans were interpreted as normal, and 107 patients selected for angiography did not undergo the procedure despite the requirement of the study protocol.
  lung scans were compared with pulmonary angiograms, and the interobserver variability for both studies was noted. Patient outcomes were followed for 1 year after study entry. Diagnostic
  scans were obtained in 931 of 933 patients. Among patients with diagnostic scintigraphy, 13% (124 of 931 patients) had high-probability scan interpretations, 39% (364 of 931 patients) had intermediate-probability scan interpretations, 34% (312 of 931 patients) had low-probability scan interpretations, 14% (131 of 931 patients) had normal/near-normal scan interpretations, and 2% had normal scan interpretations. The frequencies of angiographically proven PE for each
  scan category were reported in the PIOPED I series, and familiarity with these data are important for any physician dealing with patients suspected of PE. The prevalence of angiographically proven PE in the PIOPED I series was 88% for high-probability lung scan interpretations, 33% for intermediate-probability scan interpretations, 16% for low-probability scan interpretations, and 9% for normal/near-normal scan interpretations.
On the other hand, only 102 of 251 patients with angiographically documented PE had high-probability scan interpretations, indicating that the sensitivity for a high-probability scan is only 41%. The sensitivity of  scintigraphy for the detection of PE improves to 82% when high- and intermediate-probability scan interpretations are considered together, and sensitivity increases to 98% when high-, intermediate-, and low-probability scan results are considered together. However, the specificity of
  lung scans falls from 98% when high-probability scans are considered alone, to 52% and 10% when high- and intermediate-probability scan results and high-, intermediate-, and low-probability scan interpretations are considered together, respectively.
 scintigraphy for the detection of PE improves to 82% when high- and intermediate-probability scan interpretations are considered together, and sensitivity increases to 98% when high-, intermediate-, and low-probability scan results are considered together. However, the specificity of
  lung scans falls from 98% when high-probability scans are considered alone, to 52% and 10% when high- and intermediate-probability scan results and high-, intermediate-, and low-probability scan interpretations are considered together, respectively.
The interobserver variability for  interpretation in the PIOPED I series was 5%, 8%, and 6%, respectively, for high-probability, very low probability, and normal
  scan categories. However, the interobserver variability
for intermediate- and low-probability scan categories was higher—25% and 20%, respectively.
 interpretation in the PIOPED I series was 5%, 8%, and 6%, respectively, for high-probability, very low probability, and normal
  scan categories. However, the interobserver variability
 for intermediate- and low-probability scan categories was higher—25% and 20%, respectively.
The positive predictive value of a high-probability scan interpretation in the PIOPED I series in a patient without a prior embolic history was 91%. However, the positive predictive value of a high-probability scan interpretation falls to 74% for patients with prior embolic episodes.
Integration of Clinical Assessment of Pulmonary Embolism Probability with Scan Interpretation
The importance of integration of the clinical pretest probability (i.e., prior probability) of the likelihood of PE with the  scan interpretation was highlighted by PIOPED I (Table 27-1). When a low-probability scan interpretation (angiographically proven PE prevalence of 16%) was combined with a low clinical suspicion for PE (0% to 19% likelihood of PE), the negative predictive value of a low-probability scan increased from 84% to 96% (i.e., the prevalence of PE on angiography decreased from 16% to 4%). Similarly, the negative predictive value of a normal/near-normal scan interpretation rose from 91% to 98% when integrated with a low clinical assessment for the likelihood of PE. The positive predictive value of a high-probability scan interpretation increased from 88% to 96% when combined with a high clinical suspicion (80% to 100% likelihood of PE). In contrast, when a high-probability scan interpretation was integrated with a low clinical suspicion for PE, the positive predictive value of a high-probability scan reading fell from 88% to 56%. Therefore, integration of clinical assessment of the likelihood of PE with scan interpretation results improves the diagnostic accuracy of
  scintigraphy. Unfortunately, most of the PIOPED I patients had intermediate-probability
  scan interpretations and intermediate clinical assessments of the likelihood of PE, so most patients did not benefit from this improved diagnostic accuracy and therefore, required further diagnostic evaluation.
 scan interpretation was highlighted by PIOPED I (Table 27-1). When a low-probability scan interpretation (angiographically proven PE prevalence of 16%) was combined with a low clinical suspicion for PE (0% to 19% likelihood of PE), the negative predictive value of a low-probability scan increased from 84% to 96% (i.e., the prevalence of PE on angiography decreased from 16% to 4%). Similarly, the negative predictive value of a normal/near-normal scan interpretation rose from 91% to 98% when integrated with a low clinical assessment for the likelihood of PE. The positive predictive value of a high-probability scan interpretation increased from 88% to 96% when combined with a high clinical suspicion (80% to 100% likelihood of PE). In contrast, when a high-probability scan interpretation was integrated with a low clinical suspicion for PE, the positive predictive value of a high-probability scan reading fell from 88% to 56%. Therefore, integration of clinical assessment of the likelihood of PE with scan interpretation results improves the diagnostic accuracy of
  scintigraphy. Unfortunately, most of the PIOPED I patients had intermediate-probability
  scan interpretations and intermediate clinical assessments of the likelihood of PE, so most patients did not benefit from this improved diagnostic accuracy and therefore, required further diagnostic evaluation.
Low-Probability Lung Scans
Outcome studies have shown that most patients with low-probability  scan interpretations do well when anticoagulation is withheld, even though the frequency of angiographically proven PE in this setting is known to range from 14% to 30%. This apparent discrepancy may be explained by subclinical, well-tolerated PE. However, patients with poor cardiopulmonary reserve (e.g., hypotension, co-existent pulmonary edema, right ventricular failure, tachydysrhythmias) and low-probability scan interpretations do not necessarily share the same favorable prognosis, and further diagnostic evaluation is required. Furthermore, patients with low-probability scan interpretations and high-probability pretest clinical assessments or significant risk factors for VTE certainly require additional diagnostic evaluation.
 scan interpretations do well when anticoagulation is withheld, even though the frequency of angiographically proven PE in this setting is known to range from 14% to 30%. This apparent discrepancy may be explained by subclinical, well-tolerated PE. However, patients with poor cardiopulmonary reserve (e.g., hypotension, co-existent pulmonary edema, right ventricular failure, tachydysrhythmias) and low-probability scan interpretations do not necessarily share the same favorable prognosis, and further diagnostic evaluation is required. Furthermore, patients with low-probability scan interpretations and high-probability pretest clinical assessments or significant risk factors for VTE certainly require additional diagnostic evaluation.
TABLE 27.1 Scan Interpretation and Clinical Assessment of Probability of PE | ||||||||||||||||||||||||
|---|---|---|---|---|---|---|---|---|---|---|---|---|---|---|---|---|---|---|---|---|---|---|---|---|
|
Ventilation/Perfusion Scintigraphy and Obstructive Lung Disease
The clinical diagnosis of PE is even more difficult in patients with obstructive lung disease because the clinical manifestations of PE may easily be misinterpreted as a COPD exacerbation, and laboratory values are not sufficiently sensitive or specific to distinguish acute PE from a COPD exacerbation. Unfortunately,  scintigraphy often is abnormal in patients with moderate or severe COPD. Nevertheless, it has been shown that the diagnostic utility of
  scintigraphy for the evaluation of PE is not diminished in the setting of pre-existing cardiopulmonary disease, although intermediate-probability scan interpretations do occur more often in such patients. Furthermore, the diagnostic accuracy of lung scanning in patients with COPD is improved when integrated with the clinical assessment of the likelihood of PE.
 scintigraphy often is abnormal in patients with moderate or severe COPD. Nevertheless, it has been shown that the diagnostic utility of
  scintigraphy for the evaluation of PE is not diminished in the setting of pre-existing cardiopulmonary disease, although intermediate-probability scan interpretations do occur more often in such patients. Furthermore, the diagnostic accuracy of lung scanning in patients with COPD is improved when integrated with the clinical assessment of the likelihood of PE.
Chest Radiography and Ventilation/Perfusion Scintigraphy
Stay updated, free articles. Join our Telegram channel

Full access? Get Clinical Tree


