It is incumbent upon all individuals who use radiation in medicine to strive for an optimal compromise between its clinical utility and the risk from radiation doses to patients, staff, and the public. Federal and state governments and even some large municipalities have agencies that promulgate regulations regarding the safe use of radiation and radioactive material. Radiation protection programs are designed and implemented to ensure compliance with these regulations. To a large degree, the success of radiation protection programs depends on the development of procedures for the safe use of radiation and radioactive material and the education of staff about radiation safety principles, the risks associated with radiation exposure and contamination, and the procedures for safe use. This chapter discusses the application of radiation protection principles (also known as health physics) in diagnostic x-ray and nuclear imaging, image-guided interventional procedures, and therapy with radioactive material.
21.1 SOURCES OF EXPOSURE TO IONIZING RADIATION
Much of the data referenced below on sources of exposure to radiation is from National Council on Radiation Protection and Measurements (NCRP) reports 94, 160, and 184 (NCRP, 1987, 2009, 2019) which have consolidated information on population exposure from both naturally occurring and artificially produced sources of exposure to radiation. According to the NCRP Report No. 160, the average annual per capita effective dose, exclusive of doses to patients from external beam radiation therapy, from exposure to ionizing radiation in the United States in 2006 was approximately 6.2 millisievert (mSv). These averages apply to the entire population of the United States. Approximately half of this, about 3.1 mSv, was from naturally occurring sources, whereas about 48%, 3.0 mSv, was from medical exposure of patients. Only about 2%, 0.14 mSv, was from other sources, such as consumer products and activities and occupational exposure. A decade later, in its Report No. 184, NCRP updated the information on the medical radiation exposure of patients in the United States, finding a 15% to 20% reduction, from 2006 to 2016, in the average dose to the U.S. population from medical imaging procedures, likely due to advances in technology as well as campaigns to increase awareness of medical imaging doses and to optimize patient doses. Doses to individuals from these sources vary considerably with a variety of factors discussed below.
21.1.1 Ubiquitous Background Exposure
Naturally occurring sources of radiation include (1) cosmic rays, (2) cosmogenic radionuclides, and (3) primordial radionuclides and their radioactive decay products. Cosmic radiation includes both the primary extraterrestrial radiation that strikes the Earth’s atmosphere and the secondary radiations produced by the interaction of primary cosmic rays with the atmosphere. Primary cosmic rays predominantly consist of extremely penetrating high-energy (mean energy ˜10 GeV) particulate radiation, approximately 80% of which is high-energy protons. Almost all primary cosmic radiation collides with our atmosphere before reaching the ground, producing showers of secondary particulate radiations (e.g., electrons and muons) and electromagnetic radiation. The average per capita effective dose from cosmic radiation is approximately 0.33 mSv per year or approximately 11% of natural background radiation. However, the range of individual exposures is considerable. The majority of the population of the United States is exposed to cosmic radiation near sea level where the outdoor effective dose rate is approximately 0.3 mSv per year. However, smaller populations receive much more than this amount (e.g., Colorado Springs, CO, at 1,840 m, ˜0.82 mSv per year). Exposures increase with altitude, approximately doubling every 1,500 m, as there is less atmosphere to attenuate the cosmic radiation. Cosmic radiation is also greater at the Earth’s magnetic poles than at the equator, as charged particles encountering the Earth’s magnetic field are forced to travel along the field lines to either the North or the South Pole. Structures provide some protection from cosmic radiation; the indoor effective dose rate is approximately 20% lower than outdoors.
Some of the secondary cosmic ray particles collide with stable atmospheric nuclei producing “cosmogenic” radionuclides (e.g., ). Although many cosmogenic radionuclides are produced, they contribute very little (˜0.01 mSv per year or <1%) to natural background radiation. The majority of the effective dose caused by cosmogenic radionuclides is from carbon 14.
The radioactive materials that have been present on the Earth since its formation are called primordial radionuclides. Primordial radionuclides with physical half-lives comparable to the age of the Earth (˜4.5 billion years) and their radioactive decay products are the largest sources of terrestrial radiation exposure. The population radiation dose from primordial radionuclides is the result of external radiation exposure, inhalation, and incorporation of radionuclides in the body. Primordial radionuclides with half-lives less than 108 years have decayed to undetectable levels since their formation, whereas those with half-lives greater than 1010 years do not significantly contribute to background radiation levels because of their long physical half-lives (i.e., slow rates of decay). Most radionuclides with atomic numbers greater than lead decay to stable isotopes of lead through a series of radionuclide decays called decay chains. The radionuclides in these decay chains have half-lives ranging from seconds to many thousands of years. Other primordial radionuclides, such as potassium 40 (K-40, T1/2 = 1.28 × 10⁹ years), decay directly to stable nuclides. The decay chains of uranium 238 (U-238), T½ = 4.51 × 10⁹ years (uranium series), and thorium 232 (Th-232), T½ = 1.41 × 10¹⁰ years (thorium series), produce several dozen radionuclides that together with K-40 are responsible for most of the external terrestrial average effective dose of 0.21 mSv per year or approximately 7% of natural background. Individuals may receive much higher or lower exposures than the average, depending on the local concentrations of terrestrial radionuclides. The range in the United States is approximately 0.1 to 0.4 mSv per year. There are a few regions of the world where terrestrial radionuclides are highly concentrated. For example, as discussed in Chapter 20, monazite sand deposits, containing high concentrations of radionuclides from the Th-232 decay series, are found along certain beaches in India. The external radiation levels on these black sands range up to 70 mGy per year (Nair et al., 2009), which is more than 300 times the average level from terrestrial sources in the United States.
The short-lived alpha particle-emitting decay products of radon 222 (Rn-222) are believed to be the most significant source of exposure from the inhalation of naturally occurring radionuclides. Radon 222, a noble gas, is produced in the U-238 decay chain by the decay of radium 226 (Ra-226). Rn-222 decays by alpha emission, with a half-life of 3.8 days, to polonium 218 (Po-218), followed by several other alpha and beta decays, eventually leading to stable lead-206 (Pb-206). When the short-lived daughters of radon are inhaled, most of the dose is deposited in the tracheobronchial region of the lung. Radon concentrations in the environment vary widely. There are both seasonal and diurnal variations in radon concentrations. Radon gas emanates primarily from the soil in proportion to the quantity of natural uranium deposits; its dispersion can be restricted by structures, producing much higher indoor air concentrations than found outdoors in the same area. Radon gas dissolved in domestic water supplies can be released into the air within a home during water usage, particularly when the water is from a well or another groundwater source. Weatherproofing of homes and offices and other energy conservation measures typically decrease ventilation by outside air, resulting in higher indoor radon concentrations.
The radiation from exposure to Rn-222 and its daughters in the United States results in an average effective dose of approximately 2.1 mSv per year or approximately 68% of natural background. The dose from the inhalation of radon decay products is primarily to the bronchial epithelium. In order to convert the absorbed dose from the alpha particles to an effective dose, a tissue weighting factor (wT) of 0.08 is applied along with a radiation weighting factor (wR) of 20 to account for increased risk from exposure to high LET radiation.
The average indoor air concentration of Rn-222 in homes in the United States is approximately 46 Bq/m3 (1.24 pCi/L); however, levels can exceed 2.75 kBq/m3 (75 pCi/L) in poorly ventilated structures with high concentrations of U-238 in the soil. Outdoor air concentrations are approximately three times lower, 15 Bq/m3 (0.41 pCi/L). The U.S. Environmental Protection Agency (EPA, 2020) recommends taking action to reduce radon levels in homes exceeding 147 Bq/m3 (4 pCi/L), whereas other countries have somewhat different action levels (e.g., the United Kingdom and Canada have higher action levels, 200 Bq/m3 [5.4 pCi/L]). Although Rn-222 accounts for about two thirds of the natural radiation effective dose, it can be easily measured, and exposures can be reduced when necessary.
The third-largest source of natural background radiation is from the ingestion of food and water containing primordial radionuclides (and their decay products), of which K-40 is the most significant. K-40 is a naturally occurring isotope of potassium (˜0.01%). Skeletal muscle has the highest concentration of potassium in the body. K-40 produces an average effective dose of approximately 0.15 mSv per year or approximately 5% of natural background. Th-232 and U-238 and their decay products are found in food and water and result in an average annual effective dose of approximately 0.13 mSv.
Long-lived radionuclides released to or created in the environment from the atmospheric testing of nuclear weapons (450 detonations between 1945 and 1980) consist mainly of carbon 14, tritium (H-3), cesium 134 and 137 (Cs-134, Cs-137), strontium 90, plutonium, and transplutonium elements. A large fraction of these radionuclides have since decayed and/or have become progressively less available for biologic uptake and as a result, the average annual effective dose is less than 10 µSv (NCRP, 1987).
21.1.2 Medical Exposure of Patients
The single greatest controllable source of radiation exposure in the US population (and that of many other developed countries) is medical imaging. The majority of the exposure is from x-ray imaging (primarily from diagnostic radiology), with a smaller contribution from nuclear medicine due to the lower number of examinations performed per year. Doses from individual medical imaging procedures are summarized in Appendices E and F. NCRP Report No. 160 (NCRP, 2009) showed that the average annual effective dose to the U.S. population from the medical use of radiation (not including radiation therapy) had increased from about 1980 to 2006, by more than a factor of five (0.53 to 3 mSv), representing ˜97% of the total from artificial radiation sources and nearly half of the total average annual effective dose from all sources. Of course, there had been significant advances in medical imaging technology and its use from 1980 to 2006. The report identified the increased utilization of CT and nuclear medicine imaging procedures as the two most significant factors that led to the increase in the average dose from the medical use of radiation (Fig. 21-1). In 2006, while CT and nuclear medicine procedures collectively accounted for only ˜21% of all medical imaging procedures using ionizing radiation, they delivered ˜75% of the collective effective dose. The CT and nuclear medicine procedures that contributed the most to this dose were CT of the abdomen and the pelvis and 99mTcand 201Tl myocardial perfusion imaging, which together accounted for more than half of the effective dose to the population from medical imaging. Conversely, conventional radiographic and fluoroscopically guided non-cardiac interventional procedures, which accounted for ˜75% of the imaging procedures, resulted in only ˜11% of the collective effective dose1 (Table 21-1A).
▪ FIGURE 21-1 Average annual per capita effective doses in the United States from medical imaging procedures, showing the large increase from 1980 to 2006. (From National Council on Radiation Protection and Measurements. Exposure of the Population in the United States and Canada from Natural Background Radiation. NCRP Report No. 94. Bethesda, MD: National Council on Radiation Protection and Measurements; 1987; National Council on Radiation Protection and Measurements. Ionizing Radiation Exposure of the Population of the United States. NCRP Report No. 160. Bethesda, MD: National Council on Radiation Protection and Measurements; 2009.) Updated estimates from 2016 show a slight decrease in contribution from medical imaging procedures, reflecting new technology and as a result of an emphasis on dose optimization. (Reprinted with permission from National Council on Radiation Protection and Measurements. Medical Radiation Exposure of Patients in the United States. NCRP Report No. 184. Bethesda, MD: National Council on Radiation Protection and Measurements; 2019. http://NCRPonline.org.)
TABLE 21-1 RADIATION EXPOSURE TO US POPULATION IN 2006 AND 2016—MEDICAL EXPOSURES (EXCLUDING RADIATION THERAPY)
aFor CT the values are for procedures. The estimated number of scans in 2006 and 2016 were 67 and 84 million, respectively.
bValue adjusted from NCRP Report No. 160 (NCRP, 2009) due to an extrapolation that was likely an overestimate.
While much of this increase was almost certainly beneficial for patients as it prevented many unnecessary exploratory surgeries, identified early-stage cancers, allowed for effective intervention in stroke patients, etc., the concerns centered around those scans that may not have been necessary and those that could have been accomplished at lower doses to the patients. In response to this increase in patient exposure, several initiatives were put into place by the radiology community, the two most significant of which were centered around dose optimization and appropriate utilization of imaging services. Optimization means adjusting the quality and quantity of the radiation to the body habitus of the patient to use only the dose necessary for producing a study from which a diagnosis can be made with confidence. The term ALADA (As Low As Diagnostically Acceptable) has been cited in the literature by some who wish to distinguish it from the radiation protection concept of ALARA (As Low As Reasonably Achievable) over the concern that the dose (rather than the diagnostic utility of the image) may become the overriding metric of quality (Fernandes et al., 2016). While this is not the intent of ALARA and it certainly can be applied to medicine if correctly interpreted, some see the distinction useful to keep the right balance on the elements that most affect patient care. There has also been a renewed focus on the utilization of appropriateness criteria for evaluating which imaging procedures are best suited to the specific patient and clinical question at hand. Both of these concepts are expanded upon in Section 21.4.1 under the general radiation safety principles of justification and optimization.
A recent estimate of medical radiation exposure of patients in the United States, NCRP Report 184 (NCRP, 2019), based on data from 2016 (10 years after the previous assessment) indicated that the annual number of diagnostic and interventional radiologic examinations that had been reported for 2006 (377 million) was essentially unchanged. There had actually been an increase in the annual number of CT scans performed per year over that period; however, there were decreases in other imaging procedures (e.g., nuclear medicine; fluoroscopy). After taking into account the population increase of 24 million, the overall annual individual (per capita) effective dose from diagnostic and interventional medical procedures was shown to have decreased from 2.9 mSv in 2006 to 2.3 mSv in 2016. Similarly, the U.S. annual collective effective dose had decreased from 885,000 to 755,000 person-sievert2 (Table 21-1B).
21.1.3 Consumer Products and Activities
This category includes a variety of sources, most of which are consumer products. The largest contribution in this category is from tobacco products. Two alphaemitting radionuclides, Pb-210 and Po-210 (which occur naturally from the decay of Ra-226), have been measured in both tobacco leaves and cigarette smoke. It has been estimated that a one-pack-a-day smoker increases his or her annual effective dose by approximately 0.36 mSv. The NCRP estimated the average annual effective dose to an exposed individual is 0.3 mSv and, based on a smoking population of 45 million in the United States, this resulted in an average annual effective dose to the entire population of 0.045 mSv, which is about 35% of the effective dose from all consumer products and activities.
Many building materials contain radioisotopes of uranium, thorium, radium, and potassium. These primordial radionuclides and their decay products are found in higher concentrations in such materials as brick, concrete, clay, and granite, and thus structures and household items made from these materials will cause higher exposures than those made from other materials. The typical annual effective dose received by a member of the public from glazed ceramics amounts to 7-50 µSv from external radiation, together with an increase of 3-5 Bq/m3 in indoor radon concentration. By contrast, porcelain tiles give rise to an annual effective dose of 3-150 µSv from external radiation and an increase in radon concentration of 10-46 Bq/m3. The average annual per capita effective dose is estimated to be approximately 0.035 mSv from these types of sources.
Air travel can substantially add to an individual’s cosmic ray exposure. For example, a 5-h transcontinental flight in a commercial jet aircraft will result in an equivalent dose of approximately 0.025 mSv. The average annual per capita effective dose to passengers from commercial air travel is estimated to be approximately 0.034 mSv.
There are many other less important sources of enhanced natural radiation exposure, such as mining and agricultural activities (primarily from fertilizers containing members of the uranium and thorium decay series and K-40); combustible fuels, including coal and natural gas (radon); and consumer products, including smoke alarms (americium-241), gas lantern mantles (thorium), and dental prostheses, certain ceramics, and optical lenses (uranium). These sources contribute less than 12% of the average annual effective dose from consumer products and activities.
21.1.4 Occupational and Other Sources of Exposure
Occupational exposures are received by some people employed in medicine, including veterinary medicine, by aircraft crew in commercial aviation, by workers in some industrial and commercial activities; by workers in the commercial nuclear power industry, by workers in some educational and research institutions, and by some individuals in the military, some in governmental agencies, and some in U.S. Department of Energy facilities. Since most individuals are not occupationally exposed to radiation and the majority of those who are exposed typically receive fairly low annual doses, the contribution to the average annual per capita effective dose to the population from occupational exposure is very low, 0.005 mSv (<0.1%). However, among those occupationally exposed to radiation, the average annual effective dose was 1.1 mSv.
In 2006, medical personnel, whose occupational exposures were monitored, received an average annual effective dose of approximately 0.75 mSv (NCRP, 2009). This average is somewhat lower than might be expected because the doses to many staff members are quite low (e.g., radiology supervisors and radiologists who perform few if any fluoroscopic procedures). For example, occupational doses to radiologists not routinely performing interventional procedures have been declining in recent years and an average annual effective dose of approximately 0.1 to 0.2 mSv is common (Linet et al., 2010). Similarly, full-time technologists working in large hospitals performing mostly CT and radiography examinations will typically have annual effective doses of approximately 0.5 to 1 mSv. However, the medical staff involved in fluoroscopically guided interventional procedures will typically have much higher occupational exposures. The actual doses received by the staff will depend on a number of factors including their roles in the procedures (i.e., performing or assisting), the number of procedures performed, the type and difficulty (which determines the lengths) of the cases, as well as the availability and use of radiation protection devices and techniques. Annual doses recorded by the dosimeters worn at the collar (outside the lead apron) in the range of 5 to 15 mSv are typical for personnel routinely performing these procedures. In reality, these are only partial body exposures (i.e., to the head and extremities), because the use of radiation-attenuating aprons greatly reduces the exposure to most of the body. Adjusting their measured exposures to account for the shielding provided is discussed in the following section on dosimetry. After adjusting for shielding, the effective dose is typically reduced by a factor of 3 or more compared to that recorded on the collar dosimeter.
For most routine nuclear medicine procedures, the effective doses to the technologists are typically less than 1 µSv per procedure, putting typical annual exposures in the range 2 to 3 mSv. However, for positron emission tomography (PET) procedures, an effective dose of 1 to 5 µSv per procedure has been reported (Guillet et al., 2005). Nuclear medicine technologists whose routine workload also includes dose preparation and imaging of patients for PET may have annual effective doses in the range of 10 to 15 mSv.
Airline crew members are estimated to receive an additional average annual effective dose of approximately 3.1 mSv; some receive effective doses of more than twice this value. It is interesting to note that the average annual effective dose to airline crew exceeds the annual effective doses of many diagnostic radiology personnel.
The contribution to the annual effective dose of members of the public (those not working in the industry) from activities related to commercial nuclear power production is minimal, approximately 0.5 µSv. Population radiation exposure from nuclear power production occurs from all phases of the fuel cycle, including uranium mining and processing, uranium enrichment, manufacturing of uranium fuel, reactor operations, and radioactive waste disposal.
21.1.5 Summary
The average annual effective dose to the US population from all radiation sources is obtained by dividing the annual collective effective dose by the size of the US population. The result in 2006 was approximately 6.2 mSv per year or approximately 17 µSv per day for all people in the United States from all sources, exclusive of radiation therapy. It is interesting to note that, although nuclear power, fallout from atomic weapons, and a variety of consumer products receive considerable attention in the popular media, they, in fact, cause only a small fraction of the average population exposure to radiation.
The average annual effective dose is somewhat misleading for categories such as the medical use of radiation, in that many people in the population are neither occupationally nor medically exposed yet are included in the average. Figure 21-2 presents a summary of the average annual effective dose for the US population from the radiation sources previously discussed.
21.2 PERSONNEL DOSIMETRY
The radiation exposure of some people must be monitored for both safety and regulatory purposes. Such assessments may need to be made over periods of several minutes to several months. There are three main types of individual radiation recording devices called personnel dosimeters used in diagnostic radiology and nuclear medicine: (1) film badges (usage has significantly declined, but still in use), (2) dosimeters using storage phosphors (i.e., thermoluminescent dosimeters [TLDs] or optically stimulated luminescence dosimeters [OSLs]), and (3) electronic personal dosimeters, each with advantages and disadvantages.
▪ FIGURE 21-2 Percent contributions of various sources of exposure to the annual collective effective dose (1,870,000 person-Sv) and the average annual effective dose per person in the US population (6.2 mSv) in 2006. Percentages have been rounded to the nearest 1%. (Adapted with permission from National Council on Radiation Protection and Measurements. Ionizing Radiation Exposure of the Population of the United States. NCRP Report No. 160. Bethesda, MD: National Council on Radiation Protection and Measurements; 2009. http://NCRPonline.org.)
Ideally, one would like to have a single personnel dosimeter capable of meeting all of the dosimetry needs in medical imaging. The ideal dosimeter would respond instantaneously, distinguish among different types of radiation, and accurately measure the dose and dose equivalent from each form of ionizing radiation, with energies from several keV to MeV, independent of the angle of incidence. In addition, the dosimeter would be small, lightweight, rugged, easy to use, inexpensive, and unaffected by environmental conditions (e.g., temperature, humidity, pressure) and nonionizing radiation sources. Unfortunately, no such dosimeter exists; however, most of these characteristics can be satisfied to some degree by selecting the dosimeter best suited for a particular application.
21.2.1 Film Badges
A film badge consists of a small sealed packet of radiation-sensitive film, similar to dental x-ray film, placed inside a special plastic holder that can be clipped to clothing. Although film badges are mostly historical in use, some locations and vendors still utilize these simple badges for occupational dose monitoring. Radiation striking the emulsion causes a darkening of the developed film. The amount of darkening increases with the absorbed dose to the film emulsion and is measured with a densitometer. The film emulsion contains grains of silver bromide, resulting in a higher effective atomic number than tissue; therefore, the dose to the film is not equal to the dose to tissue. However, with the selective use of several metal filters over the film (typically lead, copper, and aluminum), the relative optical densities of the film underneath the metal filters can be used to identify the approximate energy range of the radiation and to calculate the dose to soft tissue. Film badges typically have an area where the film is not covered by a metal filter or plastic and thus is directly exposed to the radiation. This “open window” is used to detect medium- and highenergy beta radiation that would otherwise be attenuated (Fig. 21-3).
Most film badges can record doses from about 100 µSv to 15 Sv (10 mrem to 1,500 rem) for photons and from 500 µSv to 10 Sv (50 mrem to 1,000 rem) for beta radiation. The film in the badge is usually replaced monthly and sent to the commercial supplier for processing. The developed film is usually kept by the vendor, providing a permanent record of radiation exposure.
Film badges are small, lightweight, inexpensive, and easy to use. However, exposure to excessive moisture or temperature can damage the film emulsion, making dose estimates difficult or impossible. As with film-screen image receptors in radiography, film-based dosimeters have all but disappeared in most countries.
21.2.2 Thermoluminescent and Optically Stimulated Luminescent Dosimeters
Some dosimeters contain storage phosphors in which a fraction of the electrons, raised to excited states by ionizing radiation, become trapped in excited states. When these trapped electrons are released, either by heating or by exposure to light, they fall to lower energy states with the emission of light. The amount of light emitted can be measured and indicates the radiation dose received by the phosphor material.
TLDs, discussed in Chapter 17, are excellent personnel and environmental dosimeters. The most commonly used TLD material for personnel dosimetry is lithium fluoride (LiF). LiF TLDs have a wide dose-response range of 100 µSv to 10 Sv and are reusable (Fig. 21-4). These dosimeters can be used over a long time interval (up to 6 months if necessary) before being returned to the vendor for analysis. The energy response is 0.8 to 5 MeV (Emax) for beta radiation and 20 keV to 6 MeV for x-ray and gamma (γ)-ray radiation.
▪ FIGURE 21-3 A film pack (A) consists of a light opaque envelope (B) containing the film (C). The film pack is placed in the plastic film badge (D) sandwiched between two sets of metal filters containing strips of (E) lead, (F) copper, aluminum, (G) and (H) polyethylene (plastic) filters. Film badges typically have an area where the film pack is not covered by a filter or the plastic of the badge and thus is directly exposed to the radiation. This “open window” area (I) is used to detect medium- and high-energy beta radiation that would otherwise be attenuated. The relative darkening of the developed film (filter pattern) provides a crude but useful assessment of the energy of the radiation. The diagram shows typical filter patterns from exposure to a high-energy beta emitter (Sr-90), a high-energy γ emitter (Cs-137), and x-rays with effective energies from 20 to 118 keV.
Another advantage of LiF TLDs is that their effective atomic number is close to that of the tissue; therefore, the dose to a LiF chip is close to the tissue dose over a wide energy range. TLDs do not provide a permanent record, because heating the chip to read the exposure removes the deposited energy. TLDs are routinely used in nuclear medicine as extremity dosimeters; a finger ring containing a chip of LiF worn on the hand is expected to receive the highest exposure during radiopharmaceutical preparation and administration. Figure 21-5 shows a finger ring dosimeter and a LiF chip.
Dosimeters using OSL are now widely available as an alternative to TLDs. The principle of OSL is similar to that of TLDs, except that the release of trapped electrons and light emission are stimulated by laser light instead of by heat. Crystalline aluminum oxide activated with carbon (Al2O3:C) is commonly used. Like LiF TLDs, these OSL dosimeters have a broad dose-response range and are capable of detecting doses as low as 10 µSv. As in film dosimeters, the Al2O3 has a higher effective atomic number than soft tissue and so an OSL dosimeter has filters over the sheet of OSL material that are used to estimate dose to soft tissue, as in film badges. However, OSL dosimeters have certain advantages over TLDs in that they can be reread several times and an image of the filter pattern can be produced to differentiate between static (i.e., in a fixed position with respect to a radiation source during exposure) and dynamic (i.e., normal) exposure. TLDs or OSL dosimeters are the dosimeters of choice when longer dose assessment intervals (e.g., quarterly) are required.
▪ FIGURE 21-4 TLD dosimeter with four LiF TLDs. The filters in this dosimeter are made of Mylar (7 mg/cm2), copper (300 mg/cm2), and polypropylene plastic (1,000 mg/cm2), representing the specified depths for determination of dose to the skin (“shallow dose”) at a depth of 0.007 cm, lens of the eye at a depth of 0.3 cm, and deep dose at a depth of 1.0 cm, respectively.
▪ FIGURE 21-5 A small chip of LiF (right) is sealed in a finger ring (underneath the identification label). In nuclear medicine, the ring is worn with the LiF chip on the palmar surface such that the chip would be facing a radiation source held in the hand.
21.2.3 Direct Ion Storage Dosimeters
Direct ion storage dosimeters use a non-volatile analog memory cell, surrounded by a gas-filled ion chamber, is used to record radiation exposure (Fig. 21-6) for photons initially, and now including betas in the latest technology. The initial interactions of the x-ray and γ-ray photons and betas occur in the wall material or thin windows, and secondary electrons ionize the gas of the chamber. The positive ions are attracted to a central negative electrode, resulting in a reduction in electrical charge and voltage that is proportional to the dose received by the dosimeter. The dose recorded by the dosimeter can be read at any time by connecting it to the USB port of any computer with Internet access. The advantages of this technology include a broad dose (0.001 mSv to 40 Sv) and photon energy (6 keV to 9 MeV) response ranges. These devices provide for unlimited real-time dose readings by the user without the need for a special reader, online management of dosimeter assignment and dosimetry reports, and elimination of the periodic distribution and collection of dosimeters as well as the delay and cost associated with returning the dosimeters for processing by the dosimetry vendor. Disadvantages include the initial cost of the dosimeters, more costly replacement of lost dosimeters, and the need for users to upload dosimetry information periodically.
21.2.4 Practical Aspects of Dosimeter Use
Nearly every medical facility obtains non-self-reading TLD or OSL dosimeters, from a commercial vendor monthly or quarterly. One or more control dosimeters are shipped with each batch. At the beginning of a wear period, typically at the beginning of a month, the new dosimeters are issued to staff and the used dosimeters from the previous wear period are collected and returned to the dosimeter vendor for reading. At least one control dosimeter from the same batch is included in the shipment. Control dosimeters are stored in an area away from radiation sources. The vendor subtracts the reading from the control dosimeter from the readings of the dosimeters that were used. An exposure report is usually available online through the vendor’s password-protected portal in about 2 weeks. However, reporting of unusual exposures or exposures over regulatory limits can be expedited. The dosimetry report lists the “shallow” dose, corresponding to the skin dose, the “eye” dose corresponding to the dose to the lens of the eye, and the “deep” dose, corresponding to penetrating radiations.
▪ FIGURE 21-6 Direct ion storage dosimeter.
21.2.5 Placement of Dosimeters on the Body
A dosimeter is typically worn on the part of the torso that is expected to receive the largest radiation exposure or is most sensitive to radiation damage. Most radiologists, x-ray technologists, and nuclear medicine technologists wear a dosimeter at the waist or shirt-pocket level. A pregnant radiation worker typically wears an additional dosimeter at waist level (behind the lead apron, if one is worn) to assess the fetal dose. During fluoroscopy, a dosimeter is typically placed at collar level in front of the lead apron to measure the dose to the thyroid and lens of the eye as most of the body is shielded from exposure. Alternatively, a dosimeter can be placed at the collar level in front of the radiation-protective apron, and a second dosimeter can be worn on the torso underneath the apron. The “double badge” method allows for the estimation of the effective dose equivalent (HE).
21.2.6 Estimating Effective Dose and Effective Dose Equivalent for Staff Wearing Protective Aprons
Protective aprons shield the torso and upper legs during diagnostic and interventional x-ray imaging procedures. Methods recommended by the NCRP that take this shielding into account allow for an effective dose and effective dose equivalent to be estimated. When a single dosimeter is worn at collar level outside the apron, the NCRP recommends that effective dose equivalent (HE) be calculated from the dose recorded by the collar dosimeter (HN) using Equation 21-1:
When a dosimeter is worn at collar level outside the protective apron and another dosimeter is worn underneath the apron at the waist or chest, the recommended method for calculating HE is to use HN and the dose (HW) recorded by the dosimeter worn under the lead apron in Equation 21-2:
These and similar equations for estimating the effective dose can be found in NCRP Report No. 122 (NCRP, 1995).
21.2.7 Electronic Personal Dosimeters
The major disadvantage to film, thermoluminescent, and OSL dosimeters is that the accumulated dose is not immediately displayed. Electronic personal dosimeters (EPDs) measure radiation exposure and can be read immediately on a digital display. There is a wide range of EPDs options from full-featured devices with event recording capabilities (Fig. 21-7) to others that simply display the accumulated dose (Fig. 21-8). These dosimeters typically use solid-state electronics and either Geiger-Mueller (GM) tubes or radiation-sensitive semiconductor diodes to measure and display radiation dose in a range from approximately 10 µSv to 100 mSv. EPDs typically include alarm functions to alert the wearer when a dose threshold is exceeded. EPDs should also be considered as supplemental dosimeters when high doses are expected, such as during cardiac catheterization or manipulation of large quantities of radioactivity. Table 21-2 summarizes the characteristics of the various personnel monitoring devices discussed above. Additional information specific to staff and patient radiation protection and monitoring during fluoroscopy is reviewed along with other x-ray imaging procedures in Section 21.6. Radiation dosimetry and other protection issues specific to Nuclear Medicine are discussed in Section 21.7.
21.2.8 Problems with Personnel Dosimetry
Common problems associated with dosimetry include dosimeters being left in radiation fields when not worn, contamination of a dosimeter with radioactive material, lost and damaged dosimeters, and the wearing of dosimeters improperly or not at all when working with radiation sources. If a dosimeter is positioned so that the body is between it and the radiation source, attenuation will cause a significant underestimation of the true exposure. Most personnel do not remain in constant geometry with respect to the radiation sources they use. Consequently, the dosimeter measurements are usually representative of the individual’s average exposure. For example, if a dosimeter is worn properly and the radiation field is multidirectional or the wearer’s orientation toward it is random, then the mean exposure over a period of time will tend to be a good approximation (±10% to 20%) of the individual’s true exposure.
▪ FIGURE 21-8 A simpler direct read digital pocket dosimeter.
21.2.9 Environmental Dosimetry
Placing environmental TLD or OSL in public spaces near the radiopharmacy, PET/CT imaging facilities, and any other areas for which there is a concern or perception that radiation exposure may be high in an uncontrolled space adjacent to controlled area is a recommended practice. These dosimeters are typically exchanged quarterly. While there are typically only background levels recorded on these dosimeters, they provide a relatively inexpensive independent record demonstrating that individuals working adjacent to these areas, who would not typically be wearing dosimetry, were not exposed to radiation in excess of regulatory limits for the public.
TABLE 21-2 SUMMARY OF PERSONNEL MONITORING METHODS
Widely used for personnel dosimetry and for phantom and patient dosimetry Advantage over TLD includes the ability to reread the dosimeters and distinguish between dynamic and static exposures
21.3 RADIATION DETECTION EQUIPMENT IN RADIATION SAFETY
A variety of portable radiation detection instruments, the characteristics of which are optimized for specific applications, are used in radiology and nuclear medicine. The portable GM survey meter and portable ionization chamber survey meter satisfy most of the requirements for radiation protection measurements in nuclear medicine. X-ray machine evaluations require specialized ion chamber or solid-state diode instruments capable of recording exposure, exposure rates, and exposure durations. All portable radiation detection instruments should be calibrated at least annually. A small radioactive check source can be used to verify an instrument’s response to radiation.
21.3.1 Geiger-Mueller Survey Instruments
One of the main advantages of GM survey instruments and their probes is that they react quickly during surveys to detect the presence and provide semiquantitative estimates of the intensities of radiation fields. Measurements from GM survey meters typically are in units of counts per minute (cpm) rather than mR/h, because the GM detector does not duplicate the conditions under which exposure is defined. In addition, the relationship between count rate and exposure rate with most GM probes is a complicated function of photon energy. If a GM survey meter is calibrated to indicate exposure rate (most commonly performed using a sealed source containing Cs-137 [662 keV γ-rays]), one should refer to the detector’s energy response curve before making quantitative measurements of photons whose energies significantly differ from the energy for which it was calibrated. However, with specialized energy-compensated probes, GM survey instruments can provide approximate measurements of exposure rate (typically in mR/h) over a wide range of photon energies, although with reduced sensitivity. The theory of operation of GM survey instruments was presented in Chapter 17.
A common application of GM survey meters is to perform surveys for radioactive contamination in nuclear medicine. A survey meter coupled to a thin window (˜1.5 to 2 mg/cm2), large surface area GM probe (called a “pancake” probe) is ideally suited for contamination surveys (see Fig. 17-7). Thin window probes can detect alpha (>3 MeV), beta (>45 keV), and x- and γ(>6 keV) radiations.
These detectors are extremely sensitive to charged particulate radiations with sufficient energy to penetrate the window but are much less sensitive to x- and γ radiations. These detectors will easily detect natural background radiation (˜50 to 100 cpm at sea level). These instruments have long dead-times resulting in significant count losses at high exposure (count) rates. For example, a typical dead time of 100 µs will result in an ˜20% loss at 100,000 cpm. Some GM survey instruments will saturate in high-radiation fields and read zero, which, if unrecognized, could result in significant overexposures. Portable GM survey instruments are best suited for low-level contamination surveys and should not be used in high-radiation fields or when accurate measurements of exposure rate are required unless specialized energy-compensated probes or other techniques are used to account for these inherent limitations.
21.3.2 Portable Ionization Chamber Survey Meters
Portable ionization chamber survey meters are used when accurate measurements of radiation exposure rates from x- and γ-rays are required (see Fig. 17-6). These ionization chambers approximate the conditions under which the roentgen is defined (see Chapter 3). They have many applications, including assessment of radiation fields near brachytherapy or radionuclide therapy patients, surveys of radioactive material packages, evaluation of the adequacy of radiation shielding, and measuring radiation fields during incidents in which people may be exposed to high levels of γ radiation. The main advantages of ion chamber survey meters are that they have linear responses over wide ranges of exposure rates and photon energies and that the quantities that they indicate, exposure rate or air kerma rate, are very useful in quickly deterring if an unsafe radiation exposure environment exists. The principles of operation of ion chambers are discussed in Chapter 17.
The ion chambers of some survey meters are filled with ambient air, whereas others have sealed ion chambers. Some of those with sealed chambers are pressurized to increase the sensitivity. The main advantage of measurements with ionization chamber bases instruments is that they are sufficiently accurate (±10%) for the photon energy and exposure rates likely to be encountered in medical imaging or therapy environments. For example, a typical portable ion chamber survey meter will experience only an ˜5% loss for exposure rates approaching ˜0.44 Gy/h (˜50 R/h). Specialized detectors are required to measure higher exposure rates.
All instruments have limitations and susceptibilities that users should be aware of, and ion chambers are no exception. A decrease in sensitivity can occur in the presence of low energy photons due to attenuation by the wall of the ion chamber and, only if the wall surrounds the ion chamber. The magnitude of the loss in sensitivity depends on the thickness of the material around the ion chamber and the energy of the photons (e.g., 30% under response at 20 keV is typical). Most portable ionization chamber survey meters respond slowly to rapidly changing radiation exposure rates. The lower the exposure rate, the longer the time necessary for the instrument to equilibrate and display its most accurate reading (i.e., response time). For example, typical response time for a portable handheld ion chamber in fields at the lower end of its range, ˜88 µGy/h (˜1 mR/h), is ˜8 s while at fields near the maximum of its range, ˜0. 44 Gy/h (˜50 R/h), the response time drops to ˜2 s. Some ionization chambers have a cover over one end of the detector, which serves as a buildup cap to establish electronic equilibrium for accurate measurement of higher-energy x- and γ-rays; it can be removed to improve the accuracy when measuring low-energy x- and γ-rays. Removing the cap also permits assessment of the contribution of beta particles to the radiation field. The slow response time and limited sensitivity of these detectors preclude their use as low-level contamination survey instruments or to locate a lost low-activity radiation source. These instruments must be allowed to warm up and stabilize before accurate measurements can be obtained. Some are also affected by orientation and strong magnetic fields (e.g., MRI scanners).
21.4 FUNDAMENTAL PRINCIPLES AND METHODS OF EXPOSURE CONTROL
21.4.1 Principles of Justification, Optimization, and Limitation as Applied to Medical Imaging and Therapy
The International Commission on Radiological Protection (ICRP) has formulated a set of principles that apply to the practice of radiation protection (ICRP, 2007a, 2007b, 2007c):
The principle of justification: Any decision that alters the radiation exposure situation, for example, by introducing a new radiation source or by reducing existing exposure, should do more good than harm, that is, yield an individual or societal benefit that is higher than the detriment it causes.
The principle of optimization of protection: Optimization of protection should ensure the selection of the best protection option under the prevailing circumstances, that is, maximizing the margin of good over harm. Thus, optimization involves keeping exposures ALARA, considering economic and societal factors.
The principle of limitation of maximum doses: In planned situations, the total dose to any individual from all the regulated sources should not exceed the appropriate regulatory limits.
While the ICRP recommends that the first two principles apply to medical exposure of patients, they do not recommend that the limitation of maximal doses be applied to patient dose from medical imaging or interventional procedures or during emergency situations.
Often the most appropriate way to reduce dose is to not perform an imaging procedure that is not medically warranted. This is key to the application of the principle of justification in medical imaging. The ICRP has identified three levels of justification for a radiological practice in medicine, including medical imaging (ICRP, 2007a, 2007b, 2007c). At the first and most general level, the proper use of radiation in medicine is accepted as doing more good than harm to society; that is, this general level of justification is taken for granted. At the second level, a specified imaging procedure with a specified objective is defined and justified (e.g., chest x-rays for patients showing relevant symptoms) to judge whether the radiological procedure will improve the diagnosis or will provide information necessary to properly treat the patient. At the third level, the application of the procedure to an individual patient should be justified (i.e., the particular application should be judged to do more good than harm to the individual patient). Once a particular procedure has been justified at these levels, then the dose should be optimized for the medical purpose for which it is being performed.
When applied to medical imaging, both the ALARA and the ICRP optimization principles imply using the lowest dose necessary to produce an examination result of appropriate diagnostic quality or, in the case of an image-guided intervention, to achieve the goals of the intervention. Therefore, reducing the examination dose to the point where important diagnostic information is lost or that results in the exam needing to be repeated is counterproductive and increases rather than decreases the overall risk to the patient. This is, in essence, the ALADA concept mentioned earlier.
The American College of Radiology (ACR) promulgates appropriateness criteria as evidence-based guidelines to assist referring physicians and other providers in making the most appropriate imaging or treatment decision for a specific clinical condition (i.e., implementing the principle of Justification). Several institutions have incorporated clinical decision support (CDS) software or applications as part of order entry systems to assist physicians and other clinicians in determining the most appropriate type of imaging exam (e.g., applying ACR appropriateness criteria scores) for a patient with specific symptoms or disease. Studies have shown this produced a significant improvement in imaging study appropriateness scores at some larger medical facilities (Huber et al., 2018, Ip et al., 2012, Sistrom et al., 2014). Implementation of a CDS is discussed in Chapter 5.
21.4.2 Methods of Exposure Control
There are four principal methods by which radiation exposure to persons can be minimized: (1) reducing the time (period) of exposure, (2) increasing distance from the radiation source, (3) shielding the source of the radiation, and (4) controlling contamination of radioactive material. Although these methods are widely used in radiation protection programs, their application to medical imaging is addressed below.
Time
Although it is obvious that reducing the time spent near a radiation source will reduce one’s radiation exposure, techniques to minimize the time in a radiation field are not always recognized or practiced. First, not all sources of radiation produce constant exposure rates. Diagnostic x-ray machines typically produce high exposure rates during brief time intervals. For example, a typical chest x-ray produces an entrance skin exposure of ˜0.175 mGy (˜20 mR) in less than 1/100 of a second, an exposure rate of 12.6 Gy/h (1,440 R/h). In this case, exposure is minimized by not activating the x-ray tube when staff are near the radiation source. Nuclear medicine procedures, however, typically produce lower exposure rates for extended periods of time. The time spent near a radiation source can be minimized by having a thorough understanding of the tasks to be performed and the appropriate equipment to complete them in a safe and timely manner. Similarly, radiation exposure to staff and patients can be reduced during fluoroscopy if the operator is proficient in the procedure to be performed, resulting in less x-ray beam-on time.
Distance
The exposure rate from a source of radiation decreases with increasing distance from the source, even in the absence of an attenuating material. In the case of a point source of radiation (i.e., a source whose physical dimensions are much less than the distance from which it is being measured), the exposure rate decreases by the inverse square of the distance between the measurement location and the source. This principle is called the inverse square law (ISL) and is the result of the geometric relationship between the surface area (A) and the radius (r) of a sphere: A = 4πr. Thus, if one considers an isotropic point radiation source at the center of the sphere, the surface area over which the radiation is distributed increases as the square of the distance from the source (i.e., the radius). If the exposure rate from a point source is X1 at distance d1, at another distance d2 the exposure rate X2 will be
For example, if the exposure rate at 20 cm from a source is 792 µGy/h (90 mR/h), doubling the distance will reduce the exposure by (½)2 = ¼ to 198 µGy/h (22.5 mR/h); increasing the distance to 60 cm decreases the exposure by (1/3)2= 1/9 to 88 µGy/h (10 mR/h) (Fig. 21-9).
This relationship is only valid for point sources (i.e., sources whose dimensions are small with respect to the distances d1 and d2). Thus, this relationship would not be valid near (e.g., <1 m from) a patient injected with radioactive material. In this case, the exposure rate decreases less rapidly than 1/(distance)2.
This rapid change in radiation intensity with distance is familiar to all who have held their hand over a heat source, such as a stovetop or candle flame. There is only a fairly narrow range over which the infrared (thermal, non-ionizing) radiation felt is comfortable. A little closer and the heat is intolerable; a little further away and the heat is barely perceptible. Infrared radiation, like all electromagnetic radiation, follows the inverse square law. The intensity of light, sound, and gravity also obeys the ISL law, as do other quantities.
▪ FIGURE 21-9 The inverse square law, showing the decreasing air kerma rate with distance from a point source.
Scattered radiation from a patient, x-ray tabletop, or shield is also a source of personnel radiation exposure. For diagnostic energy x-rays, a good rule of thumb is that at 1 m from a patient at 90° to the incident beam, the radiation intensity is approximately 0.1% to 0.15% (0.001 to 0.0015) of the intensity of the beam incident upon the patient for a 400 cm2 x-ray field area on the patient (typical field area for fluoroscopy). All personnel should stand as far away from the patient as practicable during x-ray imaging procedures and behind a shielded barrier or out of the room, whenever possible. The NCRP recommends that personnel should stand at least 2 m from the x-ray tube and the patient during radiography with mobile equipment (NCRP, 1989b).
Due to the higher photon energies emitted from most of the radionuclides used in nuclear medicine, it is often not practical to shield the technologist from the radiation emitted from the patient during a nuclear medicine exam (see “Shielding”). Distance is the primary dose reduction technique. The majority of nuclear medicine technologist’s annual whole-body radiation dose is received during patient imaging. Imaging rooms should be designed to allow a large distance between the imaging table and the computer terminal where the technologist spends most of the time during image acquisition and processing.
Shielding
Shielding is used in diagnostic radiology and nuclear medicine to reduce exposures of patients, staff, and the public. The decision to utilize shielding, and its type, thickness, and location for a particular application, are functions of the photon energy, intensity and geometry of the radiation sources, exposure limits at various locations, and other factors. The principles of attenuation of x- and γ-rays are reviewed in Chapter 3.
Shielding may be installed in a wall, floor, or ceiling of a room; this is commonly done for rooms containing x-ray imaging machines and PET/CT and SPECT/CT systems, and sometimes rooms housing patients who have been administered large activities of radiopharmaceuticals. Shielding may be in the walls of a cabinet used to store radioactive sources, around a work area, such as the dose preparation area in a nuclear medicine radiopharmacy. Shielding containers or enclosures may be used for individual sources such as an x-ray tube or a vial or syringe containing radioactive material. Shielding is incorporated behind the image receptors of fluoroscopes and radiographic machines and in the gantries of CT devices. Shielding is also worn as personal protective equipment (PPE) in the form of protective aprons, leaded glasses, and thyroid collars during fluoroscopy. Additional movable shielding is available in the form of freestanding and ceiling-mounted (often transparent lead acrylic) shields in fluoroscopic procedure rooms.
The maximum energy of x-rays from machines used for diagnostic and interventional imaging typically does not exceed ˜140 keV and the average energy of the x-ray spectrum is much less. The annihilation photons used in PET have energies of 511 keV and require the use of a high atomic number material for shielding such as lead to enhance photoelectric absorption thus reducing the thickness of the shielding compared to lower density materials. The energy of the γ-rays emitted by the other radionuclides used in nuclear medicine are typically less than 365 keV, although some radionuclides emit higher-energy γ-rays of low abundance. In general, placing shielding closer to a source of radiation does not reduce the thickness needed, but does reduce the mass of shielding necessary by reducing the area requiring shielding.
Design of Medical Imaging Facilities
Shielding is an important radiation safety consideration during the design phase of a medical facility whether it is an entire medical center, a radiology or interventional cardiology or nuclear medicine department, or a PET/CT imaging suite. For example, the weight of shielding, particularly for PET/CT facilities, must be supported by the building structure. Placing rooms, that would otherwise require heavy shielding, such as the PET/CT imaging room or PET uptake rooms, against the outside or corner walls of a building can substantially reduce the amount of shielding needed. Locating such rooms on the ground floor of a building obviates the need to install shielding below. Siting rooms of low occupancy, such as supply storage rooms, adjacent to imaging rooms can also reduce shielding requirements. The radiopharmacy should be located near injection and imaging rooms. Also, it is important to treat the location of nuclear medicine patient waiting areas (often occupied by patients containing radioactive material) as a source of radiation from which exposure to others should be kept ALARA.
21.5 STRUCTURAL SHIELDING OF IMAGING FACILITIES
The purpose of radiation shielding of rooms containing x-ray machines is to limit radiation exposures of employees and members of the public to acceptable levels. Several factors must be considered when determining the amount and type of radiation shielding. Personnel exposures may not exceed limits established by regulatory agencies. Furthermore, personnel radiation exposures must be kept ALARA.
Methods and technical information for the design of shielding for diagnostic and interventional x-ray rooms are found in NCRP Report No. 147, Structural Shielding Design for Medical X-Ray Imaging Facilities (NCRP, 2004). The recommended quantity for shielding design calculations is air kerma (K), with the unit of Gy; typical annual amounts of air kerma in occupied areas are commonly expressed in mGy. The recommended radiation protection quantity for the limitation of exposure of people to sources of ionizing radiation is effective dose (E), defined as the sum of the weighted equivalent doses to specific organs or tissues (the equivalent dose to each organ or tissue being multiplied by a corresponding tissue weighting factor, wT), expressed in Sv (see Chapter 3 for definition); for protection purposes, typical levels of E are expressed in mSv.
Areas to be protected by shielding are designated as controlled and uncontrolled areas; a controlled area is an area to which access is controlled for the purpose of radiation protection and in which the occupational exposure of personnel to radiation is under the supervision of a person responsible for radiation protection. Controlled areas, such as procedure rooms and control booths, may contain the x-ray and nuclear medicine imaging devices or are usually in the immediate vicinity. The workers in controlled areas are usually radiologic technologists, nurses, radiologists, and other physicians trained in the use of ionizing radiation and whose radiation exposures are typically individually monitored. Uncontrolled areas for radiation protection purposes are most other areas in the hospital or clinic, such as offices adjacent to x-ray rooms.
Shielding design goals, P, are amounts of air kerma delivered over a specified time at a stated reference point that is used in the design and evaluation of barriers constructed for the protection of employees and members of the general public from a medical x-ray or radionuclide imaging source or sources. Shielding design goals are stated in terms of K (mGy) at a reference point beyond a protective barrier (e.g., 0.3 m for a wall, a conservative assumption of the distance of closest approach). Because of conservative assumptions, achieving the design goals will ensure that the respective annual recommended values for E are not exceeded. The relationship between E and K is complex and depends on several factors, including the x-ray energy spectrum and the posture (e.g., standing or sitting) of the exposed individual. Because E cannot be directly measured, it is impractical to use it for a shielding design goal, and therefore, shielding design goals P are stated in terms of K.
There are different shielding design goals for controlled and uncontrolled areas. Radiation workers, typically employees, have significant potential for exposure to radiation in the course of their jobs, and as a result, are subject to routine monitoring by personal dosimeters. On the other hand, many people in uncontrolled areas have not voluntarily chosen to be irradiated and may not be aware that they are being irradiated. NCRP Report No. 147 recommends that the shielding design goal P for controlled areas be 5 mGy per year and that for uncontrolled areas be 1 mGy per year. These are equivalent to shielding design goals, P, of 0.l mGy per week for controlled areas, and 0.02 mGy per week for uncontrolled areas.
There are also air-kerma design goals for stored radiographic film and loaded film-screen cassettes to avoid film fogging. A shielding design goal, P, less than 0.1 mGy is recommended for the period in which radiographic film is stored. Since loaded screen-film cassettes and CR cassettes awaiting use are more sensitive to radiation, a P not to exceed 0.5 µGy for the period of storage (on the order of a few days) is recommended.
These shielding design methods are based upon conservative assumptions that will result in the actual air kerma transmitted through each barrier being much less than the applicable shielding design goal. These assumptions include (1) neglecting the attenuation of the primary x-ray beam by the patient (the patient typically attenuates the x-ray beam by a factor of 10 to 100); (2) assuming perpendicular incidence of the radiation on the barrier, which has the greatest transmission through the barrier; (3) ignoring the presence of other attenuating materials in the path of the radiation; (4) assuming a large x-ray beam field size for scattered radiation levels; and (5) assuming high occupancy factors for uncontrolled areas.
Shielding designed by these methods will keep the effective doses or effective dose equivalents received by workers in these areas much less than a tenth of the current occupational dose limits in the United States, will keep the dose to an embryo or fetus of a pregnant worker much less than 5 mGy over the duration of gestation, and will keep the effective doses to members of the public and employees, who are not considered radiation workers, less than 1 mSv per year.
21.5.1 Sources of Exposure
The sources of exposure that must be shielded in a diagnostic or interventional x-ray room are primary radiation, scattered radiation, and leakage radiation (Fig. 21-10).
Scatter and leakage radiation are together called secondary or stray radiation. Primary radiation, also called the useful beam, is the radiation passing through the open area defined by the collimator of the x-ray source. The amount of primary radiation depends on the output of the x-ray tube (determined by the kV, mGy/mAs, and mAs) per examination, the average number of examinations performed during a week, the fraction of time the x-ray beam is directed toward any particular barrier, the distance to the point to be protected, and the presence (or absence) of a primary barrier built into the imaging equipment. Scattered radiation arises from the interaction of the useful beam with the patient, causing a portion of the primary x-rays to be redirected. For radiation protection purposes scatter is considered as a separate radiation source with essentially the same photon energy spectrum (and penetrability) as the primary beam. In general, the exposure from scattered radiation at 1 m from the patient is approximately 0.1% to 0.15% of the incident exposure to the patient for typical diagnostic x-ray energies with a 20 cm × 20 cm (400 cm2) field area. The scattered radiation is proportional to the field size and can be calculated as a fraction of the reference field area. For CT applications, the rectangular collimation over a smaller volume will have a distinct scattered radiation distribution and is considered separately, as discussed below. Leakage is the radiation that emanates from the x-ray tube housing other than the useful beam. Because leakage radiation passes through the shielding of the housing, its effective energy is very high (only the highest energy photons are transmitted). The exposure due to leakage radiation is limited by FDA regulations to 0.88 mGy/h (100 mR/h) at 1 m from the tube housing when the x-ray tube is operated at the maximum allowable continuous tube current (usually 3 to 5 mA) at the maximum rated tube potential, typically 150 kV.
▪ FIGURE 21-10 The sources of exposure in a diagnostic x-ray room. A. Primary radiation emanating from the focal spot. B. Scattered radiation emanating from the patient. C. Leakage radiation emanating from the x-ray tube housing (other than the collimated primary radiation).
The primary and secondary radiation exposure of an individual in an adjacent area to be protected depends primarily on (1) the amount of radiation produced by the source; (2) the distance between the patient and the radiation source; (3) the amount of time a given individual spends in an adjacent area; (4) the amount of protective shielding between the source of radiation and the individual; and (5) the distance between the source of radiation and the individual.
21.5.2 Types of Medical X-ray Imaging Facilities
General purpose radiographic installations produce intermittent radiographic exposures using tube potentials of 50 to 150 kV, with the x-ray beam directed toward the patient and the image receptor. Depending on the type of procedures, a large fraction of the exposures will be directed towards the floor or to an upright image receptor, and sometimes to other barriers (as in cross-table lateral image acquisitions). Barriers that can intercept the unattenuated primary beam are considered primary barriers. A protected control area for the technologist is required, with the ability to observe and communicate with the patient. The viewing window of the control booth should be of similar attenuation as the wall and large enough to allow unobstructed viewing. The configuration of the room should not depend on the control area shielding as a primary barrier, and in no situation should there be an unprotected direct line of sight from the patient or x-ray tube to the x-ray machine operator or loaded CR cassettes, regardless of the distance from the radiation sources. Also, the switch that energizes the x-ray tube should be installed so that the operator cannot stand outside of the shielded area and activate the switch.
Fluoroscopic imaging systems are typically operated over a range of 60 to 120 kV. Since the image receptor is designed to also be a primary barrier, only secondary radiation barriers need to be considered in the shielding design. In some cases, a radiographic and fluoroscopic combined unit is installed, and the shielding requirements are based on the combination of the workloads of both units. In this case, the radiographic room issues discussed above must also be considered.
Interventional facilities include angiography and vascular interventional, neuroangiography, and cardiovascular and electrophysiology imaging suites. Like other fluoroscopic rooms, the walls, floors, and ceilings of interventional suites are considered to be secondary radiation barriers. However, they may have multiple x-ray tubes and the procedures often require long fluoroscopy times and include cine and digital fluorography image sequences that have large workload factors and so the rooms may require more shielding than general fluoroscopy rooms.
A dedicated chest radiography installation has the x-ray tube directed at the image receptor assembly on a particular barrier all of the time. Since the receptor can be used at various heights above the floor, the area behind the image receptor from the finished floor to a height of 2.1 m (7 ft) must be considered to be a primary barrier. All other areas in this room are secondary barriers, and any portion of the wall that the primary beam cannot be directed toward can also be considered a secondary barrier.
Mammography employs a very low kV in the range of 25 to 35 kV, and the breast support provides the primary barrier for the incident radiation. Thus, radiation barriers protect from secondary radiation only and given the low x-ray energies and the small volume of tissue irradiated, often all that is needed in a permanent mammography room is the installation of a second layer of gypsum wallboard. Doors for mammography rooms might need special consideration because wood attenuates much less than typical gypsum wallboard; a metal door may be advisable. For operator safety, mammography systems have transparent lead acrylic barriers to protect the control area.
CT uses a collimated x-ray fan beam intercepted by the patient and by the detector array; thus, only secondary radiation reaches protective barriers. The x-ray tube voltage used for most scans is 120 kV, over a range of 80 to 140 kV. As mentioned in Chapter 10, modern wide-beam multirow detector CT scanners (MDCTs) make more efficient use of the radiation produced by the x-ray tubes than did the now-obsolete single detector row scanners. MDCTs can perform extensive scanning without exceeding their heat limits, allowing more procedures per day, more contrast phases per procedure, and scans that cover more patient anatomy. Although the amount of scattered radiation per equivalent scan is not significantly more than that produced by a single-row scanner, a large number of scans per day can require a greater thickness of shielding for walls, and perhaps even additional shielding of floors and ceilings. Secondary scatter emanating from the scanner is not isotropic, as there are much higher radiation levels along the axis of the patient table than in the direction of the gantry (see Fig. 21-14). Assuming an isotropic scatter distribution is conservative in terms of the amount of shielding for the various barriers in a room, it provides flexibility for future CT scanner installations when different orientations are considered.
Mobile radiography and fluoroscopy systems (used in situations in which patients cannot be transported to fixed imaging systems or used in operating rooms or intensive care units) present a challenge for protecting nearby individuals. For bedside radiography, protection is chiefly accomplished by maintaining a distance from the source of radiation and keeping the primary beam directed away from anyone nearby. For mobile fluoroscopy, all individuals within 2 m of the patient should wear protective aprons, and if available, protective mobile shielding should be positioned between the patient and attending personnel. If a mobile system is routinely used in a particular room, there should be an evaluation of doses to adjacent areas to determine if additional shielding is necessary.
A bone mineral densitometry x-ray system typically uses a well-collimated scanning beam and, due to the low beam intensity and correspondingly low x-ray scatter, such a scanner will not produce scattered radiation levels above 1 mGy per year at 1 m for a busy facility, which is the shielding design goal for a fully occupied, uncontrolled area (NCRP, 2004). While structural shielding is not required in most situations, most states require a shielding evaluation demonstrating that fact to be submitted. The control console should be placed as far away as practicable to minimize exposure to the operator.
Dental and veterinary x-ray facilities require special consideration depending on the scope and unique attributes of the procedures. The NCRP has published reports that describe shielding and radiation protection requirements for these facilities. For these and all other applications and future developments, sources of ionizing radiation should be evaluated by a qualified expert in order to determine the type and nature of the shielding required in the facility.
21.5.3 Shielding Materials
X-ray shielding is accomplished by interposing an attenuating barrier between the source(s) of radiation and the area to be protected in order to reduce the exposures to below acceptable limits. The thickness of shielding needed to achieve the desired attenuation depends on the shielding material selected. Lead is the most commonly used material because of its high-attenuation properties and relatively low cost. Commercially available thicknesses of lead sheet are commonly specified in nominal weight per area (in pounds per square foot), with corresponding thicknesses specified in inches and millimeters, as shown in Figure 21-11. The actual masses per area are considerably less than the nominal values. The least thickness commonly installed is 2 lb/ft2 equal to 1/32 inch or 0.79 mm; there are little cost savings from using a lesser thickness. Other thicknesses and relative costs are compared in the figure. For typical shielding installations, the lead sheet is glued to a sheet of gypsum wallboard and installed with nails or screws on wood or metal studs. Where the edges of two lead sheets meet, continuity of shielding must be ensured by overlapping lead, as well as for gaps and inclusions in the wall (e.g., electrical junction boxes and switches).
Other shielding materials are also used, such as gypsum wallboard, concrete, glass, leaded glass, and leaded acrylic. Gypsum wallboard (sheetrock) is used for wall construction in medical facilities, and a nominal 5/8 inch thickness (14 mm minimum) is most often used. While there is little protection provided at higher energies, significant attenuation occurs at the low x-ray energies used for mammography. Because of possible non-uniformity of the gypsum sheets, it is prudent to specify an extra layer (e.g., two sheets of wallboard) when using this material for shielding. Concrete is a common construction material used in floors, wall panels, and roofs, and is usually specified as standard-weight (147 lb/ft3, 2.4 g/cm3) or lightweight (115 lb/ft3, 1.8 g/cm3). The concrete density must be known to determine the thickness needed to provide the necessary attenuation. When concrete is poured on a ribbed-profile steel deck, the thickness is not constant, and the minimum concrete thickness should be used for attenuation specifications. Glass, leaded glass, and leaded acrylic are transparent shielding materials. Ordinary plate glass may be used when protection requirements are low; its attenuation may be increased by laminating two or more 6-mm glass sections. More common and useful are leaded glass (glass with a high lead content) and leaded acrylic (impregnated with lead during manufacturing) that are specified in various thicknesses of lead equivalence, such as 0.5, 0.8, 1.0, and 1.5 mm.
▪ FIGURE 21-11 Relative cost of commercially available lead (Adapted with permission from National Council on Radiation Protection and Measurements. Structural Shielding Design for Medical X-Ray Imaging Facilities. NCRP Report No. 147. Bethesda, MD: National Council on Radiation Protection and Measurements; 2004, rev 2005. http://NCRPonline.org.). Lead is commercially sold by nominal weight in pounds per square foot (lb/ft2). Equivalent thickness in inches and millimeters are also stated. The height of each bar is the relative cost of lead sheet compared to 2 lb/ft2, normalized to a value of 1.
21.5.4 Computation of X-ray Imaging Shielding Requirements
Terminology
As stated above, the shielding design goals, P, are 0.1 mGy/wk for controlled areas and 0.02 mGy/wk for uncontrolled areas. The distance from the radiation source to the nearest approach to the barrier of the sensitive organs of a person in the occupied area must be chosen; the point of closest approach to the barrier is assumed to be 0.3 m for a wall, 1.7 m above the floor below, and, for transmission through the ceiling, at least 0.5 m above the floor of the room above, as shown in Figure 21-12.
The occupancy factor, T, for an area is defined as the average fraction of time that the maximally exposed individual is present while the x-ray beam is on. The maximally exposed individuals will usually be employees of the facility, or residents or employees of an adjacent facility. Recommended values for T are listed in Table 21-3, for use when information about actual occupancy for a specific situation is not known. The occupancy factor modifies the shielding design goal allowable at a given point by 1/T; in other words, the attenuation of a barrier must lower the radiation to a level given by the ratio P/T.
The workload (W) is the time integral of the x-ray tube current in milliampereminutes over a period of 1 week (mA-min/wk). In NCRP Report No. 147, a normalized average workload per patient, Wnorm, is also described; it includes multiple exposures depending on the type of radiographic exam and clinical goal. The total workload per week, Wtot, is the product of Wnorm and the average number of patients per week (N).
Unlike earlier shielding methods that assumed a single, fixed high kV value for the workload, the workload distribution described in NCRP Report No. 147 is a function of the kV, which is spread over a wide range of operating potentials for extremity examinations (e.g., about 1/3 of the total exams in a general radiographic room) at 50 to 60 kV, abdominal exams at 70 to 80 kV, and chest exams at greater than 100 kV (with reduced tube current-time product). Workload distributions are specific for a given type of radiological installation, including radiographic room (all barriers, chest bucky, floor, or other barriers), fluoroscopy tube (R&F room), radiographic tube (R&F room), chest room, mammography room, cardiac angiography, and peripheral angiography. For shielding design, the magnitude of the workload is less important than the distribution of the workload as a function of kV, since attenuation properties of the barriers have a strong kV dependence.
▪ FIGURE 21-12 A. Floor plan of a general-purpose radiographic room shows the location of the x-ray source, orientation and location of the x-ray beam for various acquisitions, and the adjacent areas with typical occupancy factors, T; shielding design goals, P; and an indication of primary and secondary barriers. Distances to each barrier are determined for the primary beam, leakage radiation from the x-ray tube, and scattered radiation from the patient. For secondary radiation, the closest distance is used. B. The elevation diagram provides information to determine the distances to adjacent areas above and below the x-ray room to be shielded. The floor-to-floor heights in multi-story buildings must be known.
TABLE 21-3 SUGGESTED OCCUPANCY FACTORS FOR ADJACENT AREAS
OCCUPANCY LEVEL
LOCATION
OCCUPANCY FACTOR (T)
Full
Administrative or clerical offices; laboratories, pharmacies, and other work areas fully occupied by an individual; receptionist areas, attended waiting rooms, children’s indoor play areas, adjacent x-ray rooms, film-reading areas, nurse’s stations, x-ray control rooms
1
Partial
Rooms used for patient examinations and treatments
Public toilets, unattended vending areas, storage rooms, outdoor areas with seating, unattended waiting rooms, patient holding areas
1/20
Outdoor areas with only transient pedestrian or vehicular traffic, unattended parking lots, vehicular drop-off areas (unattended), attics, stairways, unattended elevators, janitor’s closets
1/40
Reprinted with permission from National Council on Radiation Protection and Measurements. Structural Shielding Design for Medical X-Ray Imaging Facilities. NCRP Report No. 147. Bethesda, MD: National Council on Radiation Protection and Measurements; 2004, rev 2005. http://NCRPonline.org.
The use factor (U) is the fraction of the primary beam workload that is directed toward a given primary barrier and will depend on the type of radiographic room and the orientation of the equipment. In a dedicated chest room, the primary barrier has U = 1, since the x-ray beam is always directed toward the wall-mounted chest receptor, and all other walls are secondary radiation barriers. In a general radiographic room, U must be estimated for the types of procedures and the amount of time the x-ray beam will be used for a specific orientation. Most often, the x-ray beam is pointed at the floor for acquiring images with patients on the table, occasionally pointed at a wall for a cross-table acquisition, and pointed at a chest receptor stand for a combined room. For a general radiographic room, a survey of clinical sites (NCRP Report No. 147) yielded, for radiography not using a vertical chest receptor, U = 0.89 for the floor, U = 0.09; for the cross-table lateral wall, and U = 0.02 for an unspecified wall; for procedures using a vertical chest receptor stand, U = 1 for the chest receptor stand; and U = 0 for the ceiling and the control area barrier in that same room. For fluoroscopy and mammography, the primary beam stop is the image receptor assembly, so U = 0 and only secondary radiation must be considered.
The primary barrier, found in radiographic, dedicated chest, and radiographicfluoroscopic rooms, is designed to attenuate the primary beam to the shielding design goal. Unshielded primary air kerma at the point to be protected per week is dependent on the average number of patients per week (N), the use factor (U) for that barrier, the primary air kerma per patient at 1 m, and the distance to the point (inverse square law correction is applied).
The secondary barrier is designed to attenuate the unshielded secondary air kerma from leakage and scatter radiation to the shielding design goal (or less). All walls not considered primary barriers are secondary barriers. Scattered radiation from the patient increases with the intensity and area of the useful beam and is a function of the scattering angle. The total contribution from unshielded secondary air kerma, proportional to Wtot, is calculated from the clinical workload distributions, determined at 1 m, and modified by the inverse square law to the distance of the point to be protected, similar to that described for primary radiation. In certain orientations such as lateral acquisitions, the distance from the scattering source (the patient) will be different than the distance from the leakage radiation source (the x-ray tube) to the point to be protected.
Example Shielding Calculation
Room diagrams of a radiographic room are shown in Figure 21-12, with distances in meters from each of the radiation sources (primary, x-ray tube leakage, and scatter from the patient), as well as adjacent areas that are defined in terms of T, P, and primary or secondary barriers.
There are many complexities involved in calculating the necessary attenuation of the primary and secondary barriers to achieve the shielding design goals that are beyond the scope of this book. Many of the details regarding workloads, workload distributions, normalized workloads per patient (Wnorm), field size area, attenuation of primary radiation by the image receptor, and other nuances are incorporated into shielding thickness charts found in NCRP Report No. 147, which display the required shielding thicknesses for the various barriers as a function of N × T/(P × d2), where, as stated previously, N is the number of patients per week, T is the occupancy factor (see Table 21-3), P is the shielding design goal in mGy/wk, and d is the distance in meters from the radiation source to the point to be protected. In abbreviated notation, this is NT/Pd2. These charts, which assume specific normalized workloads per patient (Wnorm) as described in NCRP Report No. 147, are provided for radiographic and radiographic/fluoroscopic rooms for both lead and concrete shielding materials. If the site-normalized workload per patient (Wsite) is different, then the values of NT/Pd2 are scaled by Wsite/Wnorm. Primary beam use factors U are identified by specific curves in each chart for primary barriers.
Three of these charts are shown in Figure 21-13 for a radiographic room, considering (A) no primary beam preshielding, (B) primary beam preshielding, and (C) secondary radiation. The required lead thickness in millimeters is a function of NT/Pd2. The term “preshielding” refers to the attenuation of the primary beam by the image receptor. The graphs for primary beam preshielding consider the attenuation of the image receptor in the radiographic table or wall-mounted cassette holder due to the grid, cassette, and support structures, equivalent to 0.85 mm lead, and for crosstable laterals, attenuation due to the grid and cassette, equivalent to 0.3 mm lead. Note the decreased requirement for lead thickness with primary beam preshielding (e.g., for the chest bucky wall barrier and NT/Pd2 = 1,000, without preshielding the thickness is 1.95 mm lead and with preshielding is 1.13 mm lead, as shown in Fig. 21-13A and B, respectively).
For determination of barrier thicknesses using NT/Pd2 methods, scale drawings of the room, including elevation drawings, location of the equipment, designations of adjacent areas as controlled or uncontrolled, occupancy factors of adjacent areas, and distances to adjacent areas are necessary, in addition to the average number of patients, N, per week. Charts are selected according to room type and shielding materials. For example, using the diagrams in Figure 21-12, if N = 120 patients per week for a general radiographic room, then NT/Pd2 can be calculated for each barrier and the required lead thickness is determined from the graph. For the chest bucky wall primary radiation barrier with T = 0.2, P = 0.02 mGy/wk, and d = 2.4 m, NT/Pd2 = 120 × 0.2/(0.02 × 2.42) = 208 and, using the blue curve labeled chest bucky wall, the lead thickness required is about 1.3 mm to achieve the shielding design goal. Therefore, the primary barrier to be installed is specified as 4 lb/ft2 (1.6 mm) over the indicated area, which is from the finished floor to a height of 2.1 m (7 ft), with lateral margins around the image receptor of at least 0.5 m (e.g., a leaded drywall sheet 4 ft wide).
▪ FIGURE 21-13 Required lead barrier thickness for a radiographic room as a function of NT/Pd2, using Wnorm = 0.6 mA min patient-1 for the chest bucky and 1.9 mA min/patient for the floor and other barriers. A. No preshielding for primary barriers. B. Preshielding for primary barriers. C. Secondary lead barriers. In each of the graphs, the horizontal dotted lines indicate the common lead thicknesses of 0.79 and 1.58 mm, corresponding to 2 and 4 lb/ft2 lead sheet. (Adapted with permission from National Council on Radiation Protection and Measurements. Structural Shielding Design for Medical X-Ray Imaging Facilities. NCRP Report No. 147. Bethesda, MD: National Council on Radiation Protection and Measurements; 2004, rev 2005. http://NCRPonline.org.)
Shielding for secondary barriers is determined in a similar manner; however, because the total amount of secondary radiation emanates from a variety of locations and distances, the calculations can be very complex. A conservative approach is to assume that all of the secondary radiation in the room emanates from the closest distance to the barrier, which would increase the shielding thickness. Thus, for the wall adjacent to the chest wall bucky designated as a secondary barrier, the closest distance is 1.5 m, and NT/Pd2 = 120 × 0.2/(0.02 × 1.52) = 533. From Figure 21-13C, the thickness of lead (using the chest bucky secondary wall curve) is about 0.6 mm, and therefore the secondary barrier is specified as 2 lb/ft2, installed continuously and seamlessly with the adjacent primary radiation barrier. For the control area barrier with T = 1, P = 0.1 mGy/wk, d = 2.5 m, NT/Pd2 = 120 × 1/(0.1 × 2.52) = 192, and using the curve labeled “secondary wall,” the lead thickness is 0.15 mm, so 2 lb/ft2 of lead is specified. For the control area window, leaded acrylic is often used and would be specified as having an equivalent attenuation as the surrounding wall of 2 lb/ft2 or 0.8 mm lead. Note that in these situations, the conservative approach ensures more than adequate protection for individuals in adjacent areas and allows for increased room workload in the future. The shielding for each other radiation barrier, including doors, the floor, and the ceiling, is similarly calculated and specified.
In walls, the shielding (e.g., leaded drywall, leaded doors, leaded acrylic, and sheet lead) is usually installed from the finished floor to a height of 2.1 m (7 ft) with overlapping lead at the seams of at least 1 cm, and lead backing at electrical outlets and other access points (electrical junction boxes, plumbing, etc.) into the wall to ensure continuous protection. Attachment screws used for mounting leaded drywall do not need lead backing (the steel that displaces the lead combined with the length of the screw provides adequate attenuation), but care must be taken to ensure that the screws that penetrate the lead sheet remain in place to maintain shielding integrity.
Surveys after Shielding Installation
After installation of shielding, a radiation protection survey should be performed by a qualified expert to ensure the adequacy of the installed shielding. The survey should verify that the barriers are contiguous and free of voids and defects and provide sufficient attenuation to meet the relevant shielding design goal divided by the occupancy factor (P/T). Visual inspection during installation should be part of the evaluation, followed by transmission measurements using a γ-ray source of suitable energy (e.g., Tc-99m) and a detector with high sensitivity and fast response (e.g., GM survey meter). Alternatively, the x-ray source in the room can be used to generate a primary beam and secondary radiation, and measurements performed with a suitable high-sensitivity integrating survey meter.
Computed Tomography Scanner Shielding
For a CT scanner, all walls in the room are secondary barriers, because the detector array within the gantry is the primary radiation barrier. The scatter distribution emanating from the scanner is highly directional, being highest along the scanner axis (Fig. 21-14). Because most CT scans are acquired at 120 and 140 kV with a highly filtered beam, the scattered radiation is highly penetrating. Three methods can be used to determine the shielding requirements, one based upon CTDIvol, another based upon typical dose length product (DLP) values per acquisition, and the third based on the measured scatter distribution isodose maps provided by the manufacturer. For instance, using typical values for DLP, the scatter intensity (air kerma in mGy/acquisition) at 1 m is estimated for head and body scans, and then multiplied by the number of acquisitions (much greater than the number of patients due to multiple acquisitions being performed of many patients) expected over a typical work week for an 8-h shift (the busiest shift if the scanner is operated over extended hours). This is the total unshielded peak air kerma at 1 m from the gantry. For each barrier, the distance from the gantry to the calculation point beyond the barrier is determined, and the inverse square law is applied. A thickness of shielding is then determined to reduce the radiation level to the design goal modified by the inverse of the occupancy factor (P/T) by the use of specific transmission charts (Fig. 21-15).
▪ FIGURE 21-14 Secondary (scatter and leakage) radiation distributions for a 32-cm-diameter PMMA phantom, 40-mm collimation, 64-channel MDCT, 140 kV, 100 mA, 1 s scan. Actual secondary radiation levels must be scaled to the techniques used for the acquisition. A. Horizontal isodose scatter distribution at the height of the isocenter. B. Elevational isodose scatter distribution; the distribution is vertically symmetric above and below the level of the table.
▪ FIGURE 21-15 Lead thickness as a function of transmission factor for secondary radiation from a CT scanner operated at 120 kV. (Reprinted with permission from National Council on Radiation Protection and Measurements. Structural Shielding Design for Medical X-Ray Imaging Facilities. NCRP Report No. 147. Bethesda, MD: National Council on Radiation Protection and Measurements; 2004, rev 2005. http://NCRPonline.org.)
Example Barrier Calculation for a CT Scanner
A CT scanner performs 125 head procedures/wk and 150 body procedures/wk using a tube voltage of 120 kV and produces a scatter air kerma of 63.8 mGy/wk at 1 m from the gantry isocenter. A barrier that is 3.3 m (11 ft) from the gantry isocenter to an uncontrolled corridor with P = 0.02 mGy/wk and an occupancy factor T = 0.2 requires a transmission factor to reduce the radiation to a level less than P/T = 0.02/0.2 = 0.1 mGy/wk. At 3.3 m, the unshielded air kerma is 63.8/3.32 = 5.86 mGy/wk, and the transmission factor through the lead must, therefore, be less than 0.1/5.86 = 0.017. Consulting Fig. 21-15, this transmission factor requires a minimum of 1.0 mm lead. This is greater than 2 lb/ft, so 4 lb/ft2 is specified for this barrier. The shielding for other barriers of the CT scanner room is calculated similarly. For the floors and ceilings, a transmission chart with varying thicknesses of concrete should be used; if the thickness of concrete is insufficient, a sheet of lead should be installed above or below the concrete.
For multirow detector array scanners with collimator widths of 40 mm (and in some cases greater, up to 160 mm), the amount of scatter per gantry rotation for a specific kV and mAs will typically be much higher than that of a single-slice scanner. However, because of the increased axial coverage per rotation, the total mAs per scan will be a fraction of the single-slice scanner’s, on the order of two to four times lower, and thus, the amount of scatter per scan will be comparable. On the other hand, the acquisition speed allows a larger number of patients to be scanned, which can significantly increase the total amount of scatter that must be considered for shielding calculations. It is therefore prudent to determine the shielding for the peak patient workloads expected over a given work shift (8 h is typical, but in some cases, this can be up to 12 h on the job) to ensure adequate protection from secondary radiation in adjacent areas. Dose-reducing features on CT scanners, such as automatic tube current modulation, may reduce shielding requirements.
PET/CT and SPECT/CT Shielding
Most PET today is performed using the radiopharmaceutical F-18 fluorodeoxyglucose (FDG). In PET imaging with F-18 FDG, the radiopharmaceutical is administered to a patient, the patient rests for a period of about 45 to 90 min to allow uptake by cells and washout from other physiologic compartments, the patient urinates to remove activity from the bladder, and then the patient is imaged. The installation of shielding must be considered for the room containing the PET/CT system and for the uptake rooms where patients rest after radiopharmaceutical administration and before imaging. It is common for a PET/CT facility to have three uptake rooms per PET/CT system because a modern PET/CT system can scan about three patients an hour. Required shielding depends upon the patient workload, the activity administered per patient, the uses of areas near the PET/CT room and uptake rooms, and the distances to these nearby occupied areas. Because of the high energies (511 keV) of annihilation photons, the shielding thicknesses can be very large, and consideration must be given to whether the building can support the weight of the shielding. The amount of shielding needed can be minimized by placing the PET/CT and uptake rooms on the lowest floor (no shielding needed below) or on the top floor (no shielding needed above) and against an exterior wall or walls, thereby reducing or eliminating the need for shielding of one or two walls. Placing the uptake rooms adjacent to each other also reduces the weight of shielding needed. The amount of needed shielding can be further reduced by designing the area so that areas of low occupancy (e.g., storage rooms, mechanical and electrical equipment rooms, and bathrooms) are immediately adjacent to the uptake and PET/CT rooms. The shielding design methods for PET/CT facilities are described in AAPM Report No. 108, PET and PET/CT Shielding Requirements (AAPM, 2006).
Only gold members can continue reading. Log In or Register to continue
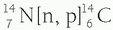 ). Although many cosmogenic radionuclides are produced, they contribute very little (˜0.01 mSv per year or <1%) to natural background radiation. The majority of the effective dose caused by cosmogenic radionuclides is from carbon 14.
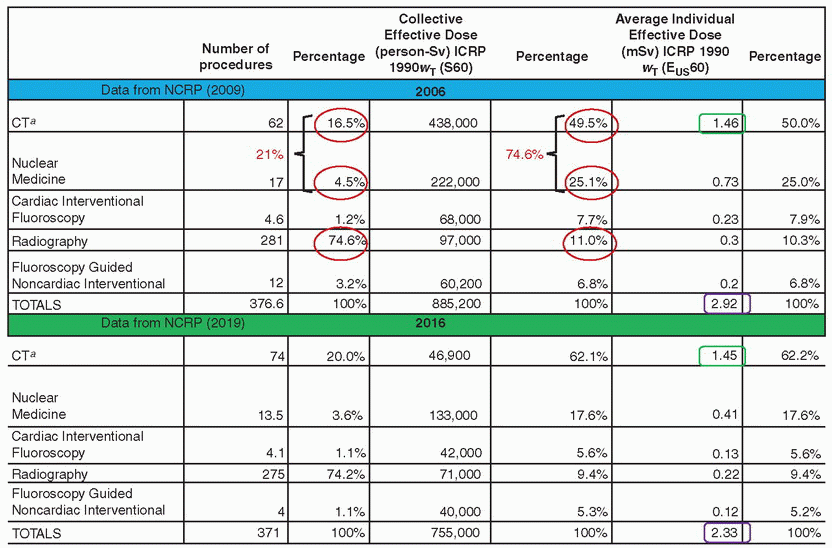


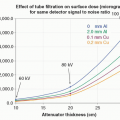 X-ray Production, Tubes, and Generators
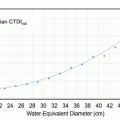 X-ray Dosimetry in Projection Imaging and Computed Tomography
 Radiation Detection and Measurement
 Magnetic Resonance Basics: Magnetic Fields, Nuclear Magnetic Characteristics, Tissue Contrast, Image Acquisition


