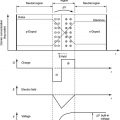
4 Most medical imaging modalities use ionizing radiation to interrogate the human body. Measuring, managing, and controlling the magnitude and the effects of this radiation thus become an essential component of medical imaging science and practice. This necessity also takes an ethical component when it comes to human safety. Since the early days of the discovery of radioactivity and X-rays, certain harmful effects of radiation have been recognized. As medicine is bound by the moral obligation of “first do no harm,” medical professionals involved with ionizing radiation need to understand the biological effects of the radiation and put precautions and processes in place to minimize its likelihood of harmful effects on the patients and the personnel. In this chapter, we cover the metrology of radiation assessment, followed by its cellular, animal, and human effects, finishing with the principles of radiation protection. The specification and measurement of radiation demand the assessment of the spatial and temporal distribution of the radiation. For some types of radiation, the distribution of energies must also be considered. A complete description of the effects of radiation on a material requires analysis of how the various components of the radiation field interact with atoms and molecules of the material. The term radiation is defined as energy in transit from one location to another. The term radiation intensity is used colloquially to refer to a number of attributes of the output of a radiation source. In physics and engineering, the term “intensity” is defined more specifically in terms of energy per unit area, per unit time. In this text, the term radiation intensity is given a specific definition. A beam of radiation is depicted in Figure 4.1. The radiation fluence of the beam Φ is defined as the number N of particles or photons per area A: If the beam is uniform, then the location or size of the area A is irrelevant so long as it is in the beam and perpendicular to the direction of the beam. If the beam is not uniform over its entire area, then the fluence must be averaged over a number of small areas, or the fluence must be specified separately for each area. The time rate of change of fluence, known as the radiation flux φ (sometimes termed the radiation flux density), is If the fluence varies with time, then the flux must be averaged over time or specified at some instant. If all particles or photons in the radiation beam possess the same energy, the energy fluence Ψ is simply the product of the radiation fluence Φ and the energy E per particle or photon: Similarly, the particle or photon flux φ may be converted to the energy flux ψ, also known as the intensity I, by multiplying by the energy E per particle or photon: If the radiation beam consists of particles or photons having different energies (E1, E2,…, Em), then the intensity (or energy flux) is determined by where fi represents the fraction of particles having energy Ei and the symbol Figure 4.1 The particle fluence of a beam of radiation is defined as the number of particles (N) passing through a unit area (A) that is perpendicular to the direction of the beam. If the beam is uniform, the location and size of the area A are arbitrary. Table 4.1 Fluence and flux (intensity) of a beam of radiationa aThese expressions assume that the number of particles or photons does not vary over time or over the area A and that all particles or photons have the same energy. bN = number of particles or photons; E = energy per particle or photon; A = area; t = time. Expressions similar to Eqs. (4.1)–(4.5) may be derived for any type of particle beam such as α, β, neutron, or high-energy nuclei. In the case of electromagnetic radiation such as X- or γ-rays, the photons have an energy E = hν. In the case of radiation that is described in terms of waves (such as ultrasound or radio waves), the definition of intensity (Eq. (4.4)) is modified as where Et is the total energy delivered by the wave during the time t. Although photon and energy flux densities and fluence are important in many computations in radiological physics, these quantities cannot be measured easily. Hence, units have been defined that are related more closely to common methods for measuring the radiation quantity. The measurement of X and γ radiation has presented technical challenges from the time of their discovery. In his initial studies, Röntgen used the blackening of a photographic emulsion, i.e. film, as a “dosimeter.” Nonlinearity and energy dependence of the film’s response caused difficulties in quantifying the amount of radiation energy deposited in the film. The “erythema dose,” (i.e. the amount of radiation required to produce reddening of the skin), was for many years the major dosimetry method for evaluating the effects of radiation treatment. Yet, biological variability and the lack of an objective measure of “reddening” made this also a major problem with quantifying radiation. In 1928, the roentgen (R) was defined as the principal unit of radiation quantity for X-rays of medium energy. The definition of the roentgen has been revised many times, with each revision reflecting an increased understanding of the interactions of radiation as well as improvements in the equipment used to detect these interactions. Over this same period, several other units of radiation quantity have been proposed. In 1958, the International Commission on Radiation Units and Measurements (ICRU) organized a continuing study of the units of radiation quantity, and recommendations on the use of radiation units and measures were developed by the International Commission on Radiological Protection (ICRP). The units described in earlier ICRU reports are considered the “traditional” system of units and the Système International (SI) units are utilized more universally. Both the traditional and SI systems may be used in this text with preference given to SI units. Table 4.2 gives a summary of units and conversion factors between them. Table 4.2 Traditional and Système International (SI) quantities Primary ion pairs (electrons and positive ions) are produced as ionizing radiation interacts with the atoms of an attenuating medium. Secondary ion pairs are produced as the primary ion pairs dissipate their energy by ionizing the nearby atoms. The concept of radiation exposure assumes that the absorbing medium is air. If Q is the total charge (negative or positive) liberated as X- or γ-rays interact in a small volume of air mass m, then the radiation exposure X at the location of the small volume is The total charge reflects the production of both primary and secondary ion pairs, with the secondary ion pairs produced both inside and outside of the small volume of air. The traditional unit of radiation exposure is the roentgen (R) (see Table 4.2), and the total number of ion pairs produced is proportional to the energy that the radiation deposits in the medium. The average energy required to produce ion pairs in a material is 33.85 eV per ion pair (IP) for air. The energy absorbed in a unit mass of air during an exposure X of 1 C/kg is Thus, for every coulomb/kilogram of exposure, air absorbs 33.85 J/kg of energy. The roentgen is applicable only to X and γ radiation and to photon energies less than about 3 MeV. That is, the roentgen cannot be used for particle beams or for beams of high-energy photons. For photon energies above 3 MeV, it becomes increasingly difficult to determine how many secondary ion pairs are produced outside of the measurement volume as a result of interactions occurring in the volume, and vice versa. There is no specially named unit for radiation exposure in SI. Instead, the fundamental units of coulomb and kilogram are used (see Table 4.2). From the definitions of energy and photon fluence and some fundamental quantities that have been determined for air, we may calculate the energy or photon fluence required to produce a given amount of exposure. From Eq. (4.8), the energy absorbed in air is 33.85X (J/kg) during an exposure to X C/kg. The absorbed energy can also be defined as (energy fluence) × (total mass energy absorption coefficient) or where (μen)m is the total mass energy absorption coefficient for X- or γ-ray photons that contribute to the energy fluence. The coefficient (μen)m is defined as where μm is the total mass attenuation coefficient of air for photons of energy hν and Ea represents the average energy transformed into the kinetic energy of electrons and positive ions per photon absorbed or scattered from the X- or γ-ray beam [1]. The average energy Ea is corrected for characteristic X-rays radiated from the attenuating medium and for bremsstrahlung produced as electrons interact with nuclei within the attenuating medium. By combining Eqs. (4.9) and (4.10), The energy fluence per unit exposure (Ψ/Χ) is where (μen)m is expressed in units of m2/kg, Ψ in J/m2, and Χ in C/kg. For monoenergetic photons, the photon fluence per unit exposure Φ/Χ is the quotient of the energy fluence/roentgen divided by the energy per photon: From Eq. (4.13), with hν expressed in MeV and Φ in units of photons/m2. The photon and energy fluence per unit exposure are plotted in Figure 4.2 as a function of photon energy. At lower photon energies, the large influence of photon energy upon the energy absorption coefficient of air is reflected in the rapid change in the energy and photon fluence per unit exposure. Above 100 keV (i.e. 10−1 MeV), the energy absorption coefficient is relatively constant, and the energy fluence per unit exposure does not vary greatly. However, the photon fluence per unit exposure decreases steadily as the energy per photon increases. Figure 4.2 Photon and energy fluence per exposure, plotted as a function of the photon energy in MeV. Chemical and biological changes in tissue exposed to ionizing radiation depend on the energy absorbed in the tissue from the radiation, rather than on the amount of ionization that the radiation produces in air. To describe the energy absorbed in a medium from any type of ionizing radiation, the quantity of radiation should be described in the SI units of gray. The gray (Gy) is a unit of absorbed dose and represents the absorption of one joule of energy/kilogram of absorbing material: The gray (Gy) is also a unit of kerma, defined as the sum of the initial kinetic energies of all charged particles liberated by indirectly ionizing particles (and photons) in a volume element, divided by the mass of matter in the volume element. Under the conditions of charged-particle equilibrium with negligible energy loss by bremsstrahlung, kerma and absorbed dose are identical. The output of X-ray tubes is sometimes described in terms of “air kerma” expressed in terms of energy deposited per unit mass of air. The name of the quantity “kerma” is an acronym for the phrase “kinetic energy released in the medium” with an “a” added for convenience. The absorbed dose D in gray delivered to a small mass, m, in kilograms is where E, the absorbed energy in joules is “the difference between the sum of the energies of all the directly and indirectly ionizing particles that have entered the volume and the sum of energies of all those which have left it minus the energy equivalent of any increase in the rest mass that took place in nuclear or elementary particle reactions within the volume” [2]. This definition means that E is the total energy deposited in a small volume of irradiated medium, corrected for energy removed from the volume in any way. The chemical and biological effects of irradiation depend not only on the amount of energy absorbed in an irradiated medium but also on the distribution of the absorbed energy within the medium. For equal absorbed doses, various types of ionizing radiation often differ in the efficiency with which they elicit a particular chemical or biological response. The relative biological effectiveness (RBE) describes the effectiveness or efficiency with which a particular type of radiation evokes a certain chemical or biological effect. The RBE is computed by comparing the results obtained with the radiation in question with those obtained with a reference radiation (e.g. medium-energy X-rays or 60Co radiation): For a particular type of radiation, the RBE may vary from one chemical or biological response to another. Listed in Table 4.3 are the results of investigations of the RBE of 60Co radiation. For these data, the reference radiation is medium-energy X-rays. It is apparent that the RBE for 60Co γ-rays varies from one biological response to the next. Table 4.3 RBE of 60Co gammas, with different biological effects used as a criterion for measurementa aThe RBE of 200-kV X-rays is taken as 1. bLD50 = median lethal dose. The RBE in sievert (Sv) is the product of the RBE and the dose in gray: The ICRU has suggested that the concept of RBE dose should be limited to descriptions of radiation dose in radiation biology [2]. That is, RBE dose pertains only to an exact set of experimental conditions and is not applicable to general radiation protection situations. Unfortunately, there are several different quantities that all use the SI unit of sievert (Sv). In many situations, they are approximately equal in magnitude. The differences lie in the various attempts that can be made to take into account one or more of the parameters that help to predict the extent of biological damage that may be produced by a given absorbed dose of ionizing radiation. These parameters reflect variation in the following: Often the effectiveness with which different types of radiations produce a chemical or biological effect varies with the linear energy transfer (LET) of the radiation (see Section 4.3.3.2). In the early 1990s, dosimetry and epidemiological results from the studies of the survivors of the atomic bombs dropped on Hiroshima and Nagasaki in 1945 began to yield statistically robust analysis of the relative sensitivities of different tissues to the effects of radiation and the consequences to the organism from doses delivered to specific tissues and organs [3,4]. This work also affected the assignment of factors to account for the energy and type of radiation. When the average dose to an organ was known, the risk could be assigned in terms of more recent estimates of fatality from cancer. In addition, the new factors consider the detriment from nonfatal cancer and hereditary effects for future generations. In view of these changes, and to differentiate from the older system of dosimetry, the term equivalent dose was used to refer to the product of the average organ dose and the newly defined radiation weighting factors, WR (see Table 4.4). The equivalent dose is determined by multiplying the absorbed dose by the appropriate radiation type weighting factor. In older publications, you may see a similar value called the “quality” factor and labeled Q. If more than one type of radiation is interacting with tissue at the same time, the summation of the contribution from each type would need to be taken into account. Table 4.4 Radiation weighting factors Source: Based on ICRP 2007 [5]. Reproduced with permission of International Commission on Radiological Protection (ICRP). In addition to radiation weighting factors, tissue weighting factors, WT, have also been defined (see Table 4.5). These values are formulated to obtain a quantity termed effective dose by multiplying the equivalent dose by these tissue weighting factors (see Table 4.4). If more than one tissue is irradiated, the summation of the contribution from each tissue weighting factors would need to be taken into account. Table 4.5 Tissue weighting factors Source: Based on ICRP 2007 [5]. Reproduced with permission of International Commission on Radiological Protection (ICRP). Radiation damage to tissue occurs only if the transfer of energy is sufficient to produce a biological effect. The primary interaction of radiation with tissue is with electrons. The result is either the removal of electrons (i.e. ionization) or the changing of the energy state of the electrons (i.e. excitation and/or heating). Potential radiation interactions and the resultant effect are diagramed in Figure 4.3. It is the mechanism of damage that is important. Although heat is always produced during radiation interactions, the mechanism for radiation bioeffects is not heating of tissue. A dose of over 4 kGy is required to raise the average temperature of water (or soft tissue) by 1 °C. Temperature elevations on the order of 1 °C or less are overshadowed by normal metabolic fluctuations in mammalian organisms; therefore, heating effects are negligible below a dose of several kilogray. Figure 4.3 Potential radiation interactions and the resultant effect. The effects of radiation are traceable to the disruption of chemical bonds [6–9]. As several repair mechanisms exist for macromolecules and as the concentration of molecules often exceed the minimum concentration required for cellular function, massive amounts of chemical disruption are necessary to cause discernible effects. There is, however, an exception to this conclusion because there exists a critical site of radiation damage within cells, that site is deoxyribonucleic acid (DNA). DNA is a critical site for direct radiation damage in a cell because copies of the DNA molecule are not present. The impact of damage to DNA affects the ability of the cell to function and reproduce, whereas alteration of most other biological molecules within a cell simply reduces the number of those molecules available for chemical reactions. Alterations of DNA cause information to be “read” erroneously by the cell so that it loses or changes its normal function. In addition, if the cell in question is a germ cell, the transfer of information to the next generation of the organism may be compromised. Direct effects of radiation are caused by electrons released during ionization directly interacting with molecules to cause damage. Although direct ionization of DNA can cause breaks in its molecular structure, the probability of this occurring is small. The major contributor to DNA damage is through indirect interactions of radiation where ionized molecules interact with other molecules altering their structure, and it is these “altered” molecules that cause DNA damage. One main contributor to this indirect DNA damage is through the formation of free radical molecules. A free radical is an electrically neutral chemical species that has an unpaired electron and is chemically very reactive. A free radical can be any molecular species capable of independent existence that contains an unpaired electron. Free radical formation occurs continuously in cells because of both enzymatic and nonenzymatic reactions. Free radicals are generated in our body by various systems because of exposure to different chemical conditions or pathological states, e.g. white blood cells produce free radicals in defense to kill invading pathogens. A balance between free radicals and agents that reduce the number of free radicals is necessary for proper physiological function, but when generated in excess or not appropriately controlled, free radicals can cause devastation on a broad range of macromolecules including lipids, proteins, and nucleic acids. A prominent feature of free radicals is that they have extremely high chemical reactivity, which explains not only their normal biological activities but how they inflict damage on cells. Free radicals interact with other molecules to gain a stable configuration of electrons. To do this, they convert the target molecule into a free radical. Therefore, a chain reaction begins that will propagate until two radicals meet each other and each contributes its unpaired electron to form a covalent bond linking the two. There are many types of free radicals, but those of most concern in biological systems are derived from oxygen and are known collectively as reactive oxygen species. Oxygen has two unpaired electrons in separate orbitals in its outer shell. This electronic structure makes oxygen especially susceptible to free radical formation. Reactive oxygen species include hydrogen peroxide (H2O2), superoxide (•O2−), singlet oxygen (1O2), perhydroxyl (•HO2), and hydroxyl (•OH). When radiation ionizes water, it produces a free electron and a water ion (see Figure 4.4). The water ion can combine with another water molecule to form hydroxyl free radicals. Hydroxyl free radicals can interact with chromatin and result in a wide range of sugar and base-derived products, i.e. DNA protein cross-links and single- and double-strand breaks. It is the double-strand breaks in DNA that are difficult for a cell to repair, or repair correctly, and free radicals are efficient at causing these double-strand breaks. Figure 4.4 Free radical formation from the interaction of ionizing radiation and water. To determine how radiation affects cells, individual cell lines may be grown in culture and replicating on a time scale that reflects the growth kinetics of the specific cell line. The effects of various agents on cell survival under controlled laboratory conditions can be studied in these cell cultures. However, direct observation of metabolic processes in cells is difficult, so a more practical end point for the observation of the effects of an agent on cells is cell death (i.e. apoptosis) or cell survival. However, the definition and detection of cell death is also challenging, and a more easily recognized end point is loss of reproductive capacity. Therefore, a primary marker of cell survival after exposure to an agent is in terms of the fraction of cells that are able to replicate as evidenced by their ability to form colonies in culture. The inability of a cell to divide and form a colony is referred to as “reproductive death.” A cell that experiences reproductive death may still be “metabolically alive,” yet it will not be able to continue the cell function indefinitely and will ultimately die [10]. A graph showing the surviving fraction, defined in terms of reproductive capacity, of a cell population as a function of dose of an agent is referred to as a cell survival curve. It is conventional to show the surviving fraction on a log plot vs. the amount of the agent delivered, i.e. cell survival curves are semi-log plots. A typical cell survival curve from X-ray exposure is shown in Figure 4.5. The fraction of surviving cells is unity when the dose of an agent that affects cell survival is zero. As the dose is increased, the surviving fraction may remain equal to or near one. This is because small doses of an agent may have no effect on the reproductive capacity, or if cells are damaged, the damage may be repaired before the next replication. This repair of sublethal damage produces the initialed arched portion of the curve, i.e. the shoulder observed on cell survival curves from X-ray exposure. The width of the shoulder on a cell survival curve reflects the number of sensitive targets that must be inactivated in the cell before the cell survival curve begins to decrease exponentially (i.e. reach the straight-line portion of a semi-log plot). There are two models that describe the shape of cell survival curves. The first model is a “multitarget” model of cell survival. In this model, after a large enough number of targets within a cell are damaged, the cell can no longer reproduce. The number of targets that must be inactivated is found by extrapolating the straight-line portion of the cell survival curve back to the vertical axis. The value of the surviving fraction at the intersection with the vertical axis is the extrapolation number, n, representing the average number of sensitive targets per cell. A wider shoulder yields a point of intersection higher on the vertical axis, implying that more targets must be inactivated. The extrapolation number for mammalian cells exposed to X-rays is highly variable and ranges from 1 (i.e. no shoulder, single hit, single-target model) up to 20. In actual cell survival curves, the shoulder probably indicates the effects of repair enzymes as well as the number of targets. It may not be possible to identify and specify the characteristics of sensitive targets within cells by using survival curves alone, but they can demonstrate the effects an agent has on the cell line as a whole. Figure 4.5 Cell survival curves. (a) The graph is a representation of a cell survival curve from radiation exposure and the variables used to define the curve based on the multitarget model. (b) The graph shows the variables used to define the curve based on the linear-quadratic model. From the multitarget model, the reciprocal of the slope of the linear portion of the survival curve is defined as a constant, D0, and when the dose equals D0, it is called the mean lethal dose. As this is the linear portion of a semi-log plot, the mean lethal dose is the dose required to reduce the “survival” by e−1 or 37%. Because of this, D0 has also been called D37. In general, the steeper the curve, the more sensitive the cells are to the agent. D0 is 1–2 Gy for most mammalian cells exposed to X-rays. In the multitarget model, another measure of the shoulder is the quasi-threshold dose Dq. If the surviving fraction of cells is unity up to a certain dose and decreases exponentially beyond that dose, then such a dose would be a true threshold, i.e. a dose below which there is no loss of cell reproduction. The quasi-threshold dose, while not implying a true threshold, characterizes the end of the shoulder. It may be estimated as the dose at which a horizontal line at the level of a surviving fraction of one crosses the extrapolated straight-line portion of the cell survival curve [11]. It may also be shown that Dq for mammalian cells ranges from 0 to 6 Gy. The second model of cell survival is the linear-quadratic model. In this model, the cell survival curve is modeled as an exponential function with two components, the first is proportional to the dose and the second is proportional to the square of the dose. This division of the dose response into a linear and quadratic relationship was developed based on early work on cell damage from radiation demonstrating two distinct types of chromosome breaks that occur and the cells’ ability to repair the damage accurately. Based on this relationship, the cell survival curve can be described mathematically as where α and β are constants. If both components are equal, i.e. αD = βD2, then D = α/β (see Figure 4.5). When fitting the curve using a linear-quadratic model, there is no straight-line portion to the fit, it is a continuously curving function. Yet, from actual experiments for cell survival from radiation exposure, all mammalian cell lines exhibit some straight-line portion if the dose is high enough, i.e. cell killing is a simple exponential function of dose at high doses. However, for the radiation dose levels received in medical procedures, including radiation therapy, the linear-quadratic model is a better model for defining the curve because at these dose levels, all aspects of the curve can be defined with one equation, and therefore, it is the standard model used for evaluating cell survival characteristics. Factors that influence the effects of radiation on cells may be characterized by how cell survival curves are changed. These factors include the presence of oxygen, LET, dose rate and fractionation, phase of the cell cycle, and presence of radiation modifiers. Oxygen influences the indirect effects of ionizing radiation by modifying free radical interactions. Hence, the presence of oxygen near the cell modifies the cell sensitivity to the effects of ionizing radiation. Two cell populations with different partial pressures of oxygen are illustrated in Figure 4.6. At a given dose beyond the shoulder of the cell survival curve, the surviving fraction is lower for cell lines under full oxygenation. This effect is termed the oxygen enhancement ratio (OER). The OER for human cells is approximately 2.5–3.5 for X-rays but has lower values for charged and uncharged particles. Figure 4.6 Cell survival curves showing the effect of oxygenation. Another aspect of cellular reaction to radiation with oxygen is that oxygen amplifies the effects of free radicals by allowing the radicals to “survive” long enough to migrate farther from their origin, thus expanding the potential area for biological damage. The LET is defined as the amount of energy deposited in a unit length along the distance traveled (see Chapter 1). Therefore, for ionizing radiation, LET is a measure of the density of ionizing events in a material. Ionizing radiation that deposits more energy over shorter distances have a higher probability of damaging DNA within the cell compared with radiations in which ionization is spread over larger distances. Therefore, damage is increased for a given radiation dose as the LET is increased. Particles with mass and charge have higher LET than photons. In addition, higher LET radiation produces relatively more damage by direct effects than by indirect effects. This is why the oxygen effect, basically a process that enhances indirect effects, is diminished for higher LET radiation. As the LET is increased, the width of the shoulder of the cell survival curves tends to decrease, reflecting an increase in damage per unit dose. Cell populations exposed to low- and high-LET radiation are compared in Figure 4.7. Higher LET radiation shows a disappearance of the shoulder in the cell survival curve, which implies that the effects related to the repair of sublethal damage are also diminish. Figure 4.7 Cell survival curves showing the effect of LET on cell survival. The shoulder disappears as LET increases. Compared with the radiation delivered at a higher dose rate, the radiation delivered at a lower rate may produce less cell killing even though the total doses are identical. Also, the radiation delivered at a high rate but in fractions or discrete doses separated in time may be less damaging to cells than the same amount of radiation delivered in a single session. The effect of increasing dose rate and fractionation upon cell survival is shown in Figures 4.8 and 4.9. Repair of sublethal damage is the mechanism underlying the dose rate and fractionation effects. An increase in dose rate may produce damage at a frequency that exceeds the capacity of the cell for repair. Yet, the aggregate amount of damage produced in a short, high dose-rate fraction may be repairable if a suitable interval is allowed before additional irradiation. Figure 4.8 shows the cell survival curve for radiation given in single dose and Figure 4.9 shows the resulting “effective” survival curve for the combination of fractionated doses, if an appropriate time is allowed between fractionations. Note that in this fractionated scheme, the individual doses are just beyond the shoulder. In most mammalian cells, a recovery period of 10–20 hours is required for a detectable modification of the cell survival through fractionation. This minimum period between fractions reflects the timing of events in the mammalian cell cycle [12]. Figure 4.8 Cell survival curves showing the effect of dose rate. Figure 4.9 Cell survival curves showing the effect of fractionated exposures. Human cells multiply by mitosis. The mitotic or cell cycle is graphically represented in Figure 4.10. Cells that are not dividing are not considered to be in the cell cycle. The cell cycle is divided into two parts, interphase and mitosis. During interphase, which occupies the majority of time in the cell cycle, the amount of cellular DNA is doubled as replicas of the chromosomes are synthesized. Interphase is subdivided into three stages: G1 or first gap lasting one to eight hours, S or DNA synthesis phase lasting six to eight hours, and G2 or second gap lasting two to four hours. During mitosis, the actions leading to cell division (i.e. fission of the cell) take place during a time period of approximately one hour. The actions associated with mitosis are further divided into four stages. During the first stage of mitosis, prophase, the nuclear membrane disappears. In the second stage, metaphase, a mitotic spindle forms and the chromosomes become attached to the spindle. During the third phase, anaphase, the chromosomes migrate along the spindle to opposite sides of the cell. During the last stage, telophase, nuclear and cell membranes reappear, and two cells are present where formerly there was only one. The length of time spent by particular cells in each stage of the cell cycle and the total length of the cell cycle affects the radiation sensitivity of the cell line [12]. In general, mammalian cells are most resistant in the late S phase, when there are multiple copies of the DNA present and most sensitive in late G2 and mitosis, when fission is occurring. Figure 4.10 The cell cycle in mammalian cells is divided into interphase (i.e. G1, S, and G2 phases) and mitosis. Cells are most sensitive to radiation in late G2 phase through mitosis, shown as increasing color from black/gray (least sensitive) to orange/yellow to red (most sensitive) on the diagram. All cells are more sensitive to external agents, including radiation, during the cell cycle. Therefore, cells that have a high replication rate are more sensitive to radiation damage. Chemical agents may be used to modify the response of cells to ionizing radiation. These agents generally influence the indirect effects of radiation, i.e. the effects of free radicals. Because of the speed with which free radical damage is produced, the agents must be present during irradiation. It is more difficult to modify the direct effects of ionization; therefore, high-LET radiation effects are usually not modified significantly by the administration of chemical agents. Agents that reduce the effects of radiation on cells are termed radioprotectors. Substantial interest in radioprotectors has been investigated because of their potential applications in military and space programs as well as for medical uses such as protection of normal tissues during radiation therapy. One group of researchers has synthesized over 2000 potentially radioprotective compounds in the past 40 years [13]. Mechanisms of action for radioprotectors include inactivation of free radicals by preferential binding or scavenging (e.g. sulfhydril components such as cysteine and cysteamine are good free-radical scavengers), induction of hypoxia to reduce the sensitizing presence of oxygen (e.g. epinephrine and carbon monoxide are often used to induce hypoxia), and occupation of sensitive sites in biomolecules by forming covalent bonds that are less easily disrupted by free radicals. Some protection against both direct and indirect effects has also been achieved by blocking cells in the G1 phase of the cell cycle, thereby allowing more time for the action of repair enzymes before the S phase where DNA is replicated. Radiosensitizers are agents that increase the effects of radiation on cells. Radiosensitizers are most applicable in radiation therapy where distinction must be made between “apparent” sensitizers and “true” sensitizers. Apparent radiosensitizers are toxic agents that are particularly effective in cases where radiation alone is less effective. True radiosensitizers are agents that promote both direct and indirect effects of radiation by inhibiting repair enzymes and weakening the sugar–phosphate bond of the DNA molecule. These include analogs of pyrimidines (5-bromodeoxyuridine [5-BUDR] and 5-iododeoxyuridine [5-IUDR]) and purines (6-mercaptopurine). The direct effects of radiation may also be enhanced through the use of compounds containing boron to increase the effects of neutron radiation therapy [14]. Low-energy neutrons (0.025 eV, or “thermal neutrons”) have an unusually high probability of interaction with boron compared with elements that are normally present in the body. When a neutron interacts with 10B, the unstable nuclide 11B is formed. The 11B fissions producing α-particles that deliver a high absorbed dose in the immediate vicinity of the boron-containing compound causing increased damage. Knowledge of the basic interactions of radiation at the cellular level is the foundation for understanding the bioeffects of radiation exposure. However, predictions based on simple cell models must be tested against actual exposure of organisms. Radiation effects involve complicating factors such as the presence of cocarcinogens and the actions of the immune system. These effects must be explored at a level of system complexity above that of the cell. Studies of animal survival following large doses of ionizing radiation have demonstrated a range of lethal doses that vary with the species and the irradiation conditions. A widely used measure of lethality is the dose required to kill 50% of the test animals within 30 days. This dose is called the LD50/30. Among mammalian species, the LD50/30 from whole body exposure varies from about 3 to 7 Gy, with a trend toward lower LD50/30 for larger mammals. Death at these dose levels is caused by depletion of hematopoietic precursor cells, resulting in death by infection and bleeding because of a lack of mature erythrocytes, leukocytes, and platelets in the circulating blood supply. Larger species tend to have fewer hematopoietic system stem cells per unit body weight and are therefore more susceptible to these effects of radiation [13,15]. Biological end points other than death have been studied extensively in animal populations. Tumor systems have been examined with regard to the effects of radiation therapy alone or in combination with other agents [16]. Normal tissue response has also been investigated in vivo by using end points such as skin reactions [17], breathing rate for lung tissue [18], neurologic tests for the spinal cord [19], and sterilization for gonadal irradiation [20]. In addition to reduced mortality and biological changes produced by radiation exposure, there is a natural rate of spontaneous mutation in any animal population. Exposure to an agent can alter this “normal” mutation rate. The genetic impact of an agent on a population is described by the doubling dose. The doubling dose is the amount of an agent required to double the spontaneous mutation rate in a population. The analysis of genetic mutations from radiation exposure being passed on to the next generations has been studied extensively in a number of species. To study these effects, dominant mutations need to be demonstrated in the first-generation offspring and within the next two generations, so studies must be carried out in populations that multiply rapidly, e.g. rodents [21,22]. Longer term multigenerational studies have been conducted since the 1920s in short-lived species such as the fruit fly, Drosophila melanogaster [4]. By the early 1950s, there was considerable evidence that radiation-induced mutation rates were higher in rodents than in the fruit fly. Furthermore, it was found that mutation incidence in Drosophila varied linearly with dose and appeared to have no threshold. Moreover, there appeared to be no dose rate effect, suggesting that damage caused by exposure of germ cells is cumulative. If these effects occur, then even a small amount of exposure per year, when summed over a lifetime, would lead to an appreciable risk of mutation from radiation. However, this is not seen in rodents or more complex life forms, i.e. humans. To answer some of the questions raised by the Drosophila data, a series of large-scale experiments (involving millions of mice, dubbed the “mega-mouse” experiments) were carried out in the early 1950s. These experiments were designed to examine the genetic effects of ionizing radiation on specific gene loci in mice. These loci determine observable traits such as coat color and ear size [23–25] and can therefore be followed in experimental populations. One of the most important conclusions of these experiments was that for genetic effects, the dose rate is an extremely important variable. At very low dose rates, no significant genetic effects were found, even when the total dose exceeded several gray. These results tempered the concern over occupational exposure of germ cells in humans when the dose rate is low. Another result of the mega-mouse experiments was that the delay of conception reduced the rate of genetic malformations in offspring. Thus, for gonadal doses large enough to create concern about genetic effects (e.g. above 0.1 Gy to the gonads from radiation therapy), delay of conception for up to six months following exposure could be helpful in preventing genetic effects [13]. The Life Span Study of the survivors of the atomic bombings at Hiroshima and Nagasaki and their descendants has been studied for more than 60 years to identify radiation-induced effects in humans. In addition, there are other studies that have enhanced our knowledge of radiation effects in humans, many of these are from early uses of radiation in medicine and accidents involving radiation [4,26]. These studies along with tissue and animal studies have provided a very good knowledge of how radiation effects are demonstrated in humans. In fact, radiation effects on humans have been one of the most studied agents compared to almost any other carcinogen. All the earth’s inhabitants are exposed to background radiation. Some of this radiation is man-made, such as radiation used in medical applications, and some is “natural.” Natural sources include cosmic rays, terrestrial, and internal radiation. Man-made radiation includes medical X-rays, consumer products, industrial sources, and some miscellaneous sources of radiation. Figure 4.11 shows the distribution of radiation sources. A typical US resident receives an average total of 6 mSv in one year from all sources of background radiation [27]. However, the actual background encountered by any one individual varies significantly, depending on where they live, what they eat, etc. Figure 4.11 Annual collective effective dose. Source: Adapted from NCRP Report 160 (2009) [27]. Cosmic rays have always bombarded the earth. A typical US resident receives 0.34 mSv from cosmic rays. The earth’s atmosphere provides some shielding from cosmic rays. This shielding is reduced at higher elevations, and the cosmic ray dose is increased in these regions, e.g. inhabitants of Denver, Colorado, at an elevation of 1600 m (1 mile), receive 0.50 mSv/yr from cosmic rays while those in Leadville, Colorado, at an elevation of 3200 m (2 miles), receive 1.25 mSv. The average value of 0.34 mSv reflects the distribution of the US population living at different elevations. Terrestrial background originates from radioisotopes that are found everywhere in our surroundings. All elements found in nature have radioactive isotopes, many of which are present in the areas we live. The exact composition of soil influences the local terrestrial background because the minerals present determine which elements are most abundant. Terrestrial background sources are categorized as “primordial” if their half-lives are the same order of magnitude as the presumed lifetime of the earth (i.e. 4.5 × 10⁹ years). That is, these sources were present when the earth was formed, and there is no way to replenish them in nature. Two isotopes of uranium, 238U and 235U, and one of thorium 232T, are primordial and give rise to three different decay series. In each of these series, the radioactive nuclides decay to stable isotopes of bismuth or lead. Seventeen other nuclides are primordial but are not part of a decay series. Of these nondecay series, radionuclides 40K and 87Rb make the greatest contribution to background dose. Internal background is the dose imposed by the isotopes contained in our bodies. A small percentage of the potassium in the human body is 40K. This radioactive nuclide emits both locally absorbed radiation and more penetrating gamma radiation. Similarly, 14C comprises a small percentage of the carbon atoms found in organic molecules throughout our bodies and contributes to a total dose of 0.28 mSv/yr to the average US resident from internal radiation. As part of the 238U decay series, radon (specifically, 222Rn, referred to hereafter as simply radon) is a source of significant exposure because it is an alpha emitter that exists as an inert gas. When radon is generated by the decay of 226Ra at some depth in the soil, it does not bind chemically with other elements. Instead, it percolates up to the surface to escape into the atmosphere. Being heavier than most constituents of the atmosphere, it tends to remain at lower elevations. Although minable deposits of uranium ore are primarily associated with granite rock formations, uranium is found everywhere in the earth’s crust. Ninety-nine percent of the uranium found in nature is 238U. Thus, the air we breathe anywhere on earth contains some amount of radon. Radon itself is not particularly hazardous when inhaled because it does not react and in most cases is simply exhaled. A more significant concern is that two of the decay products of radon (218Po and 214Po) are not inert. These products adhere to dust particles in the air, which may then be inhaled into the lung. The two alpha emitting isotopes 218Po and 214Po account for 85% of the dose to the lung from radon, two other beta and gamma emitting isotopes in the series, 214Pb and 214Bi, account for most of the remaining 15% of the dose. A typical US resident receives an annual dose equivalent of 2.3 mSv from radon and its decay products [27]. The exact value of radon dose equivalent received by an individual is most heavily influenced by the location where the person spends his or her time, i.e. inside or outside of buildings. With a combination of an unusually strong source (e.g. an unfinished crawl space below a house in a region with a high concentration of uranium in the soil) and air flow (e.g. radon buildup because of the lack of air exchange in an energy efficient house, or radon buildup because of a “chimney effect” in a drafty house), some homes can have radon levels that are significantly elevated. Although the risk to any one individual is very small, many people (i.e. the entire population) are exposed to some level of radon. By applying the linear, no-threshold model of radiation-induced cancer (see Section 4.4.5.3), one can estimate that a significant number of lung cancers may be caused each year by long-term exposure to high radon levels. Therefore, the US Environmental Protection Agency (EPA) recommends that radon concentrations be measured in buildings and that remedial action be taken if the radon concentrations exceed a certain level (e.g. 4 pCi/l of air). This level of radon has been estimated to yield a lung dose in a typical adult of 0.05 mGy. Various human activities add to the radiation background we receive. Foremost among these are diagnostic radiology and nuclear medicine [27]. Radiation received by patients in radiation treatment is not counted in man-made background because this is a therapeutic use. This omission has little impact on the average level of man-made background because the number of persons that receive radiation treatment is a very small fraction of the US population. Various consumer products may emit small amounts of radiation [28]. Some examples include smoke detectors that contain 241Am, an alpha emitter. Luminous markings on dials, clocks, and instruments contained 226Ra at one time but since 1968 have been completely replaced by 3H and 147Pm, both of which are low-energy beta emitters. The low-energy beta particles emitted by these substances are absorbed in the instrument components and provide negligible amounts of radiation dose to their owners. Collectively, consumer products are estimated to contribute approximately 0.1 Sv to the yearly dose from man-made background radiation. Other contributions to man-made radiation include the aspects of the nuclear fuel cycle, ranging from mining to transportation and waste storage. These components are thought to account for approximately 0.02 mSv/yr. The United States and other countries detonated over 500 nuclear weapons above ground during the time period from 1945 to 1963. This activity had a measurable effect on natural background radiation levels. In a nuclear explosion, new elements are created through the processes of nuclear fission and fusion. These elements are injected into the upper atmosphere by the force of the blast, where they drift over large distances before eventually returning to earth. The United States and the former Soviet Union ceased above-ground testing in 1963. A few countries conducted above-ground tests after that time, but by 1980, all above-ground testing has stopped. Individuals who were alive during the time period 1945–1980 received radiation doses because of inhalation and ingestion of some atoms of radioactive materials as a result of these tests. Calculation of this dose involves complicated functions of rate of uptake, rate of decay of the nuclides in individuals, rate of insertion of new isotopes into the environment, and other factors. The United Nations Scientific Committee on the Effects of Atomic Radiation (UNSCEAR) has estimated that an individual who was born before 1945 has received a total of 4.5 mSv because of nuclear testing. The current dose rate is estimated to be 0.01 mSv/yr [3]. As shown in Figure 4.3, there are two primary outcomes that can occur from radiation exposure, i.e. cell death or the alteration of DNA without cell death. Changes in a tissue’s function due to cell death following radiation exposure are called Deterministic effects. Deterministic effects are effects in which the outcome can be predetermined, i.e. they are predictable. Deterministic effects will occur if the energy absorbed in tissue is large enough to cause enough cells to die so that the tissue’s function is altered. The amount of absorbed energy in which this occurs is tissue specific and is called the threshold dose. Examples of tissues that are known to demonstrate the deterministic effects from radiation exposure are given in Table 4.6. For deterministic effects, as the absorbed energy increases above the threshold dose, the severity of damage also increases and the potential for repair decreases. Table 4.6 Dose threshold estimates for deterministic effectsa NA: These values are not applicable because of tissue repair mechanisms making fractionated exposures less relevant. aThese values are the 1% incidence level. Source: Based on ICRP publication 103 (2007) [5]. The threshold values in Table 4.6 are the absorbed energy where the effect is observed in 1% of a population and all of these doses are above 0.1 Gy. Reviews of all biological and epidemiological studies have shown that below 0.1 Gy, the deterministic effects from radiation exposure have not been proven. These are important findings for two reasons; first it suggests that only a small fraction of people exposed to 0.1 Gy or higher, either in one exposure or over a longer period of time, would demonstrate these effects; and second, a dose of 0.1 Gy is higher than most patients would receive in any single diagnostic radiology examination. Therefore, the deterministic effects are not typically seen in patients undergoing diagnostic procedures. There are some interventional/cardiology procedures and when multiple radiographic examinations are performed on the same patient in a short period of time where the cumulative dose can exceed the 0.1 Gy level. In these situations, the personnel performing the procedures need to be aware that the deterministic effects may occur in some of their patients. In addition, therapeutic radiation doses can easily exceed these values, and sparing of normal tissue from these effects is a major function of radiation therapy treatment planning. Note that all of the tissues listed in Table 4.6 are rapidly proliferating cells. As an example, the lens of the eye is one of the most radiosensitive tissues in the body. Epithelial cells on the outer surface of the cornea divide and differentiate into lens fibers to provide a steady growth of the lens fiber mass. This high proliferating rate is indicative of epithelial cells in general and causes these cells to be very sensitive to radiation exposure. Because of this, radiation damage to the eye causes cataracts to be formed and with continual exposure the cataract formation is amplified. This makes cataract formation one of the primary concerns for radiation workers. Deterministic effects of the fetus from exposure in-utero have been studied extensively in animals and in humans from the Life Span Study. What occurs depends on the time of the exposure relative to the stage of gestation and the radiation dose received by the uterus. A review of potential changes for exposures at dose levels that may be received from diagnostic radiology procedures is given in Table 4.7. Similar to other deterministic effects, below an absorbed dose to the uterus of 0.1 Gy, the effects are not seen. Yet, as with all deterministic effects, if the dose is above 0.1 Gy, the effects increase in severity and frequency with increasing dose. Table 4.7 Summary of suspected in utero induced deterministic radiation effectsa Source: Taken from [29] and derived from ICRP Publications 90 (2003) [30]. Reproduced with permission of SAGE Publications. From basic experiments involving cell cultures and laboratory animals, it is known that the dose rate plays a role in determining biological effects. In the range of total doses over which an effect is observed, the effect often decreases if the dose rate is lowered. Data in human populations support this concept [4,31]. Indeed, dose rate and dose fractionation are two commonly used principles of radiation therapy. Tissue repair mechanisms are not as robust in tumors as in normal tissue; therefore, fractionated radiation therapy treatments are designed to provide normal tissue a chance for repair while maintaining damage to tumor tissue. In addition, it is known that the deterministic effects from radiation exposures do not occur during or immediately after the exposure to radiation. Unlike the exposure to the sun that causes skin reddening within hours of the exposure, the effects from these high-radiation doses require weeks to months following the exposure to produce the effects. This is shown in the column labeled “Time to develop effect” in Table 4.6. This is because the deterministic effects result from necrosis of rapidly proliferating cells, vascular degradation, and overall tissue fibrosis. These changes take time to progress, and the organism will be trying to repair these throughout the process. However, as the radiation dose rate increases, these effects may appear more rapidly. If the radiation dose to any tissue is large enough, tissue damage will occur. In addition, in most tissues, the damage is greater, and the morbidity is greater if the amount of tissue irradiated is larger, e.g. whole organ irradiation produces a greater morbidity. This is due to the structure of tissues and organs into functional subunits (FSUs). A FSU is a set of tissues or organs whose ultimate function is dependent on the overall workings of each subunit, e.g. proper digestion of food requires the entire digestive tract to function properly. When the tissue or organ has parallel functional structure, rather than in series, damage may be compensated for more easily and some function can be maintained. Therefore, whole organ irradiation or irradiation of an entire FSU reduces or eliminates the ability of a tissue or organ to be repaired. Examples of whole organ irradiation effects can be seen following radiation therapy with the production of pericarditis and pneumonitis. In both of these processes, the dose threshold to the thorax to produce these effects is very large, e.g. 6–20 Gy. When very high radiation exposures are received, deterministic effects will occur. When the high exposure is to the whole body, these effects are known colloquially as “radiation sickness” or more formally as acute radiation syndrome. Acute radiation syndrome is divided into three subcategories, hematopoietic, gastrointestinal (GI), and cerebrovascular syndromes. These subcategories reflect both the relative sensitivities of various organ systems to radiation and the time required to produce effects on the overall health of the organism. From Table 4.6, a dose of only 0.5 Gy to the bone marrow can cause deterministic effects. This dose would need to be a large portion of the bone marrow to exhibit an acute effect, e.g. whole body irradiation. The stem cells of the hematopoietic system are precursors of mature blood cells that are found principally in the bone marrow and can be inactivated in significant numbers at doses of less than 1 Gy. The body may then lose the ability to combat infection resulting in death by the infection and/or bleeding because of a lack of mature erythrocytes, leukocytes, and platelets in the circulating blood supply. Loss of the precursor population may not pose a significant threat to the individual until it is time for the irradiated precursor cells to reach maturity. Thus, a latency period may occur for a week to a month, during which attempts may be made to reestablish the bone marrow population through transplants or other techniques. The cells associated with the GI tract, particularly epithelial cells that line the intestinal surfaces, are particularly susceptible to radiation damage because they have a rapid reproduction rate. Following an exposure of 6 Gy or more diarrhea, hemorrhage, electrolyte imbalance, dehydration, etc., occur as a consequence of cell damage. At doses above 50 Gy, damage to the relatively radiation-insensitive neurologic and cardiovascular tissue is severe enough to produce an almost immediate life-threatening syndrome. Death in this syndrome is brought about by destruction of blood vessels in the brain, fluid buildup, and neuronal damage. Death may occur in a few days or, at higher doses (greater than 100 Gy), within hours [32]. Because of the involvement of brain and nervous system tissues, the cerebrovascular syndrome is sometimes referred to as central nervous system syndrome. The hematopoietic and GI systems are also severely damaged at this dose level but would not contribute to the cause of death in such a short time. After whole body exposure to a high dose of radiation, the body will experience a combination of all three syndromes. The International Atomic Energy Association (IAEA) has developed tables of symptoms that can be used to help determine how critical the exposure is and potential medical responses [32]. These tables divide the symptoms seen into early, i.e. prodromal, and critical or late phases. The prodromal phase is defined as “soon after” exposure. The effects that occur are classified from mild to severe to lethal, based on the total body dose. Whole body doses below a few gray are considered mild to moderate, and survival can be considered good; above 8 Gy, the dose is assumed to be lethal. These analyses should be used as guides only because accurate dosimetry and distribution of radiation dose to the whole body is highly variable. In addition, individual response to radiation is also highly variable. Stochastic effects are random or probabilistic in nature. By being random, the occurrence of individual events cannot be predicted. Yet, by measuring the distribution of all observations, a predictable pattern can be derived using statistical methods. Stochastic effects can be divided into two groups, genetic and carcinogenic effects. Based on the random nature of these effects, the production of genetic changes or the induction of cancer in an individual cannot be determined regardless of the amount of energy absorbed, i.e. there is not a threshold dose where these effects will always occur. For stochastic effects, as energy absorption increases, the probability that these effects may occur also increases, yet the severity of the effect does not increase with dose. This means that the severity of the genetic change or the severity of the cancer produced does not increase with increasing dose, just the probability of their occurrence increases. The exposure of a population to radiation can cause damage in germ cells that ultimately result in mutations in the population’s decedents. However, these mutations are characteristic to the cell line exposed so that the radiation damage only produces DNA sequencing errors that might have occurred naturally. Therefore, instead of producing unique mutations, damage from radiation exposure only results in a higher frequency of spontaneous mutations. Consequently, radiation does not cause the production of monsters as seen in the movies. In addition, a large number of animal studies and the Life Span Study in humans have shown that the adverse effects from radiation exposure in subsequent generations are negligible, i.e. there is no direct evidence at any dose level that exposure of parents to radiation leads to excess genetic disease in offspring. Cancer induction is arguably the most important and the most feared radiation effect. From the discovery of ionizing radiation, there has been documented evidence of radiation-induced cancer in both animal and human studies. The early human experiences were all at high absorbed dose levels from people working in radiation areas or using radiation without the knowledge of its potential harm. More recent analysis has shown increased cancer incidence from the Life Span Study and the early medical use of radiation in treatment and diagnostic studies at high exposure rates. At lower radiation doses and doses received over longer periods of time, the risk of carcinogenesis has not been conclusive. However, there are data that suggest that for low LET radiation and at low dose rates, radiation carcinogenesis is lower than what is predicted at higher doses. Because of this, the concept of a dose and dose rate effectiveness factor (DDREF) has been introduced. The DDREF is used to “correct” the predictions of risk determined at acute, high dose rates to speculated risk at low fractionated doses. DDREF values are usually limited to use in defining radiation protection practices, and there is controversy in the most appropriate or even the use of DDREF values for other than general radiation safe practice guidance, e.g. the ICRP recommends a DDREF of approximately two for fractionated exposures and for acute doses of less than ∼0.1 Gy [5]. As with deterministic effects, stochastic effects also have a latency period between the time of exposure and the onset of the effect, i.e. cancer. The latency period is on the order of years for all cancers with leukemia having the shortest latency period, e.g. on the order of 5 or more years, and most solid tumors having latency periods in excess of 10 years. Therefore, it is very difficult to prove that the incidence of cancer is directly related to the radiation exposure alone or that other contributing factors during the latency period are not the actual cause of the cancer. Therefore, the very large statistical variation associated with all radiation-induced cancer estimations needs to be considered whenever a connection between radiation and cancer is suggested (see Section 4.4.8). If the deposition of energy in tissue is large enough, cellular changes or death will occur. As seen in deterministic effects, there is a threshold dose in certain tissues where below this level, the radiation effects are not seen. Yet, there is a small probability that damage to DNA even in a single cell may result in a change that causes the cell to become malignant. Therefore, the probability that stochastic effects will occur cannot be ruled out, even at low radiation doses. The National Academy of Sciences (NAS) in their Biological Effects of Ionizing Radiation (BEIR) reports, as well as other scientific organizations that study the effects of radiation, use a definition of “low dose” to be between 0.1 and 0.15 Sv [4]. Cell culture and animal studies have provided information demonstrating tumorigenesis from high levels of radiation exposure. Yet, at lower dose levels, both deterministic and stochastic effects are not observed, or the studies have not been comprehensive enough to demonstrate these changes conclusively. For example, there are a number of sites of cancer (e.g. small intestine, rectum, and soft tissue sarcoma) where there is clear evidence of risk at high doses, but little or none at low doses. As carcinogenesis has only been confirmed at high-radiation dose levels, the determination of risk for cancer induction at low dose must be extrapolated from the high dose data (see Figure 4.12). Figure 4.12 Determination of risk for cancer induction at low dose must be extrapolated from the high-dose data. Using the high dose data, three extrapolation models for low-dose effects have been proposed, these are termed: In this model, it is assumed that the incidence of induced cancer at low dose levels increases linearly with radiation dose up to a certain dose level. Then, at high dose levels, the incidence increases much more rapidly, i.e. changes from a linear relationship at low dose levels to a quadratic relationship at high dose levels. The linear-quadratic model is derived from a large number of animal studies that demonstrate this fit in specific cancers, e.g. leukemia and nonmelanoma skin cancer. However, the shape of the linear-quadratic fit has large variation in the curve fitting parameters for different cancers/cell types, making the extrapolation to low dose levels variable. Therefore, utilizing these fits to predict cancer requires different models for each specific cancer type. In these models, the incidence of induced cancer is linearly proportional to the dose at all dose levels. The difference between the two linear models is whether there is a threshold below which too few cells are affected or cellular repair mechanisms compensate for any damage that occurs, i.e. is there a threshold dose for stochastic effects similar to deterministic effects. If a threshold level for stochastic effects exists, it has been proposed that this would be near 0.01–0.5 Sv. This value is based on studies that suggest stochastic effects have not been demonstrated at or below this dose range [33–36]. There are also studies that have investigated the application of a linear-quadratic “threshold” model to low-dose situations. These studies suggest that if there is a threshold, it is also at a very low value, e.g. 0.07–0.11 Sv. It needs to be pointed out here that these “very low dose” thresholds are at the level where exposures from diagnostic radiology studies occur and at doses that are encountered by workers in radiation occupations. The issues with low-dose extrapolation models are the main reason the DDREF concept was developed. Low-LET radiation at low doses and low dose rate studies in animals have shown a lesser carcinogenic effect than the same doses delivered acutely [5]. In addition, the analyses of the dose response for leukemia in the Life Span Study, which could be represented by a linear-quadratic model, support the use of DDREF at low dose rates. Therefore, when discussing cancer risks from exposure to low-LET radiation and at low doses/low dose rates, DDREF is often used. Correct modeling of radiation effects at low doses is both complex and a controversial topic. The decisions on which model to use, if DDREF are used, as well as many other factors need to be considered, as well as the known biases and uncertainties in the data (see Section 4.4.8). In many situations, the linear no-threshold model is the most conservative model, and therefore, this model is used by all advisory and regulatory agencies when setting limits for radiation exposure to the public and radiation workers (see Section 4.6.3). However, in epidemiology studies when comparing risk to low-dose exposures to individuals, the use of the linear no-threshold model may not be appropriate. Hormesis is the concept that suggests that low levels of a potentially damaging substance, e.g. ionizing radiation, can stimulate an organism to produce protective biological processes in its cells, molecules, or organ systems [37–43]. It is known that the body will initiate repair mechanisms whenever damage occurs. However, it is unknown if at low radiation exposure, there is sufficient damage to stimulate this repair process. Hormesis proposes that if an organism is in an environment where it is continuously exposed to low levels of radiation, it will develop an inherent repair process such that the organism can respond to minor insults of low levels of radiation to reduce any damage. There are a few studies that suggest a reduction in the effect of radiation or repair of DNA in cellular cultures and animal models [44–48]. Yet, similar to verifying a link between a substance and the induction of cancer, the ability to measure hormesis is extremely difficult, and the uncertainty in these studies is very large. However, if hormesis does occur, it would not eliminate the potential of cancer induction at low dose levels, whereas it may modify which low dose extrapolation model is appropriate and the parameters used in the extrapolation. Radiation-induced cancer is assumed to be primarily by the radiation-ionizing molecules that alter their structure (e.g. creation of free radicals), and it is these “altered” molecules that cause DNA damage (see Section 4.3). This damage is assumed to be occurring over small distances, i.e. within cells, because of the highly reactive nature of free radicals. Because of this, it is assumed only cells that have been irradiated would receive damage. Based on this assumption, there should be no effect seen in cells that have not been irradiated. Yet, there have been several studies that have shown that radiation effects can be seen in cells that have not been irradiated [13,49]. This damage to nonirradiated cells is termed the “bystander effect.” The bystander effect has been shown in single-particle microbeam experiments with both high- and low-LET radiations, but it is more apparent with high LET participles, e.g. alpha particles. If the bystander effect is validated, it would imply that radiation-induced changes will occur beyond the irradiated cells, and again, it would change which low-dose extrapolation model and the parameters within the model that may be appropriate to use. There are two models used to assess the risk of stochastic effects from radiation exposure; these are the absolute and relative risk models. To understand these models, we must first differentiate the incidence and mortality of cancer in a population. When defining the rate of cancer, it can be given as the number of new cancer cases (i.e. incidence rate) or it can be given as the number of deaths that are attributed to cancer (i.e. mortality rate). The Surveillance Epidemiology and End Results (SEER) program of the National Cancer Institute (NCI) maintains cancer-reporting information in the United States (see seer.cancer.gov). This program registers all newly diagnosed cases of cancer and utilizes the National Center for Health Statistics of the Centers for Disease Control to determine if cancer was the cause of death. These values are determined for specific cancer types and for variations based on race, sex, age at diagnosis vs. age at death, etc. The incidence and mortality from the combination of all cancer types in the United States from 1975 to 2014 are given below: When reporting the risk of cancer resulting from the exposure to radiation, we can use either the incidence or mortality rate. In the past, mortality rate was often used because incidence data were not available. Yet, incidence data provides a more complete description of the cancer burden, especially for cancers that have a high survival rate. Also, cancer registries can now provide more accurate information regarding the diagnosis of the cancer type. Without the diagnosis information, the determination if cancer was the actual cause of death, usually done through the analysis of death certificates, can be highly inaccurate. Absolute risk is defined as the probability that a person who is disease free at a specific age will develop the disease at a later time following exposure to a risk factor, e.g. the probability of cancer induction 10 years following exposure to radiation. The absolute risk model assumes that the risk factor produces the disease in addition to the natural incidence of the disease. In this model, the absolute risk for radiation-induced carcinogenesis is defined as the number of cancers in a population exposed to radiation, divided by the number of people exposed. This is defined for a specific time frame of interest and the average dose the population received. In an equation form, this would be
Radiobiology, Dosimetry, and Protection
4.1 Introduction
4.2 Radiation Quantity and Quality
4.2.1 Intensity


 indicates that the intensity is determined by adding the components of the beam at each of “m” energies. The concepts of radiation fluence and flux are summarized in Table 4.1.
Quantity
Symbol
Definitionb
Units
Particle (photon) fluence
Φ


Particle (photon) flux
φ


Energy fluence
Ψ


Energy flux (intensity)
ψ


4.2.2 Traditional and Système International Units
Quantity
Traditional
SI
Conversion from traditional to SI
Exposure
roentgen (R)
coulomb/kilogram (C/kg)
1 R = 2.58 × 10⁻⁴ C/kg
Absorbed dose
rad
gray (Gy)
1 rad = 0.01 Gy
Equivalent dose
rem
sievert (Sv)
1 rem = 0.01 Sv
4.2.3 Radiation Exposure

4.2.3.1 Energy and Photon Fluence per Unit Exposure


4.2.4 Units of Radiation Dose


4.2.4.1 Relative Biological Effectiveness Dose

Effect
RBE of 60Co gammas
Thirty-day lethality and testicular atrophy in mice
0.77
Splenic and thymic atrophy in mice
1
Inhibition of growth in Vicia faba
0.84
LD50b in mice, rat, chick embryo, and yeast
0.82–093
Hatchability of chicken eggs
0.81
HeLa cell survival
0.90
Lens opacity in mice
0.8
Cataract induction in rats
1
L-cell survival
0.76

4.2.4.2 Equivalent Dose
Radiation type
Weighting factor (WR)
Photons
1
Electrons
1
Neutrons
5–20
Protons
2
Alpha particles
20
Heavy nuclei
4.2.4.3 Effective Dose
Tissue
Weighting factor (WT)
Breast
0.12
Red bone marrow
0.12
Lung
0.12
Colon
0.12
Stomach
0.12
Gonads
0.08
Thyroid
0.04
Bladder
0.04
Liver
0.04
Esophagus
0.04
Skin
0.01
Bone surface
0.01
Brain
0.01
Salivary gland
0.01
All other organs
0.12
4.3 Radiation Effects in Cells

4.3.1 Free Radical Formation

4.3.2 Cell Survival Studies


4.3.3 Modification of Cellular Responses
4.3.3.1 Oxygen

4.3.3.2 Linear Energy Transfer

4.3.3.3 Dose Rate and Fractionation


4.3.3.4 Cell Cycle

4.3.3.5 Radioprotectors and Radiosensitizers
4.4 Radiation Effects in Animal Systems
4.4.1 Background Radiation

4.4.1.1 Natural Background
4.4.1.2 Man-made Background
4.4.2 Deterministic Effects
Tissue
Total acute dose threshold (Gy)
Fractioned total dose threshold (Gy)
Annual dose rate (Gy/yr)
Time to develop effect
Lens of eye
Detectable opacities
0.5–2
5
>0.1
>1 yr
Cataract formation
5.0
>8
>0.15
>1 yr
Skin
Erythema (necrosis)
3–6 (5–10)
NA
NA
1–4 wk
Temporary hair loss
4
NA
NA
2–3 wk
Testes
Temporary sterility
0.15
NA
0.4
3–9 wk
Permanent sterility
3.5–6
NA
2
3 wk
Ovaries
Permanent sterility
2.5–6
6
>0.2
<1 wk
Gastrointestinal
Mucosa lining loss
6
NA
NA
6–9 d
Bone marrow
Reduction of hematopoiesis
0.5
NA
>0.4
1–2 mo
Menstrual or gestational age (wk)
Conception age (wk)
<0.05 Gy
0.05–0.1 Gy
>0.1 Gy
0–2
Before conception
None
None
None
3–4
1–2
None
Probably none
Possible spontaneous abortion
5–10
3–8
None
Potential effects are scientifically uncertain and probably too subtle to be clinically detectable
Possible malformations increasing in likelihood as dose increases
11–17
9–15
None
Potential effects are scientifically uncertain and probably too subtle to be clinically detectable
Increased risk of deficits in IQ or mental retardation that increase in frequency and severity with increasing dose
18–27
16–25
None
None
IQ deficits not detectable at diagnostic doses
>27
>25
None
None
None applicable to diagnostic medicine
4.4.2.1 Dose Rate and Latency Period
4.4.2.2 Tissue Functional Subunits
4.4.3 Acute Radiation Syndrome
4.4.3.1 Hematopoietic Syndrome
4.4.3.2 Gastrointestinal Syndrome
4.4.3.3 Cerebrovascular Syndrome
4.4.3.4 Prodromal and Critical Phase of Acute Radiation Syndrome
4.4.4 Stochastic Effects
4.4.4.1 Genetic Effects
4.4.4.2 Carcinogenesis
4.4.4.2.1 Dose Rate and Latency Period
4.4.5 Radiation Risk Estimation
4.4.5.1 Low-Dose Extrapolation

4.4.5.2 Linear-Quadratic Model
4.4.5.3 Linear Threshold and No-threshold Models
4.4.5.4 Hormesis
4.4.5.5 Bystander Effect
4.4.6 Radiation Risk Models
4.4.6.1 Incidence and Mortality
4.4.6.2 Absolute or Additive Model

Related posts:
![]()
Stay updated, free articles. Join our Telegram channel


Full access? Get Clinical Tree


