Normal bone growth of the pediatric knee as well as normal variants of ossification result in different appearances that can be identified on imaging (radiography/MR imaging). Familiarity with these changes is important to avoid confusing normal growth with pathology. This article illustrates the main features related to normal bone growth (growth arrest lines, physeal changes, ossification centers within the epiphysis, hematopoietic marrow within the metaphysis) and physis disappearance (« FOPE »). Variants in femur (epiphyseal irregularities, subchondral anomalies of posterior condyles, periosteal desmoid), tibia (tibial tuberosity ossification), and patella (dorsal defect, bipartite patella, lower pole fragmentation) are also described.
Key points
- •
This article reviews normal developmental changes in the pediatric knee on imaging (radiography/MR imaging.
- •
Knowledge of these changes is important to avoid confusing normal growth with disease.
- •
In distal femur, normal variants are spiculation of epiphyseal ossification centers, subchondral anomalies in posterior femoral condyles, and periosteal desmoid.
- •
In proximal tibial, fragmentation of the tibial tuberosity during ongoing ossification may be misleading on imaging.
- •
Dorsal defect, bipartite patella, and lower pole fragmentation are the most common variations in patellar ossification.
With the increasing development of sports activities in children, imaging is more and more often performed in the presence of clinical symptoms and can lead to diagnostic errors. Indeed, some variants of endochondral ossification may mimic pathologic entities, whereas others may be symptomatic. This article discusses the normal aspects and main variants of endochondral knee ossification in children at radiography and MR imaging.
Normal bone growth of the knee
It mainly involves endochondral ossification and to a lesser degree, membranous ossification. In the process of endochondral ossification, mesenchymal cells condense and differentiate into chondrocytes to form a cartilage model before bone tissue formation, whereas in the process of membranous ossification, mesenchymal cells condense and differentiate directly into osteoforming cells. A long bone such as the femur or tibia has an epiphysis, metaphysis, and diaphysis. In children and adolescents, the physeal cartilage (or growth plate) separates the epiphysis from the metaphysis. Patella is an epiphyseal equivalent.
Epiphysis
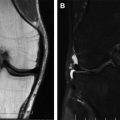
Its surface is covered with a layer of articular cartilage. The epiphysis is initially entirely cartilaginous. Epiphyseal cartilage and articular cartilage consist of hyaline cartilage with a different composition: epiphyseal cartilage is rich in chondrocytes and water, with vascular channels, whereas articular cartilage is poor in chondrocytes and water, without vessels. On radiographs, the unossified epiphysis is invisible ( Fig. 1 ). On MR imaging, it is hypointense to muscle on T1-weighted (T1-W) imaging and mildly hyperintense on T2-W imaging (see Fig. 1 ). As a result of various mechanisms specific to endochondral ossification (chondrocyte hypertrophy, apoptosis, angiogenesis, osteoblast inflow), a secondary ossification center appears within the cartilaginous epiphysis. It is visible on radiographs around 36 weeks’ gestation at the distal end of the femur (Beclard’s point) and 38 weeks’ gestation at the proximal end of the tibia (Todd’s point). First spherical in shape, this ossification center becomes hemispherical to adapt to the metaphysis. On MR imaging, the secondary ossification center is visible on T1-W imaging (see Fig. 1 ). At birth and during the first year of life, epiphyseal cartilage is traversed by vascular channels. Initially parallel to each other, these channels then affect a radial arrangement from the secondary ossification center. In toddlers or young children with local hyperemia, these channels can be visualized with MR imaging after administration of gadolinium ( Fig. 2 ). Vascular channels tend to disappear over time.


The secondary ossification center is surrounded at its periphery by a secondary physis, also called acrophysis. The part of the ossification center in immediate contact with the acrophysis is equivalent to the metaphyseal primary spongiosa: it is visible on MR imaging in the form of a linear hyperintensity on T2-W and postcontrast T1-W imaging (see Fig. 2 ). Acrophysis (or secondary physis) has the same histologic nature as physeal cartilage (or primary physis) but is thinner. Through acrophysis, endochondral ossification is involved in the hemispheric bone growth of the epiphysis.
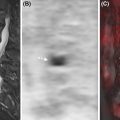
The appearance of the secondary ossification center is preceded by the development of preossification centers. The latter are sometimes visible on MR imaging in the form of well-limited, lobulated structures of high signal intensity, within the epiphyseal cartilage ( Fig. 3 ). Articular cartilage is also visible on MR imaging: on T1-W images, its signal merges with that of the cartilaginous epiphysis but it becomes visible on T2-W images, in the form of a hypersignal rim around the epiphysis. Homogeneous in young children, the articular cartilage signal becomes more heterogeneous with age and gait acquisition. Along the weight-bearing joint surface, a decrease in T2 signal intensity appears, clearly visible at the middle portion of the femoral condyles ( Fig. 4 ).


Physeal Cartilage
Also called growth plate or primary physis, the physeal cartilage is roughly disc-shaped, thick and smooth in young children, whereas thin and wavy in older children. Histologically, the physeal cartilage is formed of 3 successive cellular layers, from the epiphysis to the metaphysis ( Fig. 5 ):
- •
A thin germinal layer (or reserve zone) composed of spherical chondrocytes separated by an abundant extracellular matrix, rich in proteoglycans;
- •
A thick proliferative layer (or serial zone), where the chondrocytes flatten and arrange themselves in longitudinal columns, parallel to the major axis of the bone, within an extracellular matrix rich in type II collagen;
- •
A hypertrophic layer (or hypertrophic zone) composed of chondrocytes organized in 3 zones: chondrocytic maturation, chondrocytic degeneration, and provisional calcification. The provisional calcification zone, also known as the epiphyseal ossification front, faces the primary metaphyseal spongiosa.

At MR imaging, T2-W gradient-recalled-echo sequences are used to differentiate the hyperintense physeal cartilage from the adjacent hypointense cancellous bone but not to individualize the different cartilage layers of the physis ( Fig. 6 ). Conversely, T2-W sequences with fat signal suppression (short T1 inversion-recovery, proton density) distinguish the provisional calcification zone (linear hyposignal) from other cartilage layers (linear hypersignal). Because the primary metaphyseal spongiosa already appears as a linear hypersignal on T2-W sequences, MR imaging shows on T2-W imaging a trilamellar aspect, characteristic of the junction between the epiphysis and the metaphysis (see Fig. 6 ).

Physeal cartilage vascularization involves an epiphyseal arterial network and a metaphyseal arterial network. During the first 18 months of life, transphyseal vessels provide anastomoses between these 2 networks but they eventually disappear. Epiphyseal arteries are distributed to the secondary ossification center from which they pass through the epiphyseal cartilage, within the vascular channels and to the epiphyseal side of the physis (germinal layer). Metaphyseal arteries supply the area of provisional calcification (or epiphyseal ossification front). In total, the central part of the physeal cartilage (hypertrophic zone) is not vascularized. Dynamic MR imaging may show the early enhancement of physis and acrophysis and if the spatial resolution is sufficient enough, distinguish between the intense enhancement of the provisional calcification zone (metaphyseal network), the absence of enhancement of the hypertrophic zone, and the moderate enhancement of the germinal zone (epiphyseal network).
Metaphysis and Diaphysis
The metaphysis is richer than the diaphysis in red, hematopoietic bone. At MR imaging, this is reflected by the presence within trabecular bone of poorly limited areas of low signal intensity relative to muscle on T1-W imaging ( Fig. 7 ). MR imaging findings are generally symmetric between right and left sides. A similar appearance may be seen at the periphery of the epiphysis, in the form of a linear, subchondral hyposignal intensity. Bone growth in length and width for the metaphysis and diaphysis involves endochondral ossification (via the physeal cartilage) and membranous ossification, respectively. Unlike the epiphysis, the diaphysis and metaphysis are covered by the periosteum formed by a deep cellular layer and a fibrous superficial layer. Periosteum is thicker in children than in adults. It is also less adherent to the bone cortex from which it is separated by fibrovascular tissue that enhances after administration of gadolinium. This aspect is clearly visible on MR imaging at the posterior part of the distal femoral metaphysis ( Fig. 8 ). With respect to the physeal cartilage, the fibrous layer of the periosteum is in continuity with a fibro-chondro-osseous sleeve encircling the growth plate, consisting of the groove of Ranvier and the perichondrial ring of LaCroix. This peripheral sleeve contributes to the growth and mechanical strength of the growth plate. It appears on MR imaging as a short hypointense band, extending from metaphysis to epiphysis (see Fig. 4 ). The periosteum is essential for circumferential bone growth.


Normal Bone Growth
This is not a continuous but a cyclical phenomenon. In long bones, a physiologic arrest of bone growth results on radiographs in transverse lines of sclerosis, parallel to the growth plate, within the metaphysis ( Fig. 9 ). Also called “growth arrest lines,” “Harris-Park’s lines,” or “growth recovery lines,” these lines then move toward the diaphysis as bone growth progresses. When numerous, growth arrest lines indicate an intercurrent condition or prior administration of biphosphonates (see Fig. 9 ). When they adopt an oblique path with respect to the growth plate, premature epiphysiodesis should be considered, especially after trauma. In flat bones such as the patella, growth arrest lines produce a “bone within bone” appearance ( Fig. 10 ). On MR imaging, these lines appear hypointense on all sequences (see Figs. 9 and 10 ).


