Fig. 2.1
Myxofibrosarcoma arising in the adductors of the upper thigh in a 75-year-old man. Plain radiograph. The tumor is only visible by virtue of its mass effect on tissue planes
In a minority of cases, part or all of the tumor may exhibit a radiodensity sufficiently different to that of water for the tumor to be visualized directly. Only fat and gas will give a radiodensity less than that of muscle. Lipomas, the commonest of all the soft tissue tumors, produce a low radiodensity between that of muscle and air. For this reason lipomas are well demarcated from the surrounding soft tissues and can be diagnosed with moderate confidence [21] (Fig. 2.2). It should be noted that low-grade liposarcomas may contain variable amounts of lipomatous tissue, which also appears relatively radiolucent on radiography (Fig. 2.3). Air in the soft tissues is said to be specific to infection [30]. While infection is certainly the commonest cause, it may also be seen in necrotic fungating tumors, albeit with secondary infection (Fig. 2.4), as well as being a normal feature following open biopsy or other surgical procedures. Air in the soft tissues of the thoracic wall and neck always suggests the possibility of surgical emphysema.
Fig. 2.2
Lipoma arising on the radial aspect of the elbow. Plain radiograph. The tumor is sharply marginated with the uniform low density of fat
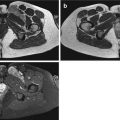
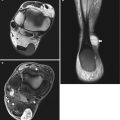
Fig. 2.3
Low-grade liposarcoma arising behind the knee joint in a 55-year-old woman. (a) Plain radiograph. (b) Computed tomography (CT). Fat density areas are visible on the radiograph (a) with mixed fat and soft tissue attenuation on CT (b)
Fig. 2.4
Necrotic, fungating clear cell sarcoma in a 62-year-old woman. Plain radiograph. The loculi of gas within the tumor indicate secondary infection
Increased radiodensity may be seen in the tissues due to hemosiderin, calcification, or ossification. Hemosiderin deposition typically occurs in synovial tissues exposed to repeated hemorrhage, such as (tenosynovial) giant cell tumor, pigmented villonodular synovitis (see Chap. 15), and hemophilic arthropathy. Radiographs can distinguish between calcification and ossification and the differing patterns [54]. Mineralization in the soft tissues is a feature of a large spectrum of disorders including congenital, metabolic, endocrine, traumatic, and parasitic infections [38]. Primary soft tissue tumors are one of the less common causes of calcification that the general radiologist can expect to see in his or her routine practice. Close attention to the clinical details and location will exclude many of the nonneoplastic causes. For example, soft tissue calcifications in the hands and feet are rarely associated with neoplasia, and many of the multifocal lesions will be either due to a collagen vascular disorder or the residuum of a parasitic infection. Again, the clinical details and country of origin of the patient should be pointers to the correct diagnosis. Occasionally certain normal variants, including companion shadows and the fascia lata, may simulate soft tissue calcification or periosteal new bone formation and should not be mistaken for a neoplastic process [23].
Analysis of the pattern of calcification within a soft tissue tumor can indicate the tissue type. Circular foci with a lucent center representing a phlebolith, when identified outside the pelvis, is diagnostic of a hemangioma (Fig. 2.5). Phleboliths are not usually apparent until adolescence, so that conditions such as Maffucci syndrome (Fig. 2.6) in the child may not be radiographically distinguishable from multiple enchondromatosis (Ollier disease).
Fig. 2.5
Extensive hemangioma of the forearm in an adolescent male. Plain radiograph. Note the presence of multiple phleboliths
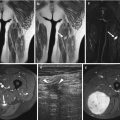
Fig. 2.6
Maffucci syndrome in a 32-year-old man. Plain radiograph. Multiple enchondromas and soft tissue hemangiomas indicated by the phleboliths
Chondroid tissue reveals ring-and-arc calcification. While this does not distinguish between benign or malignant cartilage formation, the majority of soft tissue masses with this feature, in the vicinity of a joint, will arise from synovial chondromatosis (Fig. 2.7) [37] and in the hands and feet will be soft tissue chondromas. Calcification or ossification in the infrapatellar (Hoffa) fat pad is typical of a para-articular chondroma (Fig. 2.8) [17].
Fig. 2.7
Soft tissue mass in a 62-year-old man. Plain radiograph. Characteristic chondroid calcifications arising from the posterior aspect of the knee joint due to synovial chondromatosis
Fig. 2.8
Para-articular chondroma in a 44-year-old man. Plain radiograph. Minor ossification arising in the Hoffa fat pad
Osteoid mineralization may occur as “cloud-like” densities or mature trabecular bone. The latter suggests a slow-growing lesion such as a lipoma, low-grade liposarcoma, or hemangioma [30]. Poorly defined, amorphous calcification is found in up to 30 % of synovial sarcomas (Fig. 2.9) [6, 18, 31] and approximately 50 % of extraskeletal osteosarcomas (Fig. 2.10). This is an extremely useful distinguishing feature from the tumor-mimicking myositis ossificans, which exhibits marginal calcification (Fig. 2.11) [13, 34]. Another traumatic condition that presents with a peripherally mineralized mass and platelike configuration of calcification along the course of muscle, almost exclusively in the calf, many years after a major injury, is calcific myonecrosis (Fig. 2.12) [9, 22].
Fig. 2.9
Synovial sarcoma arising in the vastus lateralis in a 66-year-old man. (a) Plain radiograph. (b) CT. Both imaging techniques demonstrate amorphous calcification
Fig. 2.10
Extraskeletal osteosarcoma in a 50-year-old man. Plain radiograph. Densely mineralized lesion arising in the adductors
Fig. 2.11
Myositis ossificans of the forearm in a 38-year-old woman. Plain radiograph. Soft tissue mass lying on the surface of the proximal radius showing typical peripheral mineralization
Fig. 2.12
Calcific myonecrosis in an 87-year-old woman. Plain radiograph. Soft tissue mass with peripheral mineralization causing pressure erosion on the adjacent tibia
2.2.6 Bone Involvement
It may be difficult to differentiate a primary soft tissue tumor with osseous involvement from a bone tumor with soft tissue extension [29]. As a rule, the site of the more extensive abnormality, be it bone or soft tissue, represents the primary focus [39]. Only a minority of soft tissue tumors involve bone. The degree of bone involvement may vary from cortical hyperostosis, as seen in a parosteal lipoma (Fig. 2.13), through the pressure erosion seen in slow-growing masses (Fig. 2.14), to direct invasion, as seen in aggressive lesions (Fig. 2.15). The presence of ill-defined cortical destruction is strongly indicative of malignancy, although it may also occur with paraosseous infections. The converse does not apply in that well-defined pressure erosion may occur with both benign and malignant soft tissue tumors (Fig. 2.11). Aggressive fibromatosis (extra-abdominal desmoid tumor) is a benign, but locally invasive condition, which can cause irregular adjacent bone erosion in one-third of cases (Fig. 2.16).
Fig. 2.13
Parosteal lipoma arising on the surface of the tibia in a 67-year-old woman. Plain radiograph. Lobulated fat density mass with typical periosteal new bone formation
Fig. 2.14
Myxofibrosarcoma of the upper leg in a 65-year-old man. Plain radiograph. Soft tissue mass causing pressure erosion on the medial cortex of the femoral diaphysis
Fig. 2.15
Undifferentiated spindle cell sarcoma of the calf in a 78-year-old woman who refused medical treatment for 2 years. Plain radiograph. The tumor has destroyed the proximal fibula, with extensive invasion of the tibial metaphysis
Fig. 2.16
Aggressive fibromatosis in a 37-year-old woman. Plain radiograph. There is erosion of the proximal tibia
Cortical destruction with an outer, saucer-like configuration, “saucerization,” occurs in Ewing’s sarcoma and bony metastatic disease and should not be mistaken for secondary bone invasion from a large soft tissue sarcoma [26].
2.3 Angiography
Prior to the introduction of cross-sectional imaging, angiography was the most useful imaging technique for the demonstration of soft tissue sarcomas [49, 55, 56]. For many years it was considered an important adjunct to conventional radiography in patient management [19, 28].
Angiography can delineate the full extent of feeding and draining vessels of vascular malformations, but has been largely superseded by CT angiography or magnetic resonance (MR) angiography. Preoperative angiography may continue to be employed in planning surgery in difficult cases or as a prelude to embolotherapy [52, 57].
Angiography can differentiate between the two histological types of hemangioma, capillary and cavernous. MR angiography can be a useful adjunct to MRI in selected cases. This includes the differentiation of a soft tissue tumor from an aneurysm.
Isolated limb perfusion chemotherapy for melanoma has been shown to be effective in management of advanced melanoma of the extremity.
2.4 Computed Tomography
The introduction of CT proved a revolution in the detection and preoperative management of soft tissue tumors [16, 19, 28, 41, 43, 46].
Although there are some concerns regarding the potential for increasing the radiation dose, thin-section scanning allows for different types of postprocessing, such a multiplanar reconstructions, volume rendering, and surface-shaded display (Fig. 2.17). PET-CT (positron emission tomography-computed tomography) is one of the gold standards of metabolic imaging. This provides functional as well as anatomical information of the lesion, which can be useful in staging of sarcomas. This technique is a useful adjunct in planning biopsies from metabolically active component of the tumor and in monitoring of treatment of soft tissue sarcomas [2, 11]. This will be covered in Chap. 3.
Fig. 2.17
Tumoral calcinosis associated with chronic renal failure. (a) Computed tomography. (b) Surface-rendered 3D reconstruction. Soft tissue masses with amorphous calcification. The distribution is readily appreciated on the reconstruction (b)
2.4.1 CT Features
The CT features that should be assessed in each case are similar to those described above for evaluating the conventional radiograph. This reflects the fact that both are radiographic techniques relying on the attenuation of an X-ray source. The principal advantages of CT over the radiograph are the improved soft tissue resolution and the axial, in contrast to longitudinal, imaging plane. The first feature to assess is the attenuation value of the mass. Fat will show the lowest attenuation of any tissue, and a benign lipoma can be diagnosed on CT by the uniformly low attenuation (−70 to −130 HU; Fig. 2.18) [15, 21]. It is not possible to reliably differentiate on CT a simple lipoma from an atypical lipomatous tumor (well-differentiated liposarcoma). In the peripheries this is rarely a management problem, as the treatment of the two conditions is the same. A few fibromuscular septa of soft tissue density traversing the lipoma are acceptable (Fig. 2.19). A tumor comprising a combination of fat and solid component is suggestive of a low-grade liposarcoma (Fig. 2.3b) [8]. Only air will show an attenuation less than that of fat (Fig. 2.19).
Fig. 2.18
Benign lipoma in the left anterior thigh of a 26-year-old man. Using computed tomography, a few fibromuscular septa can be identified traversing the lipoma
Fig. 2.19
Gas-forming clostridial osteomyelitis of the femur in a 59-year-old man. Computed tomography. Loculi of gas are present within the bone and surrounding abscess
Fluid-filled structures, seromas, old hematomas, and synovial cysts have an attenuation value less than that of muscle and more than that of fat (Fig. 2.20) [42, 44, 48]. Such fluid collections are usually homogeneous and well-defined. Abscesses typically have an attenuation value slightly higher than that of simple fluid (Fig. 2.19) [36, 53].
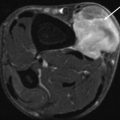
Fig. 2.20
Chronic hematoma in the thigh of a 28-year-old man at the site of nonunion of an old femoral fracture. Computed tomography. The overlapping fracture ends are seen as two separate bony structures. The attenuation of the hematoma measures 20 HU surrounded by a higher attenuation pseudocapsule
The majority of soft tissue sarcomas have an attenuation value slightly less than that of normal muscle (Fig. 2.21). The highest attenuation found in the soft tissues on CT is that of calcification and ossification, approximating to that of cortical bone. CT exquisitely demonstrates calcification more clearly than conventional radiography (Figs. 2.9) and can easily distinguish between calcification and ossification (Figs. 2.9) [54]. A peripheral ring of calcification is a characteristic CT feature of myositis ossificans (Fig. 2.22) [3, 23]. The differential diagnosis should include the rare soft tissue aneurysmal bone cyst, which also shows peripheral calcification [50].