Radiologic Evaluation of the Arthritides
In its general meaning, the term arthritis indicates an abnormality of the joint as the result of a degenerative, inflammatory, infectious, or metabolic process (Fig. 12.1). Also included among the arthritides are connective tissue arthropathies, such as those associated with systemic lupus erythematosus (SLE) and scleroderma.
Radiologic Imaging Modalities
Conventional Radiography
The radiologic modalities used to evaluate arthritis are very similar to those used in traumatic conditions involving the bones and joints (see Chapter 4), although there are some modifications. The most important modality for the evaluation of arthritis is conventional radiography. As in the radiographic examination of traumatic conditions, standard radiographs of the involved joint should be obtained in at least two projections at 90 degrees to each other (Fig. 12.2; see also Fig. 4.1). A weight-bearing view may be of value, particularly for a dynamic evaluation of any decrement in the joint space under the weight of the body (Fig. 12.3). Special projections may at times be required to demonstrate destructive changes in the joint to better advantages. The radial head-capitellum view (see Chapter 6), by eliminating overlap of the radial head and coronoid process and by more clearly demonstrating the humeroradial and humeroulnar joints, shows the inflammatory changes in the elbow joint to better advantage (Fig. 12.4). The semisupinated oblique view of the hand and wrist (the so-called Allstate or ball-catcher’s view), introduced by Norgaard in 1965, effectively demonstrates the radial aspects of the metacarpal heads and of the base of the proximal phalanges in the hand and the triquetrum and pisiform in the wrist (Fig. 12.5). Because the earliest erosive changes of some inflammatory arthritides begin in these areas, the Norgaard view may provide important information at the early stages of arthritides (Fig. 12.6). It may also demonstrate subtle subluxations in metacarpophalangeal joints frequently seen in SLE.
Magnification Radiography
This technique was used in the past to diagnose the very early articular changes of arthritis, which were not well appreciated on standard projections. The method involved a special screen-film system and geometric enlargement that yielded magnified images of the bones and joints with greater sharpness and bony detail. Magnification radiography is now completely replaced by digital radiography and cutting-edge technology of picture archive and communication system (PACS) for radiology images, allowing filmless high-resolution image display format with advanced radiology reading workstations.
Tomography, Computed Tomography, and Arthrography
Among the ancillary imaging techniques, conventional tomography was used in the past—its major purpose being demonstration to better advantage the degree of joint destruction. Currently, it has been replaced by computed tomography (CT), which is effective in evaluating degenerative and inflammatory changes of various joints (Fig. 12.7A to C) and in the spine to document spinal stenosis (Fig. 12.7D). In the assessment of spinal stenosis secondary to degenerative changes, CT examination may also be performed after myelography (Fig. 12.8), although myelography alone is often sufficient (Fig. 12.9). Recently, dual-energy CT gained a wide acceptance as a modality used for detection or exclusion of tophaceous gout (Figs. 12.10 and 12.11; see also Figs. 2.16 and 15.28). In addition, in patients with known tophaceous gout, this technique may be used for serial volumetric quantification of subclinical tophus to evaluate response to treatment. Arthrography has some limited application in the evaluation of degenerative (Fig. 12.12), inflammatory, and infectious conditions of the joint (see Fig. 25.22B).
Scintigraphy
Radionuclide bone scan is much more commonly used than those other techniques, mainly for evaluating the distribution of arthritis in different joints (see Chapter 2). The radiopharmaceuticals currently in use in bone scan include organic diphosphonates—ethylene diphosphonate (EHDP) and methylene diphosphonate (MDP)—labeled with 99mTc, a gamma emitter with a 6-hour half-life; MDP is more commonly used, typically in a dose that provides 15 mCi (555 MBq) of 99mTc. After intravenous injection of the radiopharmaceutical, approximately 50% of the dose localizes in bone, with the remainder circulating freely in the body and eventually excreted by the kidneys. A gamma camera can then be used in a procedure known as a three-phase radionuclide bone scan. Scintigraphy can determine the distribution of arthritic changes in large and small joints (Fig. 12.13). It can also distinguish an infected joint from infected periarticular soft tissues (see Fig. 24.9). To distinguish infectious arthritis from other forms of arthritides, 111In-labeled leukocytes and 57Ga scans are employed (see Chapter 2, section on “Scintigraphy”).
Serial examinations with bone scintigraphy, as Brower and Flemming have pointed out, have also been helpful in evaluating the activity of given arthritis at a particular point in time. Such examinations may differentiate active disease from arthritis in remission.
Recently, high-resolution single photon emission CT (SPECT) trials have been attempted to detect osseous alterations in early stages of rheumatoid arthritis and erosive osteoarthritis with promising results.
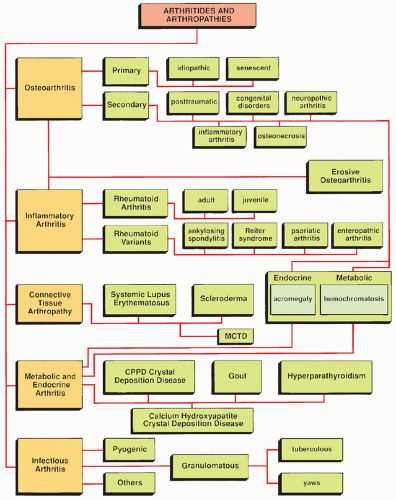 FIGURE 12.1 Classification of the arthritides. |
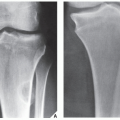
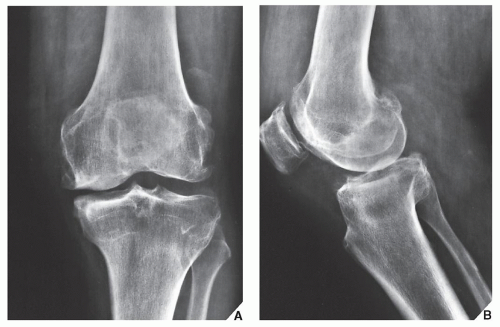 FIGURE 12.2 Osteoarthritis. A 58-year-old woman presented with a history of pain in the left knee. (A) Anteroposterior radiograph of the knee demonstrates narrowing of the medial femorotibial joint compartment and marginal osteophytes arising from both the medial and lateral femoral condyles—findings typical of osteoarthritis (degenerative joint disease). (B) Lateral radiograph demonstrates, in addition, osteophytes at the anterior and posterior aspects of the articular end of the tibia, which are not appreciated on the anteroposterior projection. Involvement of the femoropatellar joint compartment and the presence of synovitis, represented by suprapatellar joint effusion, are also well demonstrated. |
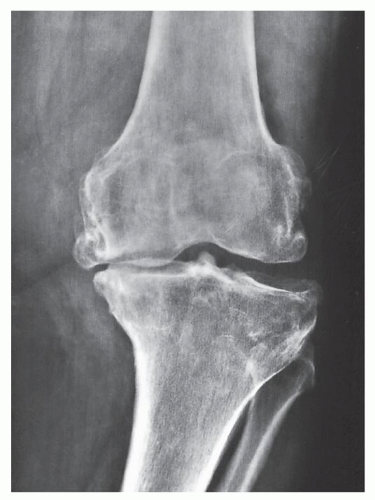 FIGURE 12.3 Osteoarthritis. Weight-bearing anteroposterior radiograph of the left knee of the same patient shown in Figure 12.2 demonstrates collapse of the medial femorotibial compartment under the weight of the body, with a resulting varus configuration of the knee. |
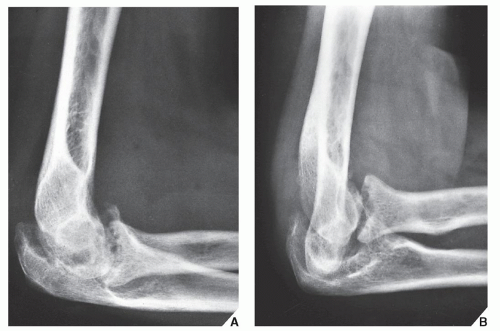 FIGURE 12.4 Rheumatoid arthritis. (A) Standard lateral radiograph of the elbow of a 48-year-old woman with known rheumatoid arthritis of several years’ duration shows destructive changes typical of inflammatory arthritis. (B) A special projection known as the radial head-capitellum view (see also Fig. 6.14) demonstrates to better advantage the details of the arthritic process involving the humeroradial and humeroulnar joints. (From Greenspan A, Norman A. Radial head-capitellum view in elbow trauma [Letter]. Am J Roentgenol. 1983; 140:1273-1275.) |
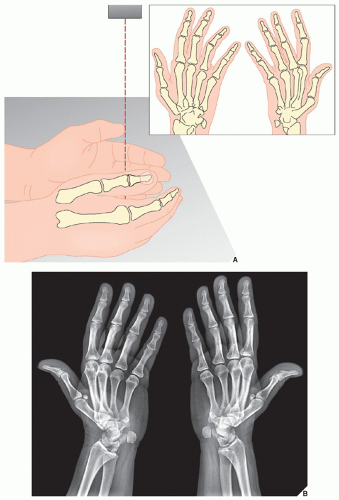 FIGURE 12.5 Ball-catcher’s view. (A) For the Norgaard view of the hands and wrists, the patient’s arm is fully extended and resting on its ulnar side. Fingers are extended. The hands are in slight pronation, as when catching a ball. The central beam is directed toward the metacarpal heads. (B) On the radiograph in this projection, the radial aspects of the base of the proximal phalanges, the triquetrum, and pisiform bones, as well as triquetropisiform joint are well demonstrated. |
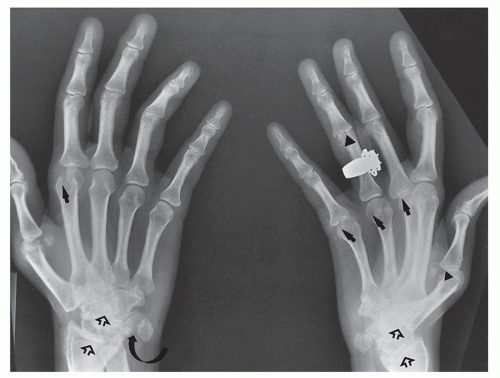 FIGURE 12.6 Rheumatoid arthritis. The Norgaard view of the hands and the wrists of this 62-year-old woman with rheumatoid arthritis demonstrates erosions in the radiocarpal and intercarpal articulations as well as the carpometacarpal joint, bilaterally (open arrows). Note, in addition, subtle erosions of the head of the first, third, fourth, and fifth metacarpals of the left hand and of the head of the second metacarpal of the right hand (arrows). A small erosion at the base of the middle phalanx of the ring finger of the left hand (arrowheads) and the erosion in the right triquetropisiform joint (curved arrow) are also well seen. |
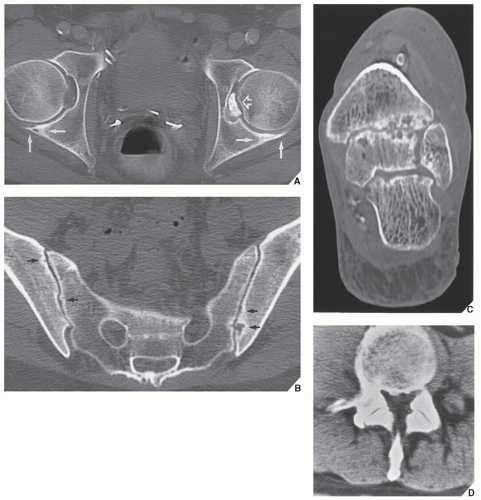 FIGURE 12.7 Evaluation of arthritides with CT. (A) Axial CT section through the hip joints of a 55-year-old man with hip osteoarthritis shows narrowing of the joint spaces, subchondral sclerosis, and osteophytes (arrows). The intraarticular osteochondral body (open arrow) was not clearly demonstrated on conventional radiographs. (B) Axial CT section through the sacroiliac joints of a 49-year-old man with psoriatic arthritis shows diffuse narrowing of the joints and articular erosions (arrows). (C) Coronal CT section through the ankle and foot of a 52-year-old woman with rheumatoid arthritis shows erosions of the tibiotalar and subtalar joints. (D) CT scan of the lumbar spine in a 66-year-old patient with advanced osteoarthritis of the facet joints shows marked narrowing of the spinal canal secondary to degenerative changes. At 8 mm, the transverse diameter is well below normal. |
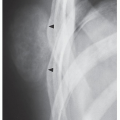
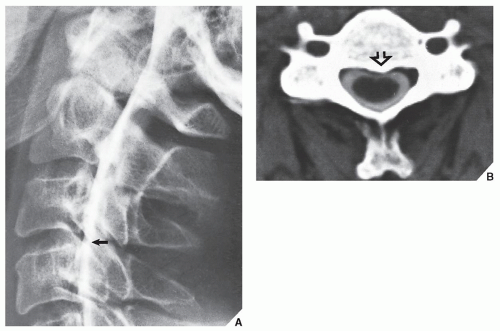 FIGURE 12.8 CT myelography of impingement of the thecal sac. A 56-year-old man reported constant pain in the neck radiating to the left arm; there was also associated weakness and numbness in the left hand. (A) Cervical myelogram in the lateral projection shows a small extradural defect on the ventral aspect of the thecal sac at C3-4 (arrow). (B) CT section obtained after myelography shows impingement of a posterior osteophyte on the thecal sac at the corresponding level (open arrow). |
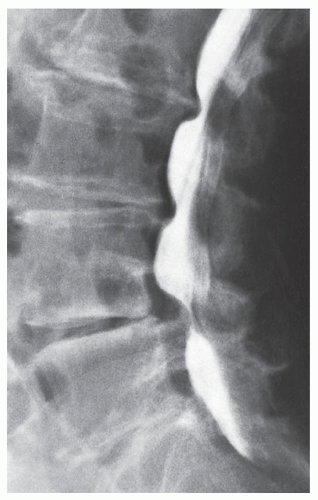 FIGURE 12.9 Myelography of spinal stenosis. Lateral radiograph of the lumbosacral spine obtained after injection of metrizamide into the subarachnoid space shows an “hourglass” configuration of the contrast agent in the thecal sac, a feature characteristic of spinal stenosis. This appearance results from concomitant hypertrophy of the facet joints and posterior bulging of the intervertebral disks. |
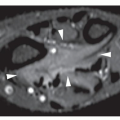
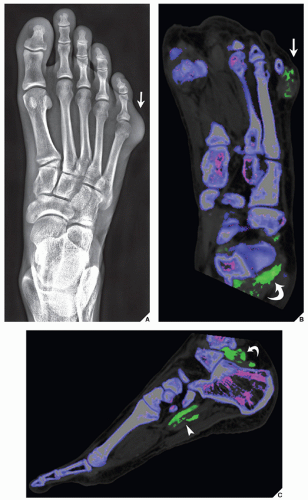 FIGURE 12.10 Dual-energy CT of tophaceous gout. A 45-year-old man presented with a painful mass of the small toe of the left foot for past 4 months. (A) Anteroposterior radiograph shows a soft-tissue mass at the lateral aspect of the fifth metatarsophalangeal joint (arrow). The osseous structures are intact, and there is no evidence of erosions. Dual-energy coronal (B) and sagittal (C) reformatted color-coded CT images, in addition to the mass at the small toe (arrow), reveal unsuspected masses (green areas) in the plantar (arrowhead) and posterior aspects (curved arrows) of the hindfoot, consistent with uric acid crystals deposition within the gouty tophi in clinically occult sites. |
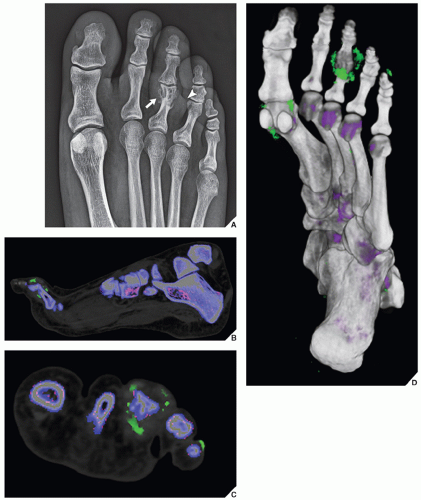 FIGURE 12.11 Dual-energy CT of tophaceous gout. A 50-year-old man presented with painful swollen third toe of the left foot. (A) Anteroposterior radiograph shows a paraarticular erosion of the proximal phalanx of the third toe (arrow), associated with a fusiform mass (arrowhead). Dual-energy (B) sagittal reformatted and (C) axial colorcoded CT images supplemented with (D) 3D reconstructed CT image viewed from the plantar aspect were diagnostic of gouty tophi in several locations (green areas). |
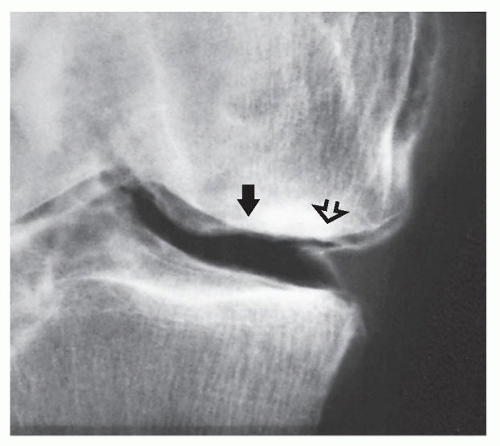 FIGURE 12.12 Arthrography of osteoarthritis. Double-contrast arthrogram in a 62-year-old man with progressive pain localized to the medial femorotibial joint compartment demonstrates destruction of the articular cartilage (arrow) and degenerative changes of the free edge of the medial meniscus (open arrow), consistent with osteoarthritis. |
Ultrasound
Ultrasound (US) is occasionally used in the evaluation of joint abnormalities. This technique helps to differentiate popliteal fossa masses in patients with rheumatoid arthritis, in whom complications of an arthritic process (such as popliteal cyst or hypertrophied synovium) may be distinguished from conditions not related to arthritis (such as popliteal artery aneurysm) (see Figs. 2.22 and 2.25). It may also effectively diagnose deep vein thrombosis, occasionally seen in patients with rheumatoid arthritis (see Fig. 2.23). At times, US may demonstrate osseous erosions and inflammatory pannus. Recently some investigators have explored the use of power Doppler US in the evaluation of rheumatoid synovitis.
Magnetic Resonance Imaging
Magnetic resonance imaging (MRI) of the joints provides excellent contrast between soft tissues and bone. Articular cartilage, fibrocartilage, cortex, and spongy bone can be distinguished from each other by their specific signal intensities. It is an excellent modality for demonstrating the rheumatoid nodules and synovial abnormalities in patients with rheumatoid arthritis. MRI’s ability to contrast the synovium-covered joint from other soft-tissue structures allows for noninvasive delineation of the degree of synovial hypertrophy that accompanies synovitis, previously demonstrable only by means of arthrography or arthroscopy. Because synovitis is often accompanied by joint effusion, this too can be effectively demonstrated by MRI (Fig. 12.14). In particular, when this technique is combined with intravenous administration of gadolinium diethylenetriamine penta-acetic acid (Gd-DTPA), it is highly effective in differentiation between fluid-filled joints and tendon sheaths from synovitis. Both, fluid and intraarticular synovial tissue exhibit an intermediate signal intensity on T1-weighted images and a high signal on T2 weighting. However, gadolinium-enhanced T1-weighted images will show high-intensity signal of inflammatory pannus/synovial tissue, whereas fluid will not enhance (Figs. 12.15 and 12.16). MRI is also quite helpful in diagnosing Baker cyst (Fig. 12.17). Although MRI is quite sensitive in detecting joint effusion, it cannot yet distinguish between inflammatory fluid and noninflammatory fluid. Occasionally, MRI may provide some additional information on osteoarthritis (Figs. 12.18 and 12.19) and hemophilic arthropathy (Figs. 12.20 and 12.21). With the development of more sophisticated orthopedic methods for cartilage repair in osteoarthritis, such as new articular cartilage replacement techniques, including chondrocyte transplantation, osteochondral transplantation, and cartilage growth-stimulating factors, optimized MRI of these interventions for diagnosis and treatment planning in osteoarthritis is essential. Recent investigations of the value of contrast-enhanced MRI with subtraction technique proved to be useful for early detection of active sacroiliitis.
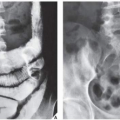
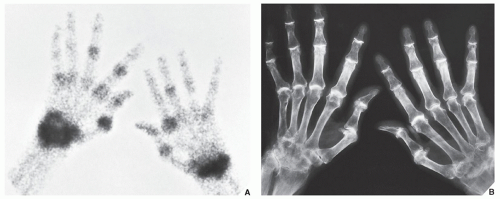 FIGURE 12.13 Scintigraphy of psoriatic arthritis. Radionuclide bone scan (A) obtained 2 hours after the intravenous injection of 15 mCi (555 MBq) of 99mTc-labeled MDP shows an increased uptake of radiopharmaceutical in several joints of the hand and wrist. A conventional radiograph (B) of the same patient shows advanced psoriatic arthritis. |
The most promising role of MRI, however, is in the evaluation of the spine. MR images in the sagittal plane are useful for demonstrating hypertrophy of the ligamentum flavum or the vertebral facets, grading the degree of foramina stenosis, and measuring the sagittal diameter of the spinal canal and the spinal cord. MR images in the axial plane facilitate detailed analysis of the facet joints and more accurate measurement of the thickness of the ligamentum flavum and the diameter of the spinal canal. The quality of evaluation of spinal cord abnormalities by MRI in the cervical area in patients with rheumatoid arthritis and of spinal stenosis in patients with advanced degenerative changes of the spine surpasses that obtained with other modalities. MRI is particularly useful in the examination of patients with pain related to disk disease because it can differentiate normal, degenerated, and herniated disks noninvasively (see Chapter 11). In fact, the changes of disk degeneration can be identified by MRI long before they can be detected by conventional radiography or CT.
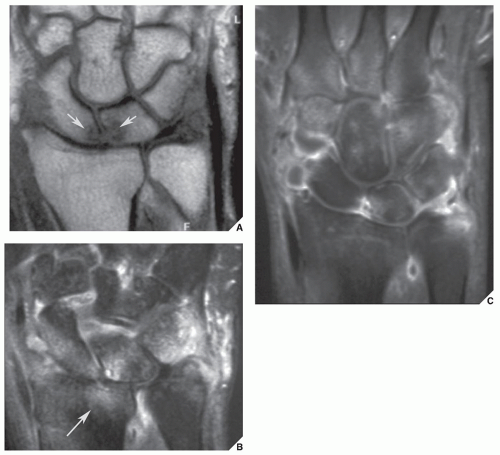 FIGURE 12.14 MRI of rheumatoid arthritis. Conventional radiographs (not shown here) showed questionable erosions in the scaphoid and lunate bones. (A) Coronal T1-weighted MRI confirms the presence of scaphoid and lunate erosions (arrows). (B) Coronal short time inversion recovery (STIR) MRI demonstrates additionally extensive bone marrow edema of the entire proximal carpal row, ulnar styloid process, and distal radius (arrow) (pre-erosive edema). (C) Coronal T1-weigthed fat-saturated MRI obtained after intravenous injection of gadolinium demonstrates strong enhancement of the synovium and multiple areas within the carpal bones, proximal metacarpals, and ulnar styloid, the hallmarks of severity and extension of the inflammation. (Courtesy of Luis Cerezal, MD, Santander, Spain). |
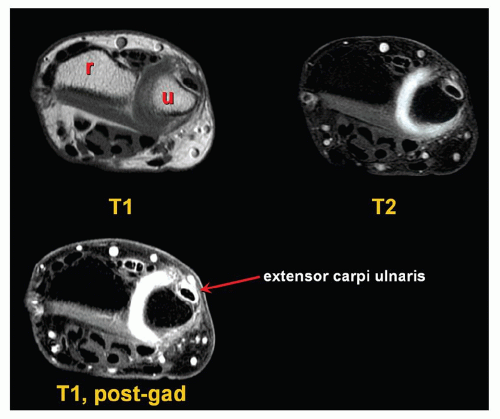 FIGURE 12.15 MRa of rheumatoid arthritis. Axial T1-weighted, T2-weighted, and contrast-enhanced T1-weighted MR images of the wrist of the 28-year-old woman with clinical diagnosis of rheumatoid arthritis show advantage of postgadolinium study for diagnosis of synovitis of the distal radioulnar joint and extensor carpi ulnaris tendon. Although the high signal on T2 weighting may indicate either fluid or inflammatory pannus, the marked enhancement on postgadolinium sequences confirms the presence of the latter, because fluid would not enhance. r, radius; u, ulna. |
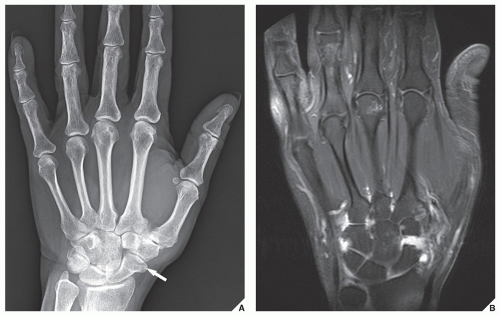 FIGURE 12.16 MRa of psoriatic arthritis. A 42-year-old man with skin lesions clinically diagnosed as psoriasis, presented with 4-month history of pain in the right wrist. (A) Dorsovolar radiograph shows small cyst-like lesion in the distal scaphoid (arrow) but no erosions nor other radiographic features of inflammatory arthritis. (B) Coronal T1-weighted fat-suppressed MRI obtained after intravenous administration of gadolinium shows erosions of the head of the third metacarpal, scaphoid, triquetrum, and hamate bones, and extensive synovitis in the intercarpal articulations, consistent with inflammatory arthritis. |
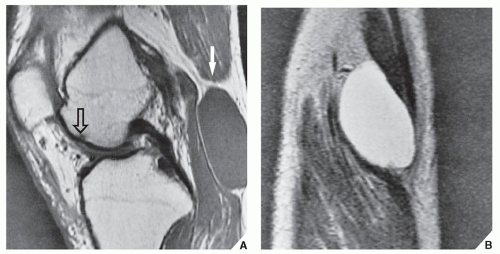 FIGURE 12.17 MRI of the Baker cyst. A 68-year-old woman with rheumatoid arthritis reported pain in the region of the popliteal fossa. The presumptive diagnosis of thrombophlebitis was made. (A) Sagittal MRI (spin echo [SE]; recovery time [TR] 900/echo time [TE] 20 msec) demonstrates an oval structure in the popliteal fossa displaying intermediate signal intensity (arrow). Also note a small subchondral erosion of the anterior aspect of the medial femoral condyle (open arrow). (B) Coronal MRI (SE; TR 1800/ TE 80 msec) at the level of the popliteal fossa demonstrates a large Baker cyst that displays a high signal intensity caused by fluid content. |
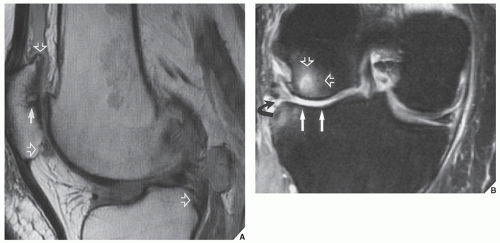 FIGURE 12.18 MRI of osteoarthritis. (A) Sagittal proton density-weighted MRI of a 62-year-old woman with osteoarthritis of the right knee shows involvement of the femoropatellar compartment. Note joint space narrowing, subchondral cyst (arrow), and osteophytes (open arrows). (B) Coronal T2-weighted fat-suppressed MR image shows complete destruction of articular cartilage of the lateral joint compartment (arrows), subchondral edema (open arrows), and degenerative tear of the lateral meniscus (curved arrow). |
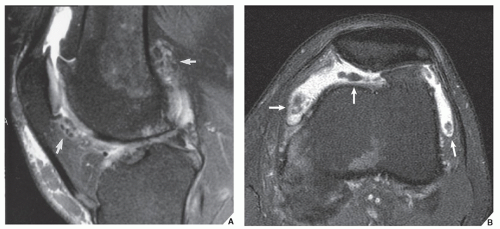 FIGURE 12.19 MRI of osteoarthritis. (A) Sagittal and (B) axial T2-weighted fat-suppressed MR images of the knee of a 60-year-old man show osteoarthritis complicated by multiple osteochondral bodies (arrows). |
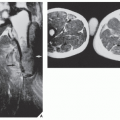
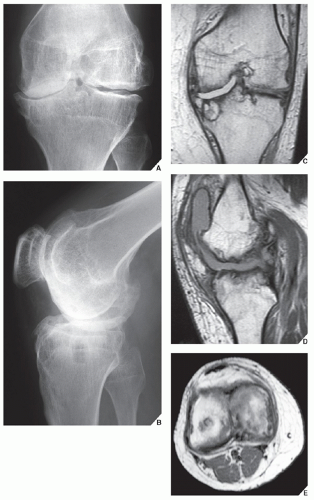 FIGURE 12.20 MRI of hemophilic arthropathy. A 29-year-old man with hemophilia and multiple episodes of intraarticular bleeding. (A) Anteroposterior and (B) lateral radiographs of the left knee demonstrate an advanced stage of hemophilia. Abnormalities include periarticular osteoporosis, irregularity of subchondral bone at the tibial plateau and femoral condyles, narrowing of the radiographic joint space, and erosion of the subchondral bone. (C) Coronal MRI (SE; TR 1900/TE 20 msec) demonstrates, in addition, complete destruction of articular cartilage at the medial joint compartment, and a large, subchondral cyst in the proximal tibia, not well appreciated on the radiographic films. (D) Sagittal MRI (SE; TR 800/TE 20 msec) demonstrates to better advantage the intraarticular blood in the suprapatellar and infrapatellar bursae, displaying intermediate signal intensity. (E) Axial MRI (TR 400/TE 20 msec) shows erosive changes of the articular cartilage of the femoral condyles. |
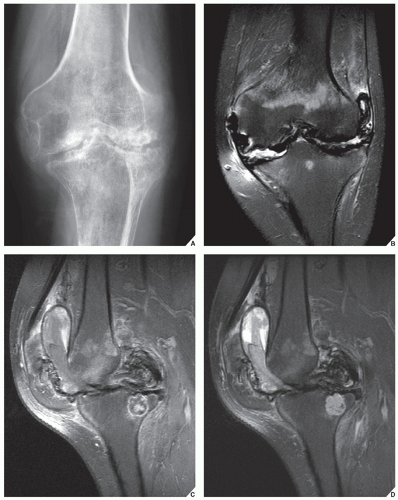 FIGURE 12.21 MRI of hemophilic arthropathy. (A) Anteroposterior radiograph of the left knee, (B) coronal proton density-weighted fat-suppressed, (C) sagittal T1-weighted contrast-enhanced fat-suppressed, and (D) sagittal proton density-weighted fat-suppressed MR images of a 34-year-old man show destructive changes of all three joint compartments. Note heterogeneous appearance of bloody effusion in the joint and suprapatellar bursa. |
The Arthritides
Diagnosis
Clinical Information
The accurate diagnosis of specific arthritis depends on many factors; however, the most important is to understand the patterns of symptoms and the mechanism of disease.
The clinical manifestations and laboratory data, in conjunction with the imaging findings, are of significant help in making the diagnosis of a specific arthritic process. The various arthritides, for example, have different frequencies of occurrence between the genders. Rheumatoid arthritis is much more common in females, and erosive osteoarthritis is seen almost exclusively in middle-aged women. Psoriatic arthritis, Reiter syndrome (currently known as reactive arthritis), and gouty arthritis, however, are more common in males. Clinical symptoms are of further assistance. Patients with reactive arthritis, for example, usually present with urethritis, conjunctivitis, and mucocutaneous lesions, and those with psoriatic arthritis may present with swelling of a single finger, the so-called sausage digit, as well as changes in the skin and fingernails. Patients with gouty arthritis may exhibit soft-tissue masses, representing chronic tophi, on the dorsal aspect of the hands or feet.
Laboratory data are also essential. Gouty arthritis, for instance, is associated with elevated serum uric acid concentrations, and a synovial fluid examination reveals monosodium urate crystals in leukocytes in the fluid. The synovial fluid of patients with pseudogout, however, contains calcium pyrophosphate crystals. The detection of autoantibodies is another important aid in the diagnostic workup. Rheumatoid factor (RF) is a typical finding in rheumatoid arthritis. Patients lacking the specific antibodies represented by RF are said to have “seronegative” arthritis. Patients with lupus arthritis have a positive lupus erythematosus cell test. Lastly, identification of the antigens of the major histocompatibility complex, particularly human leukocyte-associated antigens HLA-B27 and HLA-DR4, has in recent years become a crucial test in the diagnosis of arthritic disease. It has been reported that 95% of patients with ankylosing spondylitis, 86% of patients with reactive arthritis, and 60% of patients with psoriatic arthropathy test positively for antigen HLA-B27, whereas a majority of those with rheumatoid arthritis exhibit the HLA-DR4 antigen. This is helpful in differentiating certain types of arthritides as well as distinguishing psoriatic arthritis from rheumatoid arthritis in cases in which the radiographic presentation of these conditions may be very similar.
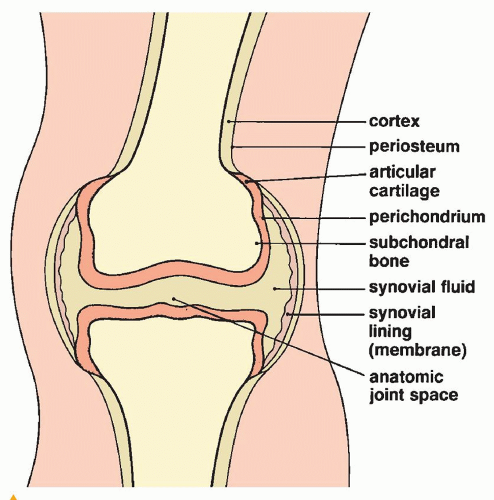 FIGURE 12.22 The constituent structures of a true or diarthrodial joint.
Related posts: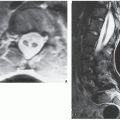 Radiologic Evaluation of Skeletal Anomalies Radiologic Evaluation of Skeletal Anomalies
 Inflammatory Arthritides Inflammatory Arthritides
 Benign Tumors and Tumor-like Lesions II: Lesions of Cartilaginous Origin Benign Tumors and Tumor-like Lesions II: Lesions of Cartilaginous Origin
 Benign Tumors and Tumor-Like Lesions III: Fibrous, Fibroosseous, and Fibrohistiocytic Lesions Benign Tumors and Tumor-Like Lesions III: Fibrous, Fibroosseous, and Fibrohistiocytic Lesions
 Benign Tumors and Tumor-Like Lesions IV: Miscellaneous Lesions Benign Tumors and Tumor-Like Lesions IV: Miscellaneous Lesions
 Upper Limb III: Distal Forearm, Wrist, and Hand Upper Limb III: Distal Forearm, Wrist, and Hand
Stay updated, free articles. Join our Telegram channel
Full access? Get Clinical Tree
 Get Clinical Tree app for offline access

|