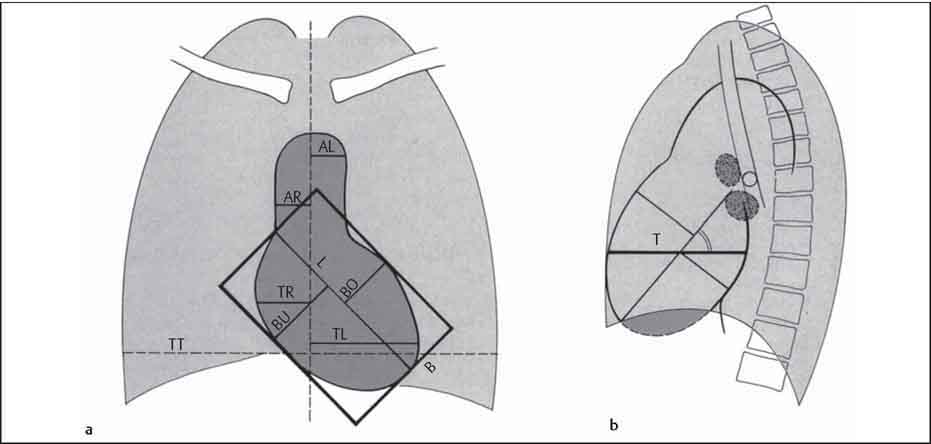
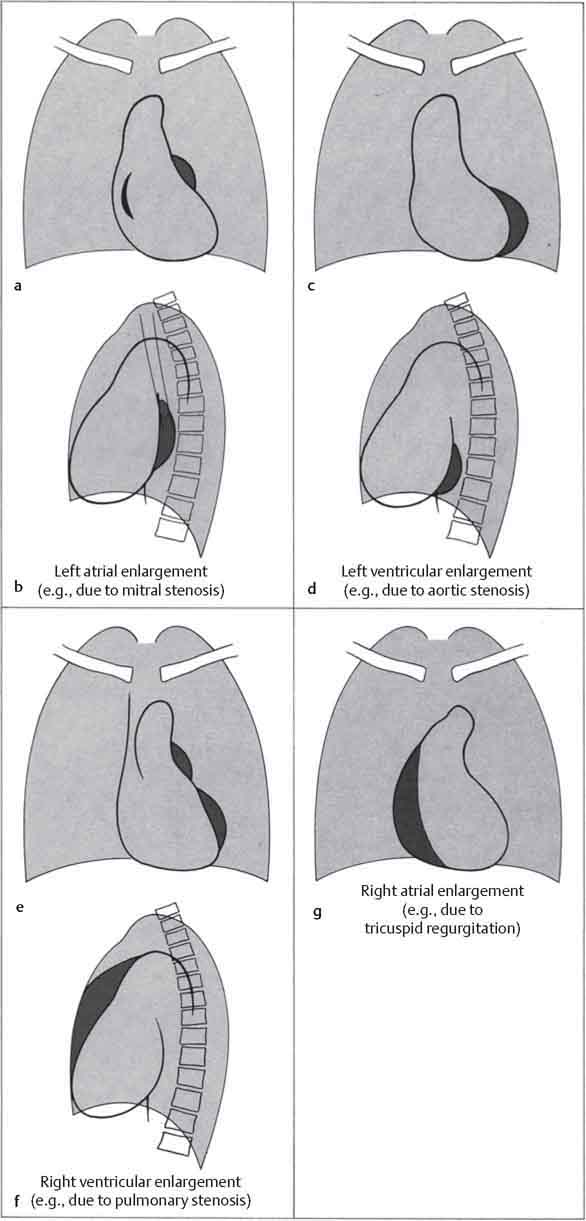
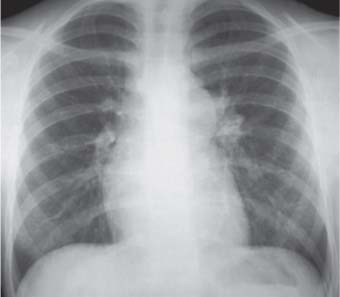
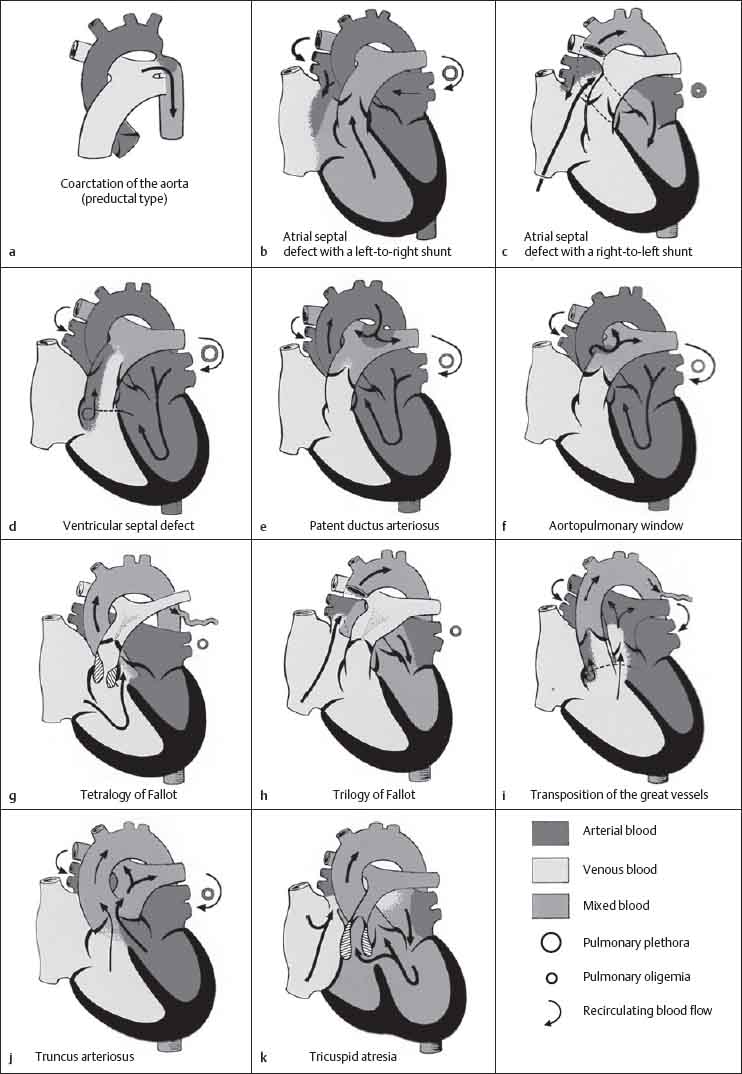
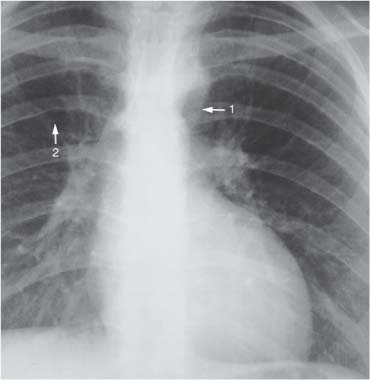
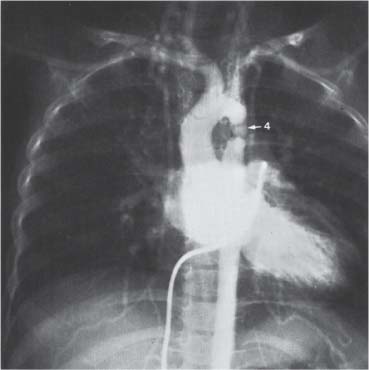
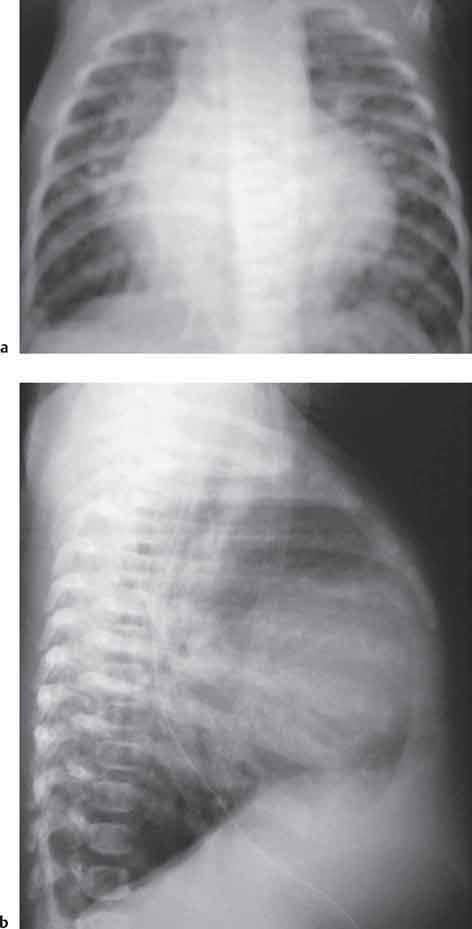
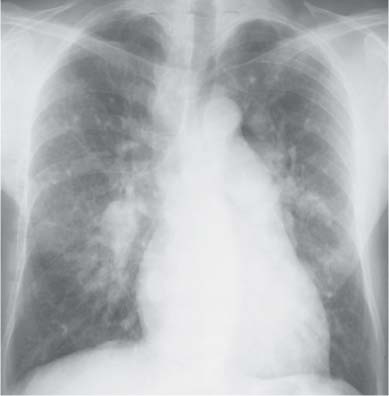
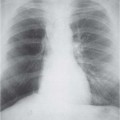
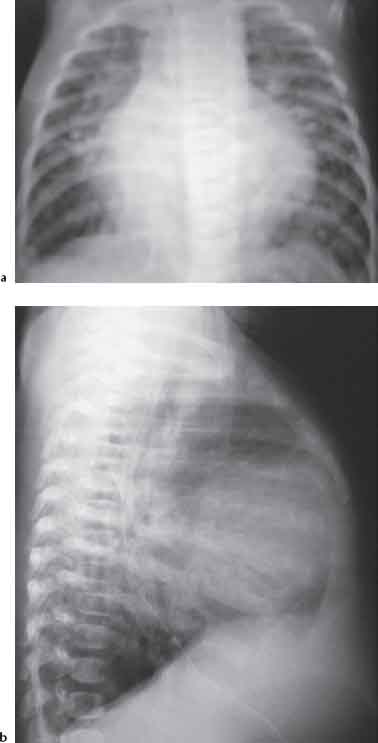
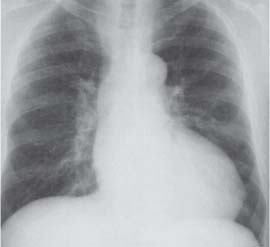
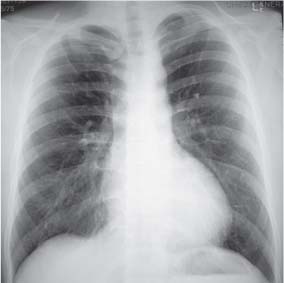
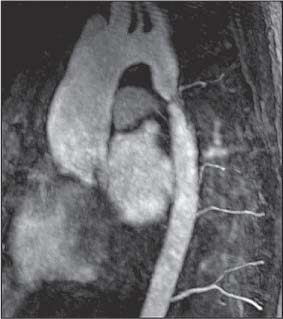
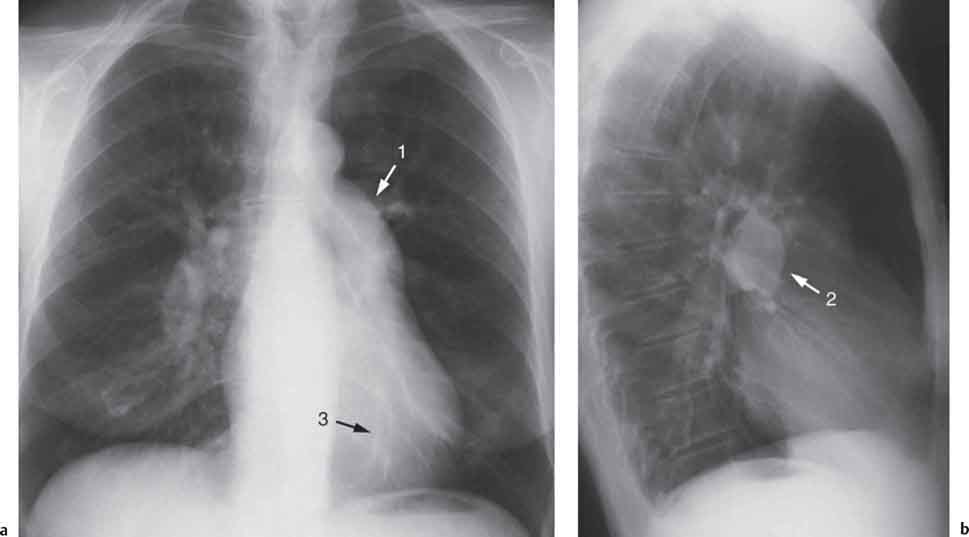
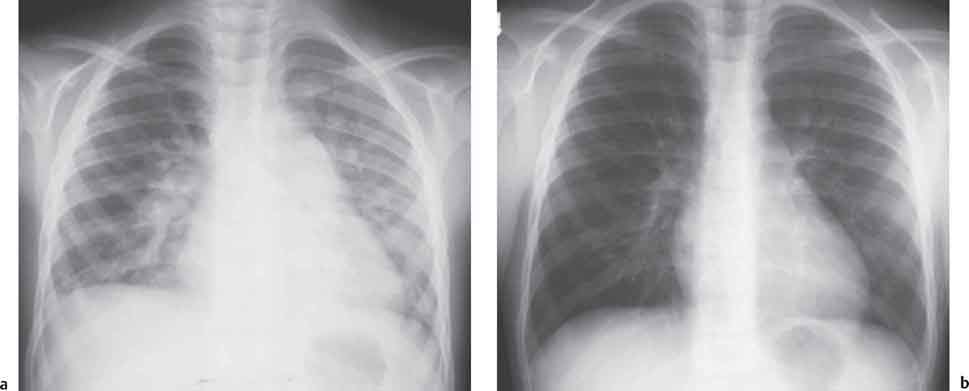
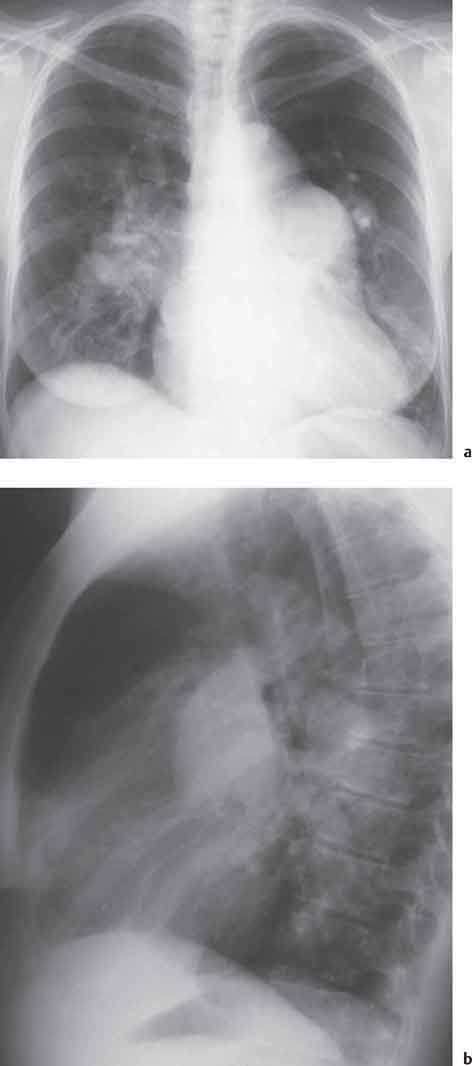
10 Radiology of Cardiac Disease Posteroanterior (PA) and lateral chest radiographs taken in inspiration are standard for evaluation of cardiac size and contour. On the PA chest radiograph, the right cardiomediastinal border is formed by the superior vena cava (SVC) and the right atrium; the left cardiomediastinal border is formed by the aortic arch, main pulmonary artery, left atrial appendage, and left ventricle (LV) (see Figs. 1.8, 10.1a). On the lateral projection, the right ventricle is in contact with the lower sternum. More superiorly, the anterior cardiac silhouette is formed by the right ventricular outflow tract and pulmonary conus. The left atrium and left ventricle form the posterior cardiac contour (see Figs. 1.9, 10.1b). While there is some variation in normal values, transverse cardiac diameter usually should not exceed the transverse diameter of one hemithorax or 50% of the widest transverse thoracic diameter. A more accurate determination of cardiac volume may be made from the lateral radiograph (Fig. 10.2) although today this has been superseded by echocardiographic assessment. Both congenital and acquired cardiac disease are frequently associated with specific chamber hypertrophy or enlargement resulting in alteration in the shape of the cardiac silhouette (Table 10.1). Radiographic features in: Fig. 10.1a, b Normal cardiac anatomy on PA and lateral chest radiographs (from Klose et al. 1991) Ao = Aorta Fig. 10.2a, b Cardiac dimensions on the PA chest radiograph. Transverse cardiac diameter T = TR + TL Table 10.1 Conditions which may alter heart size (modified from Higgins 1992) Fig. 10.3 Chest radiograph in aortic stenosis. Note the rounded cardiac apex, the left ventricular enlargement, and the poststenotic dilatation of the ascending aorta. Fig. 10.4a-g Cardiac chamber enlargement (from Klose et al. 1991). Congenital cardiac anomalies occur in 0.2 to 0.4% of the population. There is a spectrum of severity with severe anomalies being incompatible with life while other lesions may not become symptomatic until late adult life. The presence of multiple anomalies may give rise to complex hemodynamic patterns with secondary functional and structural cardiac adaptation. Cardiac anomalies may be classified according to their hemodynamic effects, i. e., the presence or absence of a shunt. Cyanosis is absent but a degree of either right or left ventricular outflow obstruction is present. Isolated pulmonary valve stenosis (10–15% of all congenital heart disease), coarctation of the aorta (COA) (5–9%), and aortic valve stenosis (3–7%) are included in this group. Pulmonary valve stenosis (PVS) is usually congenital and results from fusion and thickening of valve cusps with formation of a diaphragm perforated by an orifice the size and position of which are quite variable. The transvalvular systolic pressure gradient determines the severity of symptoms; the most severe end of the spectrum presents with right ventricular failure in infancy. “Supravalvular” pulmonary stenosis is considered to be an arteritis with segmental arterial stenosis. It is seen in Noonan“s and Williams“ syndrome and in congenital rubella. Subvalvular stenosis is frequently due to right ventricular outflow tract (RVOT) hypertrophy and the valve may be normal or dysmorphic in these patients (Boxt et al. 2003). The chest radiograph may show characteristic poststenotic dilatation of the main pulmonary artery extending to involve the left pulmonary artery and resulting in enlargement of the left hilum (Fig. 10.5). The heart is of “right ventricular” configuration with elevation, rounding, and flattening of the cardiac apex. Pulmonary vascularity is normal in most cases except in high-grade stenoses. Echocardiography: In moderate to severe stenosis, pulmonary valve leaflets are thickened with evidence of “doming” during systole. Poststenotic dilatation of the main pulmonary artery is seen with significant degrees of obstruction. Right ventricular anterior wall thickness may be measured. Pulsed (PW) and continuous wave (CW) Doppler allow estimation of the systolic gradient across the valve. The right ventricular anterior wall thickness and the systolic gradient determine the need for surgical intervention (Grainger 1992). Fig. 10.5 Congenital pulmonary valve stenosis. Chest radiograph shows poststenotic dilatation of the main pulmonary artery and left hilar enlargement. Magnetic resonance imaging (MRI): Spin echo sequences in patients with valvular stenosis show bulging of the pulmonary valve, poststenotic dilatation of the main pulmonary artery, and a degree of right ventricular hypertrophy. The presence of associated tricuspid regurgitation is variable and is dependent on the degree of RV hypertrophy. Gradient echo (GRE) sequences show the systolic jet of signal void across the valve and allow calculation of the severity of the stenosis. Right-heart catheterization with right ventricular injection confirms the diagnosis and demonstrates doming of the valve cusps during systole. The right ventricle is heavily trabeculated and right ventricular pressures are elevated considerably in severe stenosis. Childhood aortic valve disease encompasses a wide spectrum of abnormalities of varying severity. Severely dysplastic valves are associated with cardiac failure in the neonatal period, the so-called “critical aortic stenosis of the newborn.” A congenital bicuspid aortic valve is the most frequent malformation of the aortic valve and occurs in 0.9–2% of all individuals at autopsy (Roberts 1970). These lesions do not usually become symptomatic until adult life and about one-third of these individuals eventually develop aortic stenosis (Fenoglio et al. 1977) either related to the structural abnormality or secondary to an episode of bacterial endocarditis. Chest radiograph: Features of left ventricular hypertrophy and dilatation of the ascending aorta are seen only in high-grade stenosis. Echocardiography: Two-dimensional (2D) echocardiography shows the abnormal valve, a small valve ring, and a hypertrophied, hyperdynamic left ventricle. CW Doppler echocardiography allows estimation of the systolic gradient across the valve. Magnetic resonance imaging demonstrates a small aortic annulus and abnormal distribution of the aortic sinuses by the unseparated valvular commissures. The valve leaflets may be thickened and leaflet doming may be evident on gradient echo sequences. These sequences also demonstrate the systolic signal void jets of stenosis. Left ventricular hypertrophy is frequent. When there is aortic regurgitation, associated poststenotic dilatation of the ascending aorta and a degree of left ventricle dilatation may be present. GRE sequences in these cases show diastolic jets of regurgitation (Boxt et al. 2003). The pressure gradient across the valve may be estimated from the length of signal loss across the aorta (Mitchell et al. 1989) or quantified using phase velocity mapping (Kilner et al. 1991). Left ventriculography and aortography confirm the presence of left ventricular outflow obstruction and when appropriate balloon valvotomy may be performed during catheterization. Left ventricular outflow obstruction may also be supravalvular and associated with infantile hypercalcemia or subvalvular due to fibromuscular hypertrophy of the left ventricular outflow tract. Medial hypertrophy and intimal proliferation within the aorta lead to localized stenosis which becomes hemodynamically significant when it causes more than a 50 % reduction in the size of the lumen. Two forms are recognized: Fig. 10.6a-k Schematic representation of congenital cardiac anomalies (from Schinz et al. 1983). Fig. 10.7 Coarctation of the aorta. Note the left ventricular enlargement, the focal “notch” in the aorta giving a “reversed 3” configuration (1) and the rib notching (2). Fig. 10.8 Aortic coarctation: “Reversed 3” configuration of the aorta is seen. Chest radiograph: Radiographic findings in coarctation include a high aortic arch with pre- and poststenotic dilatation (Figs. 10.7, 10.8). In the postductal type, rib notching involving the 3rd to 8th ribs is due to pressure erosion by dilated intercostal collateral vessels. In the infantile type, dilatation of the pulmonary vessels may indicate the presence of a left-to-right shunt. Magnetic resonance imaging and aortography demonstrate the length and level of the coarctation segment and the degree of arterial collateralization present (Figs. 10.9, 10.10). The relationship of the origin of the subclavian arteries to the stenotic segment is important to demonstrate given the association with the aberrant subclavian artery (Boxt et al. 2003). MRI also plays a role in imaging follow-up of patients after balloon dilatation and repair of the coarctation. Fig. 10.9 Coarctation of the aorta. A catheter has been placed in the pulmonary artery, and injected contrast medium has opacified the left atrium, left ventricle, and aorta. The most common causes of a left-to-right shunt are ventricular septal defects (VSD: 20–28 % of all congenital cardiac anomalies, Fig. 10.11), atrial septal defects (ASD: 10–15%), and patent ductus arteriosus (PDA: 10–15%). Less common anomalies include Lutembacher syndrome (ASD combined with mitral stenosis) and anomalous pulmonary venous drainage (APVD). The shunt may be at the atrial (ASD), ventricular (VSD), or arterial (PDA) level. Oxygenated blood may also be shunted from the pulmonary veins back into the right atrium (APVD). Recirculating blood volume may greatly exceed the circulating systemic volume; this leads to overload of the pulmonary circulation with resulting pulmonary arteriolar sclerosis and increased pulmonary vascular resistance. This in turn induces right ventricular hypertrophy causing further increases in pulmonary arterial pressure. Eventually right heart pressure may exceed that in the left heart chambers leading to shunt reversal (Eisenmenger reaction; see Chapter 7, p. 194). Individuals with congenital left-to-right shunts may remain asymptomatic for many years but are at increased risk of endocarditis. Large shunts may be associated with marked symptomatology including impaired physical development in children. Characteristic auscultatory findings include a pansystolic murmur in VSD and a continuous murmur in PDA. In advanced untreated cases, signs of right heart failure (dilated neck veins, peripheral edema, and hepatomegaly) may supervene. Cyanosis develops with reversal of the shunt. Fig. 10.10 MRI demonstrates aortic coarctation and dilated intercostal vessels inferior to the level of the aortic narrowing. Fig. 10.11a, b Ventricular septal defect: Frontal and lateral chest radiographs show right ventricular dilatation and marked pulmonary plethora. Echocardiography shows large VSD with left atrial and biventricular enlargement. Chest radiograph: When the pulmonary to systemic shunt ratio is greater than 2:1, there is cardiomegaly (Grainger and Donner 1992) and pulmonary plethora (Higgins 1992). Other characteristic features include increased pulsation of dilated central pulmonary arteries (hilar dance) visible at fluoroscopy. The level of the shunt cannot be determined from standard radiographs although certain characteristics of the cardiac silhouette may give diagnostic clues (Fig. 10.12). Atrial septal defects are classified according to the site of the communication (see Fig. 10.6b, c): Chest radiograph: If the shunt ratio is greater than 2:1, there is usually cardiomegaly. There is dilatation of the central pulmonary arteries and a variable degree of pulmonary plethora is present. The aortic arch may appear small, probably due to a degree of aortic rotation (Figs. 10.13, 10.14). Echocardiography will demonstrate nearly all defects. When a significant shunt is present, there is evidence of right ventricular dilatation with systolic anterior motion of the interventricular septum. The four-chamber subcostal view will differentiate ostium secundum from primum defects (Grainger and Donner 1992). Fig. 10.12a, b Atrial septal defect with a left-to-right shunt. Note the central pulmonary artery dilatation (1 and 2) and the pulmonary plethora (3). Fig. 10.13a, b Ostium secundum defect. (a) Chest radiograph shows cardiomegaly, dilatation of the main pulmonary artery, and pulmonary edema. Radiograph 4 years after operative closure of the defect is almost normal (b). Magnetic resonance imaging: MRI in the axial plane has 97% sensitivity and 90 % specificity for detection of ASDs (Diethelm et al. 1987). Intravenous administration of gadolinium may help to demonstrate smaller and less apparent shunts (Manning et al. 1992). GRE sequences allow determination of the direction of the shunt and velocity-encoded cine (VEC) images allow some estimation of the volume of the shunt. Fig. 10.14 Ostium primum defect with a left-to-right shunt. There is cardiomegaly, central pulmonary artery dilatation, and pulmonary plethora. This is the most common congenital cardiac anomaly accounting for 20–28% of cases. Membranous defects are most common and occur in the upper posterior septum. Defects in the muscular septum (maladie de Roger) may be single or multiple. When multiple, they may produce a “Swiss cheese” pattern. Defects in the muscular septum are frequently quite small although the associated pansystolic murmur may be relatively loud. The magnitude of the shunt is roughly proportional to the area of the defect. With defects smaller than 0.5 cm2, systolic muscle contractions are sufficient to maintain the interventricular pressure gradient. With larger defects, the right ventricle is subjected to systemic pressures with resulting right ventricular hypertrophy. Right ventricular hypertrophy and increasing pulmonary vascular resistance lead to a reduction in the volume of the left-to-right shunt and if untreated will in time lead to its reversal (Eisenmenger reaction, see Fig. 10.6d). The chest radiograph may be normal when just a small defect is present. Larger defects are associated with the characteristic features of a left-to-right shunt including cardiomegaly, dilated central pulmonary arteries, and pulmonary plethora. Two-dimensional echocardiography will identify the site of the defect. Left atrial and left ventricular dilatation will be evident in moderate to large shunts. PW Doppler will confirm the presence of a shunt and Doppler color flow mapping will identify the site, extent, and direction of the shunt (Grainger and Donner 1992, Ludomirsky et al. 1986, Ortiz et al. 1985). Magnetic resonance imaging allows diagnosis of and determination of the size of a VSD. Large defects may be readily identified on spin echo sequences as signal voids to the left of the atrioventricular rings. Smaller more distal and muscular VSDs may be difficult to demonstrate on spin echo sequences but the signal void jet of the shunted blood on GRE sequences may allow their detection. This communication between the concavity of the aortic arch and the superior aspect of the main pulmonary artery constitutes an essential part of the fetal circulation and usually closes soon after birth. Persistence of this tubular connection (patent ductus arteriosus) permits passage of blood from the higher-pressure aorta into the pulmonary artery and through the pulmonary circulation thus creating a left-to-right shunt. The defect is variable in size but is seldom greater than 1 cm2 in cross-sectional area. An aortopulmonary pressure gradient is maintained in the majority of cases. Only the left heart chambers are enlarged initially as the shunt does not involve the right ventricle. Eventually, pulmonary vascular resistance increases as a result of increased pulmonary blood flow and this in turn leads to pressure overload on the right heart (see Fig. 10.6e). Eisenmenger reaction with shunt reversal occurs when pulmonary arterial pressure exceeds that of the systemic arterial circulation. The chest radiograph shows features of a left-to-right shunt. There is associated enlargement of structures proximal to the shunt including the left atrium, left ventricle, ascending aorta, and aortic arch (Fig. 10.15). If shunt reversal occurs (Eisenmenger reaction) then the central pulmonary arteries become more dilated and peripheral oligemia develops (Fig. 10.15). In cases of long-standing severe pulmonary hypertension with Eisenmenger reaction, calcification (Fig. 10.16) of the dilated pulmonary arteries and ductus may be seen. Two-dimensional echocardiography will show left atrial and left ventricular dilatation. PW Doppler evaluation of the pulmonary artery confirms the diagnosis showing normal forward flow from the pulmonary valve during systole with reversed flow from the bifurcation in diastole. Doppler color flow mapping allows assessment of the overall size of the shunt (Grainger and Donner 1992, see Fig. 10.17). Magnetic resonance imaging: Imaging in the coronal or in the parasagittal right anterior oblique (RAO) plane may demonstrate the ductal communication. However, no data are available on the sensitivity and specificity of MRI in diagnosis of PDA (Boxt et al. 2003). Furthermore, magnetic resonance (MR) evaluation of this anomaly may be limited in infants by the small size of the ductus and limited MR spatial resolution. Aortography: Contrast medium injected into the aortic arch will demonstrate the patent ductus and opacify the pulmonary arteries (Fig. 10.17). In TAPVD, pulmonary venous drainage is to almost any element of the sinus venosus system. This is a relatively rare anomaly accounting for approximately 2% of all cardiac malformations and is compatible with life only when a coexisting atrial septal defect is present. TAPVD may be classified into: Fig. 10.15a, b Patent ductus arteriosus. Radiographs show cardiomegaly, marked central pulmonary artery dilatation, and a dilated aortic arch.
Cardiac Size
Cardiac Contour
Tp
= Proximal main pulmonary artery (“pulmonary trunk”)
Ap
= Pulmonary artery
Asin
= Left atrium
Vci
= Inferior vena cava
Vd
= Right ventricle
Vcs
= Superior vena cava
Vsin
= Left ventricle
Ad
= Right atrium
CT ratio = transverse cardiac diameter/transverse thoracic diameter T/TT
AL
= aortic dimension to left of midline
AR
= aortic dimension to right of midline (AL + AR = 1.8−3.8 cm) L = cardiac long axis measurement
B
= BU + BO perpendicular diagonal to L (maximum short axis measurement through the heart)
T
= transverse dimension of heart in axial plane
V
= relative cardiac volume
V
= 0.4×L×B×T
Normal ratio of cardiac volume to body surface area:
In women: 450−490 cm3/m2
In men: 500−540 cm3/m2 (Amundsen 1959)
Small cardiac silhouette:
Normal-size cardiac silhouette despite the presence of significant lesions
Large cardiac silhouette:
Congenital Heart Disease
Cardiac Anomalies without a Shunt
Pulmonary Stenosis
Clinical Features
Radiologic Findings
Congenital Aortic Stenosis
Clinical Features
Radiologic Findings
Coarctation of the Aorta
Clinical Features
Radiologic Findings
Congenital Cardiac Anomalies Associated with a Left-to-Right Shunt
Radiologic Findings
Atrial Septal Defect
Radiologic Findings
Ventricular Septal Defect
Radiologic Findings
Patent Ductus Arteriosus
Radiologic Findings
Total Anomalous Pulmonary Venous Drainage (TAPVD)
Stay updated, free articles. Join our Telegram channel

Full access? Get Clinical Tree


