Fig. 3.1
Hybrid PET/CT image showing uptake of [18F]FDG in a primary cancer lesion, a mediastinal lymph node (orange), and the structure of the bronchioles (white). (From Quon A, Napel S, Beaulieu, CF, Gambhir SS. “Flying through” and “flying around” a PET/CT scan: pilot study and development of 3D integrated [18F]FDG-PET/CT for virtual bronchoscopy and colonoscopy. J Nucl Med. 2006;47:1081–7. Reprinted with permission of the Society of Nuclear Medicine)
Radiopharmaceutical Design, Synthesis, and Production
Radiolabeling
An array of chemically and radiochemically diverse radionuclides are available for PET and SPECT imaging (Fig. 3.2) [21]. Consequently, the selection of a radionuclide for a given imaging application becomes particularly important. Salient considerations include radionuclide decay characteristics (physical half-life, the types of particles emitted, particle energy and range, and the nature of daughter nuclei) and the synthetic chemistry required for incorporation of the nuclide into the radiotracer, as well as practical issues such as radiation safety, radionuclide cost, and availability. The decay characteristics of selected radionuclides which have been used for clinical investigations employing PET and SPECT imaging are reported in Tables 3.1 and 3.2, respectively [21]. In addition, the decay characteristics of selected β- and α-emitting radionuclides—often employed in radiotherapeutic agents—are presented in Tables 3.3 and 3.4, respectively [21].
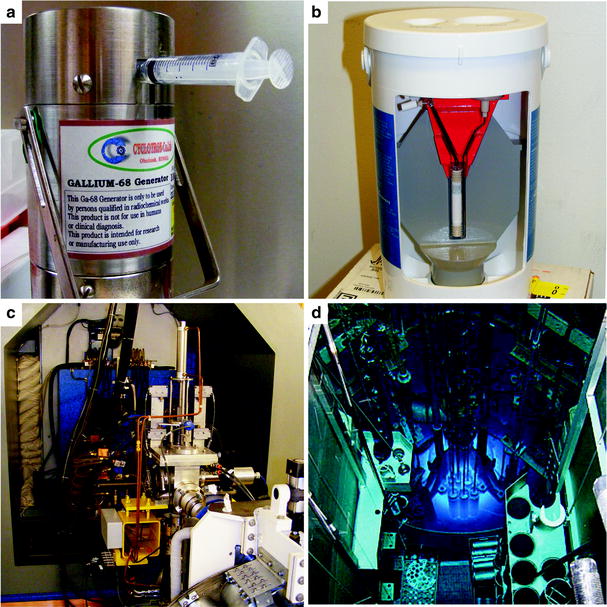
Fig. 3.2
Four methods for the production of radionuclides: (a) 68Ga generator, (b) 99mTc generator, (c) cyclotron, and (d) nuclear reactor. (Courtesy of Rashid Ghani, Memorial Sloan-Kettering Cancer Center, and David Nickolaus, Missouri University Research Reactor, for the photos of the 99mTc generator and nuclear reactor, respectively)
Radionuclide | Half-life (t 1/2) | Decay mode yield/% (error) | Production route | E(β+)/keVa | β+ Endpoint energy/keV | Abundance, I β+/% | E γ/keV (intensity, I γ/%) |
|---|---|---|---|---|---|---|---|
Cyclotron-produced conventional PET radionuclides | |||||||
11C | 1,223.1 (12) s | β+ 100 | 14N(p,α)11C | 386 | 960 | 99.8 | 511 (200) |
13N | 9.965 (4) min | β+ 100 | 16O(p,α)13N | 492 | 1,199 | 99.8 | 511 (200) |
15O | 122.24 (16) s | β+ 100 | 15N(p,n)15O | 735 | 1,732 | 99.9 | 511 (200) |
14N(d,n)15O | |||||||
18F | 109.77 (5) min | β+ 100 | 18O(p,n)18F | 250 | 634 | 96.7 | 511 (194) |
20Ne(d,α)18F | |||||||
Generator-produced unconventional PET radionuclides | |||||||
62Cu | 9.673 (8) min | β+ 97.4 | 62Zn/62Cu | 1,316 | 2,926 | 97.2 | 511 (195) |
68Ga | 67.71 (9) min | β+ 89.1 | 68Ge/68Ga | 352 | 1,899 | 87.9 | 511 (178) |
836 | |||||||
Cyclotron-produced unconventional PET radionuclides | |||||||
60Cu | 23.7(4) m | β+ 93 | 60Ni(p,n)60Cu | 840 | 1,911 | 12 | 511 (185) |
872 | 1,981 | 49 | 826 (22) | ||||
1,325 | 2,946 | 15 | 1,333 (88) | ||||
1,791 (45) | |||||||
61Cu | 3.333(5) h | β+ 61 | 61Ni(p,n)61Cu | 524 | 1,215 | 51 | 511 (123) |
60Ni(d,n)61Cu | |||||||
64Cu | 12.701(2) h | ε 43.9 | 64Ni(p,n)64Cu | 278 | 653 | 18 | 511 (35) |
β+ 17.6 | |||||||
β− 38.5 | |||||||
86Y | 14.74 (2) h | ε 68.1 | 86Sr(p,n)86Y | 535 | 1,221 | 12 | 511 (64) |
β+ 31.9 | 628 (36) | ||||||
777 (22) | |||||||
1,077 (83) | |||||||
1,153 (31) | |||||||
1,192 (21) | |||||||
89Zr | 78.41 (12) h | ε 77.3 | 89Y(p,n)89Zr | 396 | 902 | 23 | 511 (46) |
β+ 22.7 | 909 (99) | ||||||
94mTc | 52.0 (10) m | ε 29.8 | 94Mo(p,n)94mTc | 1,094 | 2,439 | 68 | 511 (140) |
β+ 70.2 | 871 (94) | ||||||
124I | 4.1760 (3) days | ε 77.3 | 124Te(p,n)124I | 687 | 1,535 | 12 | 511 (45) |
β+ 22.7 | 975 | 2,138 | 11 | 603 (63) | |||
723 (10) | |||||||
1,691 (11) | |||||||
Radionuclide | Half-life, t 1/2 (error) | Decay mode (% branching ratio) | Production route | E γ/keV | Intensity (I γ/%) |
|---|---|---|---|---|---|
67Ga | 3.2617 (5) days | ε (100) | natZn(p,x)67Ga | 93 | 39 |
68Zn(p,2n)67Ga | 185 | 21 | |||
300 | 17 | ||||
99mTc | 6.01 (1) h | β− (0.004) | 99Mo/99mTc | 141 | 89 |
IT (99.996) | |||||
111In | 2.8047 (4) days | ε (100) | 111Cd(p,n)111m,gIn | 171 | 91 |
112Cd(p,2n)111m,gIn | 245 | 94 | |||
123I | 13.2234 (19) h | ε (100) | 124Xe (p,2n)123Cs | 159 | 83 |
®123Xe ® 123I | |||||
124Xe (p,pn)123I | |||||
123Te(p,n)123I |
Table 3.3
Physical decay characteristics of β-emitting radionuclides
Radionuclide | Half-life, t 1/2 (error) | Decay mode (% branching ratio) | E np/keV | Abundance (I np/%)a | E γ/keV | Intensity (I γ/%) |
|---|---|---|---|---|---|---|
32P | 14.263 (3) days | β− (100) | 171 | 100 | – | – |
66Cu | 5.120 (14) min | β− (100) | 2,642 | 91 | 1,039 | 9 |
67Cu | 61.83 (12) h | β− (100) | 377 | 57 | 93 | 16 |
468 | 22 | 185 | 49 | |||
562 | 20 | |||||
89Sr | 50.53 (7) days | β− (100) | 1,495 | 100 | – | – |
90Y | 64.00 (21) h | β− (100) | 2,280 | 100 | – | – |
131I | 8.0252 (6) days | β− (100) | 606 | 90 | 364 | 82 |
177Lu | 6.647 (4) days | β− (100) | 177 | 12 | 208 | 10 |
498 | 79 | |||||
186Re | 3.7183 (11) days | ε (7.5) | 932 | 22 | 137 | 10 |
β− (92.5) | 1,070 | 71 | ||||
188Re | 17.0040 (22) h | β− (100) | 1,965 | 26 | 155 | 16 |
2,120 | 70 |
Table 3.4
Physical decay characteristics of α-emitting radionuclides
Radionuclide | Half-life, t 1/2 (error) | Decay mode (% branching ratio) | E α/keV | Abundance (I α/%) |
|---|---|---|---|---|
212Bi | 60.55 (6) min | α (36) | 6,050 | 25 |
β−(64) | 690 | 10 | ||
213Bi | 45.59 (6) min | α (2.2) | 5,549 | 0.15 |
β− (97.8) | 5,869 | 2 | ||
211At | 7.214 (7) h | α (41.8) | 5,870 | 42 |
ε (58.2) | ||||
225Ac | 10.0 (1) days | α (100) | 5,637 | 4 |
5,724 | 3 | |||
5,732 | 8 | |||
5,790 | 9 | |||
5,792 | 18 | |||
5,830 | 51 | |||
230U | 20.8 (21) days | α (100) | 5,817 | 32 |
5,838 | 67 |
Radionuclides can be incorporated into PET and SPECT imaging agents in a variety of ways (Fig. 3.3): as isotopic substitutes for identical atoms in the molecular structure (e.g., [15O]H2O); as non-innocent replacements for normal molecular substituents (e.g., [18F]FDG); as small, direct modifications to the building blocks of larger constructs (e.g., radioiodinated tyrosine residues in a peptide); as components of prosthetic groups coupled to macromolecules; and as metallo-radionuclides bound to large molecules modified with chelating groups (e.g., 89Zr-desferrioxamine-labeled antibodies). Regardless of the labeling method, however, the exigencies of radiochemistry demand that the incorporation of a radiolabel into any imaging agent must be rapid and highly efficient. The short half-life of many PET and SPECT radionuclides (especially 11C and 18F) dictates that radiolabeling methods must be fast, as long reaction times would result in the decay of the activity of the radiolabel. Furthermore, the radiolabeling step in the synthesis of a tracer is often left as the final chemical transformation, minimizing the time for decay between the production of the nuclide and the completion of the radiopharmaceutical.

Fig. 3.3
Strategies for the incorporation of radionuclides into radiopharmaceuticals: (a) isotopic substitution of an identical atom in the molecular structure, [15O]H2O; (b) replacement of a key molecular substituent, [18F]FDG; and (c) labeling of a macromolecule via direct, prosthetic group, and chelating group methods
The efficiency of radiolabeling and the purity of the final product are also of the utmost importance in the synthesis of a radiopharmaceutical. Simply put, the specific activity of a radiotracer is the amount of radioactivity associated with a given amount of material (i.e., Bq per mass amount). Reductions in specific activity can have deleterious effects on the biodistribution of an imaging agent, primarily due to a consequent increase in competition between unlabeled agents and their radiolabeled counterparts on the cellular level; this competition not only results in attenuated accumulation of the radiotracer in the target tissue but also increased nontarget tissue uptake. For example, specific activity is of particular importance for imaging low-density steroid-based receptors. There are typically about 10,000 steroid receptors per tumor cell, and steroid ligands have binding affinities ranging from sub-nanomolar to nanomolar concentration [22]. To avoid saturating the receptors (with the possible consequence of causing a pharmacologic effect), a small injected dose of high specific-activity radiotracer is necessary.
Given these considerations, it is not surprising that the incorporation of the radionuclide is the single most important step in the synthesis of a radiotracer. Synthetic methodologies for the radiolabeling of small molecules are often either nucleophilic or electrophilic in nature, and reaction schemes can vary widely from one tracer to the next. These methods will be addressed on a case-by-case basis throughout the chapter. Strategies for radiolabeling larger molecules are more easily generalized and are presented here as a precursor to the discussion of the agents themselves.
The strategies for radiolabeling large molecules—most often peptides or antibodies—fall into two broad categories: direct and conjugate-based labeling. Direct methods are primarily used for labeling molecules with the halogen radionuclides of fluorine, bromine, iodine, and astatine. Indeed, radionuclides of iodine—including 123I for SPECT, 124I for PET, and 131I for SPECT and radioimmunotherapy (RIT)—are particularly attractive for labeling monoclonal antibodies (mAbs). For example, in 2003, Bexxar™ ([131I]-tositumomab) was the second radioimmunoconjugate (after [90Y]-Zevalin in 2002) to receive United States Food and Drug Administration (USFDA) approval for use in humans as an RIT agent for B-cell lymphoma [23].
Direct iodination methods usually rely on the chemical modification of tyrosine or histidine residues. The most common iodination procedures employ electrophilic substitution using reagents that generate synthetic equivalents of the I+ synthon—such as the H2OI+ cation or the mixed halogen species ICl—and give radioiodinated proteins with either mono- or di-iodinated tyrosines and/or mono-iodinated histidines (Fig. 3.4). The most frequently used reagents for the generation of ICl in situ include sodium N-chlorotoluenesulfonamide (chloramine-T), introduced by Greenwood et al. in 1963; Iodobeads™ (Thermo Fisher), a solid-phase analogue of chloramine-T bound to polystyrene beads; and 1,2,4,6-tetrachloro-3α,6α-diphenylglycouril (Iodogen™, Thermo Fisher), which is insoluble in water and simplifies subsequent purification steps (Fig. 3.5) [24]. Iodination reactions are often extremely fast and can go to completion at room temperature in reactions times ranging from 10 s to 30 min. Importantly, unless the reaction occurs at a residue that is particularly important for the integrity or function of the peptide, mono-iodination does not usually affect the chemical properties of the protein. However, the oxidative conditions of the iodination reaction can affect redox-sensitive functional groups such as sulfhydryls, and the iodination of tyrosine residues can lead to UV/vis spectral red shifts from the characteristic absorbance at 280 to 305–315 nm. Further, di-iodination has the potential to reduce the aqueous solubility of the labeled compound, but under the nanomolar conditions employed in radiochemical syntheses, di-iodination reactions are unlikely.
Fig. 3.4
Radioiodination of histidine and tyrosine amino acid residues
Fig. 3.5
Reagents used for oxidative generation of electrophilic iodine species for use in radioiodination reactions
Radiohalogenations can also be achieved by employing pre-radiolabeled chemical moieties to functionalize primary amine groups (Fig. 3.6). These types of labeling reactions fall into a middle ground between direct and conjugate labeling and are thus often distinguished by the use of the term prosthetic group. Reagents for this type of labeling, most often Bolton–Hunter reagents, are commonly employed in situations in which direct radiolabeling methods are either unsuccessful or lead to the loss of function of the protein (Fig. 3.6) [24, 25]. A range of other photoactive and amine-reactive cross-linking agents based on Bolton–Hunter-type chemistry have also been developed. For example, the hetero-bifunctional agents 4-(p-azidosalicylamido)butylamine (ASBA), N-hydroxysuccinimidyl-4-azidosalicylic acid (NHS-ASA), N-[4-(p-azidosalicylamido)butyl]-3′-(2′-pyridyldithio)propionamide (APDP), sulfosuccinimidyl-2-(p-azidosalicylamido)ethyl-1,3′-dithiopropionate (SASD), and the homo-bifunctional agent bis-[β-(4-azidosalicylamido)ethyl]disulfide (BASED) are often employed for prosthetic group radioiodination and cross-linking reactions (Fig. 3.7) [24].
Fig. 3.6
Bolton–Hunter reagents for prosthetic-group labeling of proteins and mAbs
Fig. 3.7
Selected photoactive/amine-reactive cross-linking agents for radioiodination and protein functionalization reactions
Conjugate radiolabeling methods are most frequently used for radiolabeling peptides, mAbs, and antibody fragments with metallo-radionuclides such as 60/61/62/64/67Cu, 67/68Ga, 86/90Y, 89Zr, 111In, and 225Ac. Conjugate labeling involves the covalent derivatization of the molecule of choice with a bifunctional chelate via a chemically stable linker. Bifunctional chelates are chelating or macrocyclic ligands which both bind avidly to metal ions and have the ability to be covalently appended to biologically active targeting vectors. Interestingly, conjugation to biologically active molecules can be accomplished either before or after radiolabeling of the chelate. However, the functionalization of mAbs with post-radiolabeled chelates provides better control over the chemistry and thus often allows for the preparation of radiolabeled species in higher specific activity than analogous pre-radiolabeling routes. Selected examples of the more common chelates employed in conjugation and metallo-radiolabeling are presented in Fig. 3.8 [25, 26].
Fig. 3.8
Chelating and macrocyclic ligands used for metallo-radionuclide complexation and mAb conjugation
The thermodynamics and kinetics of metal ion complexation are dependent on the size, charge, and electronic configuration of the metal ion, as well as the number and types of donor atoms, charge, and cavity size of the chelating ligand. An ideal chelate has facile kinetics for metal ion complexation under mild conditions (temperature, pH, solvents) and leads to the formation of a complex with high thermodynamic and kinetic stability. For example, 1,4,7,10-tetraazacyclododecane-1,4,7,10-tetraacetic acid (DOTA) is a 12-membered tetraazamacrocycle with additional acetate functionalization at each of the four nitrogen atoms (Fig. 3.8) [27]. DOTA has a remarkable scope for complexing metal ions with +2 and +3 charges and is thus often used for binding the metallo-radionuclides of Cu, Ga, Y, In, Lu, and Ac. The scope and flexibility of DOTA chelation chemistry have been the principal driving forces behind the widespread use of this ligand in radiopharmaceutical applications.
Other common chelates and macrocycles include diethylenetriamine pentaacetic acid (DTPA) for use in the complexation of 111In and 86/90Y and the naturally occurring bacterial siderophore desferrioxamine B (DFO). DFO, isolated from Streptomyces pilosus, has recently been exploited for chelation of 89Zr4+ ions in the radiolabeling of mAbs for immuno-PET [28–31]. Furthermore, a variety of chelating and macrocyclic derivatives which contain an aryl isothiocyanate functional group for conjugation to the amines of biologically active vectors have also been reported [26].
Radiopharmaceutical Design
The ultimate goals in the development of any radiotracer are high target accumulation and low background activity. In pursuit of these objectives, the concerns in the design of novel, effective agents do not end with the production of the radiotracer. In practice, the development of a radiopharmaceutical often requires a delicate balancing act. In the case of a receptor-targeted small molecule, for example, the binding properties of the tracer for its target receptor must be given the utmost consideration; it is important that the tracers are sufficiently selective, with high binding affinity for the target and low binding affinity for other competing receptors [32]. The radiolabeling chemistry must also not perturb the affinity of the radiotracer for its receptor. It is possible that the incorporation of a radionuclide near the receptor-binding region of the small molecule can dramatically alter the interactions between the receptor and its ligand [33]. Additionally, lipophilicity is an important factor, as small molecules which are weakly to moderately lipophilic have a lower degree of nonspecific binding than those exhibiting high lipophilicity [34]. Finally, when designing an agent for brain imaging, the size, charge, and lipophilicity of a radiopharmaceutical must all be considered in the context of crossing the blood–brain barrier [35].
Pharmacokinetic properties such as the rate and stability of uptake at the target and clearance from nontarget tissues are also important parameters in achieving high target-to-background contrast ratios. An ideal imaging agent should be cleared rapidly from background tissues that are close to the target site. Very rapid uptake at the target makes the agent very dependent on perfusion. On the other hand, slow uptake (as often occurs with larger molecules such as antibodies) allows the concentration of the radiopharmaceutical at the target to reflect the concentration of receptors/antigen. The clearance rate from nontarget tissue (e.g., blood pool and extravascular tissue) is reasonable when it allows an imaging agent to accumulate sufficiently to provide a target-to-background ratio > 1.5 at a time when there is sufficient activity remaining to allow collecting PET or SPECT images in < 20 min/view. Target-to-background contrast is also influenced by the stability of radiotracers. An imaging agent with low resistance to metabolic degradation is far more likely to produce metabolites prone to circulation in the bloodstream, thereby increasing background activity and decreasing image contrast [36].
Quality Control
After the aseptic preparation and formulation of a radiopharmaceutical, several experiments must be conducted to ensure that the product is of suitable quality for in vivo clinical use. Simple physical and chemical tests are employed to measure the radiochemical and radionuclidic purity of the agents; these include instant thin-layer chromatography (ITLC), size-exclusion chromatography (SEC), and radio-analytical high-performance liquid chromatography (radio-HPLC), as well as γ-spectroscopy using a cryo-cooled, high-purity GeLi detector coupled to a multichannel analyzer (MCA). In the case of shorter-lived radionuclides (11C, 18F, 68Ga, etc.), the identity of the radionuclide is also confirmed by monitoring the rate of radioactive decay and thus measuring the half-life. Once the radiochemical purity of an agent has been established, its chemical identity must be confirmed independently. This is often achieved chromatographically by demonstrating co-elution of the radiolabeled compound with a known standard. Other essential tests of newly produced radiopharmaceuticals include endotoxin and pyrogenicity measurements, as well as residual organic solvent measurements using gas-phase chromatography (GC). For human studies, clinical trials investigating factors such as biodistribution, dosimetry, and immunogenicity must be conducted before a product can be considered safe. It is important to note that in the USA, all quality control standards are governed by the United States Pharmacopeia (USP), General Chapters 797 and 823.
The Ubiquitous Agent: 2-[18F]Fluoro-2-deoxy-d-glucose
2-[18F]Fluoro-2-deoxy-d-glucose ([18F]FDG) is the most prominent PET imaging agent, and its use in both basic science and clinical practice has fundamentally changed our understanding of cancer. [18F]FDG (Fig. 3.9) was first synthesized at the Brookhaven National Laboratory in the late 1970s, and its potential for applications in oncology continues to be the subject of extensive laboratory and clinical research [37, 38]. In 1998, [18F]FDG was approved by the Health Care Financing Administration for coverage of the evaluation of indeterminate solitary pulmonary nodules and the initial staging of lung cancer. In 2000, the USFDA likewise approved [18F]FDG for assisting in the “evaluation of malignancy in patients with known or suspected abnormalities found by other testing modalities, or in patients with existing diagnoses of cancer.” [39] These two important decisions laid the foundation for a dramatic increase in the clinical use of [18F]FDG in oncology; [18F]FDG-PET has now been approved for investigating a wide variety of malignancies and has become a routine clinical tool in the diagnosis and management of many cancers [40].
Fig. 3.9
The structure of 2-[18F]fluoro2-deoxy-d-glucose
The accumulation of [18F]FDG in tumors is predicated on the increased rate of glycolysis of cancer cells relative to normal cells [41]. This characteristic of cancer cells was first reported over 80 years ago by Otto Warburg and is thus now commonly referred to as the Warburg Effect [42]. The underlying causative mechanisms for the Warburg Effect remain the subject of considerable debate [43]; however, it is well-known that malignant tumors overexpress both glycolytic enzymes and glucose transporters [44–46]. Further, a number of other modifications which promote glycolysis have also been observed in cancer cells. Notably, elevated levels of the glycolysis activator fructose-2,6-bisphosphonate and the presence of high levels of hexokinase in the membranes of mitochondria are common characteristics of tumors [47]. From a medical imaging perspective, however, more important than the proximal and immediate causes of the Warburg Effect is the simple fact that many tumors exhibit dramatically augmented rates of glucose—and thus [18F]FDG—uptake.
[18F]FDG, like glucose, enters cells via facilitated diffusion through sodium-independent glucose transporters (Fig. 3.10) [48]. One of these transporters, GLUT-1, is often overexpressed in tumor cells, and high expression levels of others (notably GLUT-3 and GLUT-12) have also recently been reported [46]. Once inside the cell, [18F]FDG follows the normal glucose metabolic pathway and is phosphorylated by hexokinase (also overexpressed in many tumor cells) to form 2-[18F]fluoro-2-deoxy-d-glucose-6-phosphate ([18F]FDG-6P). At this point, the metabolic fates of glucose and [18F]FDG diverge. Glucose-6-phosphate is first converted to fructose-6-phosphate by phosphoglucose isomerase, irreversibly phosphorylated to fructose-1,6-bisphosphate by phosphofructokinase, and then continues on in the glycolytic pathway [49]. In contrast, the fluorine atom in [18F]FDG-6P precludes its conversion by phosphoglucose isomerase, thereby preventing further progression through the glycolytic cycle. The presence of the charged phosphate group prevents [18F]FDG-6P from leaving the cell. In theory, dephosphorylation by glucose-6-phosphatase could reverse the phosphorylation process, thereby facilitating excretion of [18F]FDG from the cell; however, many tumor cells exhibit very low levels of glucose-6-phosphatase, making this pathway unlikely [50]. Thus, [18F]FDG-6P is sequestered in the cell, and as tumor cells are often characterized by increased rates of glycolysis, [18F]FDG-6P tends to accumulate to a greater extent in tumors than in normal tissue.
Fig. 3.10
Proposed mechanism for the cellular accumulation of [18F]FDG
[18F]FDG does not localize exclusively in malignant tissues [51]. High levels of [18F]FDG uptake are often observed in the brain, kidneys, liver, gastrointestinal tract, and laryngeal muscles [52], with excreted activity in the urinary bladder. In contrast, [18F]FDG uptake in the breasts, mediastinum, and bone marrow is minimal, and muscular uptake is normally negligible, though exercise can lead to uptake in skeletal muscle, and hyperventilation can prompt uptake in the diaphragm [53].
As with all imaging modalities, [18F]FDG-PET has a number of limitations [54]. First, not all tumors exhibit elevated rates of glycolysis. For example, bronchioloalveolar carcinoma [55], many mucin-producing tumors, and other well-differentiated tumors like early prostate cancer [56] often exhibit inherently low uptake of [18F]FDG. Second, inflammation with activation of macrophages can also lead to elevated levels of [18F]FDG uptake and thus false-positive results [57, 58]. Third, variations in blood glucose levels can dramatically alter [18F]FDG uptake; this issue becomes especially important with diabetic patients. Fourth, the limited spatial resolution of commercial systems can lead to false-negative results when dealing with particularly small tumors [59, 60]. Finally, the physiologically high levels of [18F]FDG in the brain (vide infra) limit the applicability of [18F]FDG-PET scans in brain tumor imaging.
From an analytical perspective, while qualitative examination plays a significant role in the assessment of PET images, quantitative measures—most notably standardized uptake values (SUV)—also play an important role in the evaluation of [18F]FDG uptake [61]. The SUV is a ratio between the concentration of a radiotracer in a particular area of the body (e.g., a tumor) and its concentration in the entire body if it were uniformly distributed throughout [62]. Practically, SUVs are obtained by determining the activity of a radiotracer in a given region of interest (in microcuries per cubic centimeter) and dividing this value by the injected dose divided by the patient’s body mass:
While the methods of calculating SUVs can vary and are thus subject to debate, a few basic requirements exist, including the use of attenuation-corrected scans, accurate image calibration, and body weight measurements. In the case of [18F]FDG, SUVs can provide a valuable quantitative counterpart to the normally qualitative analysis of PET images. In pulmonary lesions, for example, a cutoff SUV of 2.5 is generally accepted for differentiating between benign and malignant tissues [40]. Furthermore, [18F]FDG values have also been shown to be useful in the assessment of treatment efficacy. In one study, dramatic (over 60%) decreases in [18F]FDG SUVs were observed after chemotherapeutic treatment in patients with non-Hodgkin’s lymphoma [63].
In the clinic, [18F]FDG is employed in the diagnosis, staging, and restaging of a wide variety of tumors. Particularly notable is the effectiveness of [18F]FDG in the detection of distant metastases; an assessment of a variety of clinical studies showed that for the majority of distant metastases, the sensitivity and specificity of [18F]FDG-PET are well over 85% (Table 3.5, Fig. 3.11) [43, 64, 65]. Specific applications of [18F]FDG have been reviewed elsewhere [40, 51, 64, 66, 67], and a recent special contribution describing “Recommendations on the Use of [18F]FDG-PET in Oncology” has been published in the Journal of Nuclear Medicine [68]. Further examples of the use of [18F]FDG appear throughout this book.
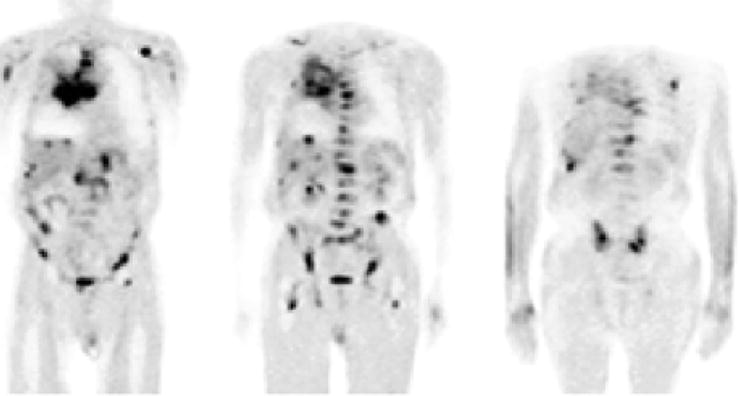
Table 3.5
Detection of metastases by [18F]FDG-PET
Cancer location/type | Patients | Site | Sensitivity | Specificity |
|---|---|---|---|---|
Breast [257] | 44 | Bone | 84 | 99 |
Breast [258] | 50 | LN | 95 | 66 |
Breast [259] | 23 | LN | 94 | 100 |
Cervical [260] | 33 | Local | 60 | 94 |
Colon [261] | 42 | Liver | 100 | 100 |
Colon [262] | 28 | Extrahepatic or hepatic | 100 | 91 |
Colon [263] | 68 | Distant and local | 95 | 83 |
Colon [264] | 37 | Liver | 88 | 100 |
Head and neck [265] | 60 | LN | 90 | 94 |
Melanoma [266] | 38 | Liver | 91 | 92 |
Nasopharyngeal [267] | 95 | Distant | 100 | 90 |
NSCLC [65] | 120 | LN | 100 | 98 |
NSCLC [65] | 120 | Distant | 98 | 92 |
NSCLC [268] | 110 | Bone | 90 | 98 |
Ovarian [269] | 50 | Staging | 87 | 100 |
Prostate [270] | 24 | LN | 75 | 100 |
Salivary [271] | 48 | Staging | 93 | 96 |
Renal [272] | 53 | Liver | 100 | 94 |
Renal [273] | 15 | Lung | 90 | 80 |
Gastric [274] | 68 | LN | 94 | 92 |
Esophageal [275] | 91 | Distant | 57 | 97 |
Fig. 3.11
A 69-year-old man with SCLC and multiple metastases. Coronal [18F]FDG-PET images show the primary tumor in the right lung and mediastinum and metastases in the liver and right adrenal gland, the thoracic and lumbar spine, ribs, upper limbs, femora, and pelvis. (From Brink I, Schumacher T, Mix M, et al. Impact of [18F]FDG-PET on the primary staging of small-cell lung cancer. Eur J Nucl Med Mol Imaging 2004;31, with permission of Springer Science and Business Media)
Imaging the Tumor Microenvironment
The molecular imaging of tumors is often predicated on exploiting differences between neoplastic and normal tissue. From a targeting perspective, these phenotypic abnormalities fall into two broad categories: those characteristic of individual cells (e.g., the presence or absence of particular cancer biomarkers) and those characteristic of the tumor microenvironment as a whole (for instance, the hypoxic or acidic nature of many tumors). The following sections discuss radiopharmaceuticals which target properties of the tumor microenvironment, specifically agents which exploit abnormalities in tumor angiogenesis, perfusion, and hypoxia.
Imaging the Tumor Microenvironment: Angiogenesis
Angiogenesis is the fundamental process by which new vascular channels are formed from preexisting ones, as seen, for example, in the repair and regeneration of tissue during wound healing [69]. If the growth of new blood vessels requires the differentiation of cell precursors (angioblasts) into endothelial cells (e.g., in embryonic development), the phenomenon is strictly referred to as vasculogenesis [70]. In general, angiogenesis is tightly regulated by a balanced interaction between stimulatory and inhibitory signaling molecules [71]. However, if this dynamic balance is perturbed by, for example, a primary tumor that releases vascular endothelial growth factors (VEGF), the rapid proliferation of new vessels can occur (Fig. 3.12) [72].
Fig. 3.12
Schematic representation of the process of angiogenesis. The formation of heterogeneous neovasculature in and around the nascent tumor will provide it with both essential nutrients for growth and survival and an avenue for metastasis
In cancer, angiogenesis is essential to the survival and growth of developing tumors. When a tumor is smaller than a few millimeters across, it can readily gain oxygen and nutrients via passive diffusion through neighboring tissues. To permit the tumor to grow larger than a few millimeters, however, the tumor requires dedicated blood vessels to supply the developing malignancy with nutrients. In contrast to the vasculature of normal organs, the neovasculature of tumors is a heterogeneous network of leaky, dilated, irregular blood vessels through which the tumor can receive both oxygen and nutrients [73, 74].
Given its paramount importance in the development of tumors, angiogenesis has received considerable attention as a target for chemotherapeutic agents. The first antiangiogenic drug approved by the USFDA was a humanized monoclonal antibody called bevacizumab which targets VEGF [75]. Indeed, much of the focus in the development of angiogenesis radiotracers has been given to two classes of stimulatory signaling pathways: the VEGF/VEGF receptor (VEGFR) and integrin pathways. Peptides, monoclonal antibodies, and proteins have been labeled with various radionuclides and have been used with either SPECT or PET to target the angiogenic modulators. Radionuclide-based nanoparticles are also currently under investigation for the multi-modality imaging of these pathways [76].
The VEGF/VEGFR signaling pathway is mediated by a class of receptor tyrosine kinases, namely VEGFR-1 (Flt-1/FLT-1) and VEGFR-2 (Flk-1/KDR). VEGFR-2 is preferred over VEGFR-1 as a target for imaging agents because laboratory studies demonstrated high VEGFR-1 expression in rodent kidneys, which are considered a dose-limiting organ. In addition, VEGFR-2 is the major mediator of the mitogenic, angiogenic, and permeability-enhancing effects of VEGF [71]. A recent report by Cai et al. demonstrated that [64Cu(DOTA)]-VEGF121 has nanomolar binding affinity to VEGFR-2, and blocking studies with non-radiolabeled VEGF121 confirmed that binding of the radiotracer is specific for VEGFR [77]. In the same study, PET imaging of [64Cu(DOTA)]-VEGF121 showed a significant difference in tumor uptake between small and large U87MG tumors. In highly vascularized small tumors where VEGFR-2 expression is high, the tracer localized rapidly, achieving a concentration of about 15%ID/g; in contrast, large tumors with low VEGFR-2 expression levels had sporadic, low tumor uptake of about 3%ID/g. In a Phase I clinical trial, 20 patients with progressive solid tumors were treated with various doses of HuMV833, a humanized version of a murine anti-VEGF mAb MV833. The same patients were also treated with [124I]-HuMV833 to measure the distribution and clearance of HuM833 with PET. The PET data demonstrated that on a per-patient and per-lesion basis, tumor biology is heterogeneous [78].
Another pathway, integrin signaling, can also be exploited for imaging tumor angiogenesis. Integrins are cell adhesion molecules that are expressed on either endothelial or carcinoma cells. There are 24 known integrin molecules with distinct adhesive properties [79]. Among them, the most studied is αvβ3, which is found on both tumor neovasculature and tumor cells. Peptides containing an integrin-binding, arginine-glycine-aspartic acid (RGD) peptide motif have been labeled with various radionuclides to image tumor angiogenesis in models which overexpress αvβ3 [80]. For example, Galacto-RGD labeled with 18F was studied in 19 cancer patients: 7 had metastatic melanomas, 10 had sarcomas, and 2 had osseous metastases. Dynamic PET scans of the tumors over 60 min followed by static scans revealed an SUV range of 1.2–9.0 at various tumor sites, demonstrating that 18F-Galacto-RGD PET allows imaging of αvβ3 integrin expression in tumors with high contrast (Fig. 3.13) [81].
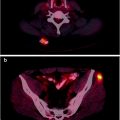
Fig. 3.13
Patient with invasive ductal breast cancer of the left breast (arrow, open tip), axillary lymph node metastases on the left side (arrow, open tip, dotted line), and an osseous metastasis to the sternum (arrow, closed tip). The maximum intensity projection of the 18F-Galacto-RGD PET [(a), stand-alone PET] and the planar image [(b), stand-alone PET, (c), CT, separate scan] show the primary tumor, the lymph node metastases and the osseous metastasis (d) Structure of 18F-Galacto-RGD. (From Beer AJ, Schwaiger M. Imaging of integrin αvβ3 expression. Cancer Metastasis Rev. 2008;27:631–44, with kind permission of Springer Science and Business Media)
Imaging the Tumor Microenvironment: Perfusion
Perfusion of the tumor and surrounding tissues also holds tremendous promise as a clinical tool for the planning, monitoring, and evaluation of therapy. In recent years, tracers bearing PET radionuclides such as 13N and 82Rb have been used extensively in the evaluation of myocardial, cerebral, and pulmonary perfusion [82–84]. However, despite their significant potential, the clinical impact of PET and SPECT radiotracers for imaging tumor perfusion has been limited.
[15O]H2O is one of the most promising radiotracers for PET imaging of tumor perfusion [85]. The radiotracer diffuses passively through membranes, has 100% first-pass tissue extraction, and, due to the abundance of unlabeled water in the body, does not participate appreciably in metabolic processes over the time course of a typical study. Therefore, [15O]H2O can be described as an inert tracer and can provide clinicians with highly accurate quantifications of tumor blood flow [86]. Furthermore, [15O]H2O is easily produced with small cyclotrons, has a half-life (2 min) suitable for repeat experiments, and has favorable dosimetric properties. Finally, from a practical standpoint, [15O]H2O can be administered by several routes including bolus injection, continuous intravenous infusion, and, interestingly, as [15O]CO2, which is converted to [15O]H2O by carbonic anhydrase in the lungs.
Over the past 15 years, [15O]H2O has most frequently been employed in investigations of blood flow, hypoxia, and neovascularization in primary and secondary brain tumors [87, 88]. Furthermore, [15O]H2O has been utilized in the clinical assessment of perfusion in breast [89–91], renal [92], intra-abdominal [93], colon [94], and lung [95–97] cancers and has also been used to evaluate vasculature-targeting chemotherapeutic treatments [98, 99]. For example, [15O]H2O and [18F]FDG were used in conjunction to measure the blood flow and glycolytic activity of solid tumors before and after treatment with the antiangiogenic chemotherapeutic human recombinant endostatin (Fig. 3.14) [98]. In another investigation, [15O]H2O was successfully employed to measure the reduction in perfusion of solid tumors in patients treated with the vasculature-targeting agent combretastatin A4 phosphate (CA4P) [100]. Interestingly, [15O]H2O and [15O]CO have often been employed together in investigations as tracers for tumor perfusion and blood volume, respectively [86, 88, 100].
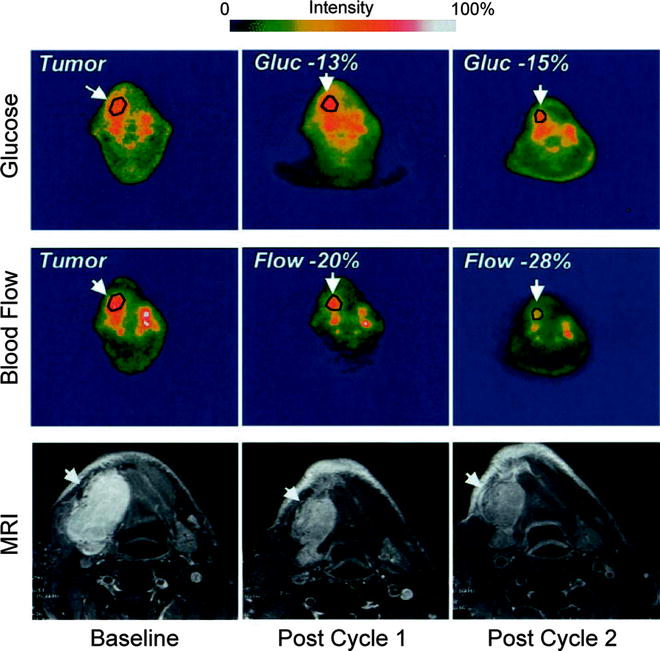
Fig. 3.14
PET scans before and after antiangiogenic treatment with human recombinant endostatin of a representative patient with synovial cell carcinoma of the mandible. Scans depicting both tumor glycolytic activity ([18F]FDG) and perfusion ([15O]H2O) are shown alongside MRI scans of the lesion. Tumor glucose metabolism and blood flow decreased with each interval of tumor measurement, and the mass also decreased in size during the same period of treatment. (Adapted from Herbst RS, Mullani NA, Davis DW, et al. Development of biologic markers of response and assessment of antiangiogenic activity in a clinical trial of human recombinant endostatin. J Clin Oncol. 2002;20:3804–14. © 2008 American Society of Clinical Oncology. All rights reserved)
Not surprisingly, several important drawbacks to the use of [15O]H2O in perfusion imaging exist. Most notably, the [15O]H2O blood flow model becomes unreliable at high flow rates, a consequence of the dependence of the model on the difference between the time–activity curves of arteries and tissue. However, this is not a major concern in tumor perfusion imaging, as the flow rates in the heterogeneous neovasculature of tumors are usually low. In addition, increased activity at the site of administration may obscure organs or sites of interest. Finally, the temporal and spatial resolution of [15O]H2O PET dictate that it provides a measure of perfusion of the whole region of interest throughout the duration of the scan. Consequently, microscopic (i.e., within a specific area of a small tumor) and ephemeral (i.e., within a small amount of time) changes in blood flow cannot be measured accurately.
Copper complexes of pyruvaldehyde bis(4-N-methyl-3-thiosemicarbazone) — [62CuIIPTSM] (t 1/2 = 9.8 min.) or [64CuIIPTSM] (t 1/2 = 12.7 h) — have also shown potential as blood flow tracers in the brain, myocardium, and kidney [3, 83, 101–103]. Given their success as imaging agents in normal tissue, they have also been subject to considerable interest as tracers of tumor perfusion [104–106]. The lipophilic metal complexes travel through the blood stream and freely diffuse across cell membranes; once inside the cell, however, sulfhydryl groups reduce the copper from CuII to CuI, and subsequent proton-mediated ligand-dissociation sequesters the radionuclide within the cytoplasm. To date, the complexes have been employed in the imaging of models of spontaneous neoplasms [105] and colorectal cancer [106] and in evaluation of the performance of chemotherapeutics in colorectal liver metastases [104]. However, Cu-bis(thiosemicarbazonato) complexes have so far failed to have significant impact in the clinic, as their lipophilicity leads to a high affinity for serum albumin, a property which reduces tissue uptake at high rates of blood flow [107]. Subsequent generations of these compounds have sought to decrease lipophilicity by functionalizing the complex with hydrophilic groups, including glucose [108, 109].
Other PET perfusion imaging agents include [13N]NH3, [82Rb]RbCl, 18F-fluoromethane, and 68Ga-citrate. These radiotracers are mostly used in brain and myocardial imaging but have also received attention from the oncologic imaging community [83, 110]. However, each has inherent limitations that seriously impair its suitability for imaging tumor perfusion. For example, while [13N]NH3 has been employed in a small number of brain tumor perfusion studies [111], both its participation in the glutamine synthetase metabolic pathway and concerns about its reliable extraction into tissues have limited its application in clinical cancer research; 201Tl has poor spatial resolution resulting from its lower energy photons, and [82Rb]RbCl, while an attractive tracer for myocardial imaging, has been limited by the variability in its extraction from blood by various normal and malignant tissues. Clearly, despite some important successes, the measurement of tumor perfusion with PET remains very much a developing field.
Imaging the Tumor Microenvironment: Hypoxia
Hypoxia is a pathological condition characterized by reduced levels of tissue oxygenation; hypoxic cells have oxygenation levels of <3 mmHg, compared to 20–80 mmHg for their normal counterparts [112, 113]. In tumors, vascular irregularities can lead to inefficient supplies of oxygen (ischemic hypoxia) and other nutrients to rapidly proliferating regions. The severity of tumor hypoxia is highly dependent on the cancer phenotype; for example, hypoxia is often particularly severe in cervical cancer [114]. Furthermore, the presence of hypoxia is associated with other important changes in the tumor microenvironment, including the stimulation of angio- and vasculogenesis, apoptosis, and an increased propensity for tumor invasion and metastasis [115]. In the clinical setting, patients with hypoxic tumors have been shown to have a poorer prognosis for disease-free survival after standard surgical, chemo-, or radiotherapeutic treatment [116–118].
Hypoxia also presents a problem for standard chemo- and radiotherapeutic treatment. Gray et al. demonstrated that the presence of oxygen at the time of irradiation is responsible for radiation sensitivity [112, 119]. Furthermore, the origins of chemotherapeutic resistance involve several factors which include altered gene expression and changes in the rate of cell cycle progression [120]. As most anticancer drugs target rapidly proliferating cells, the decreased rate of cell cycle progression with increasing distance from tumor vasculature causes decreased cytotoxicity in hypoxic tissues. In addition, the concentration of anticancer drug decreases with increased distance from the capillaries, a consequence of both the limited diffusion and high reactivity of most drugs. The limited diffusion of drugs from blood vessels is a major problem of targeted therapies and is also an important consideration for radiopharmaceutical development. Figure 3.15 shows the relative change in tissue oxygen concentration as a function of distance from blood vessels.
Fig. 3.15
Schematic representation showing the relative change in tissue oxygenation as a function of distance from the vascular system. At distances >100 μm, hypoxia begins to develop which stimulates further changes in tissue physiology. (From Carroll VA, Ashcroft M. Targeting the molecular basis for tumour hypoxia. Expert Rev Mol Med. 2005;7:1–16. © Cambridge Journals, published by Cambridge University Press, reproduced with permission)
A range of radiotracers have been developed as potential hypoxia-selective imaging agents (Fig. 3.16). Most of these have been developed for use with PET imaging. In particular, two agents, 18F-fluoromisonidazole (18F-FMISO) and the 64CuII complex of the diacetyl-2,3-bis(4-N-methyl-3-thiosemicarbazonato) ligand ([64CuIIATSM]) have been translated for use in the clinic. Extensive mechanistic studies have also been reported for both nitroimidazoles [121] and copper bis(thiosemicarbazonato) complexes [122–124]. With regard to the metal complexes, selectivity for hypoxia both in vitro and in vivo is thought to be the result of delicate equilibria involving the initial reduction of the compound to give an anionic species, protonation, and subsequent metabolism [122]. [64CuIIATSM], for example, can freely diffuse in and out of normoxic cells, but the altered redox environment of hypoxic cells leads to its selective metabolic trapping. The performance of 18F-FMISO and [64CuIIATSM] for PET imaging of hypoxia are the subject of ongoing Phase I/II clinical trials [125–127].
Fig. 3.16
Chemical structures of a range of compounds that have been explored in the design of hypoxia-selective radiotracers
In 2006, Yuan et al. validated [64CuIIATSM] as a radiopharmaceutical for delineating hypoxia both by performing in vivo PET studies and also by comparing the autoradiographic distributions of [64CuIIATSM] in tumor slices with the well-established hypoxia markers EF5, pimonidazole, and carbonic anhydrase IX [128]. This study confirmed that [64CuIIATSM] is a valid PET marker of hypoxia for some but not all tumors. In the clinic, [64CuIIATSM] has been used successfully for imaging lung metastasis [127] and cervical carcinoma [129], but concerns remain over its ability to delineate hypoxia in other types of cancer, such as prostate cancer [130, 131]. The first human trials of [64CuIIATSM] as a radiopharmaceutical for PET imaging of lung cancer were conducted in 2000 [132]. Later, in 2003, Dehdashti et al. demonstrated that in a sample of 14 patients with non-small-cell lung cancer (NSCLC), tumor uptake of [60CuIIATSM] was predictive of patient response to radiotherapy [127]. PET images were acquired pre-therapy using both [18F]FDG and [60CuIIATSM] (Fig. 3.17) [127, 133]. Tumor uptake of [18F]FDG was not significantly different between those patients who responded to therapy and nonresponders. Furthermore, [18F]FDG uptake did not correlate with [60CuIIATSM] uptake. Of the 14 patients, 8 responded to radiotherapy, with 5 making a complete recovery and 3 showing partial response. Patients who responded to therapy were found to have pre-therapy tumor-to-muscle (T/M) ratios for [60CuIIATSM] uptake of 1.5 ± 0.4, whereas nonresponders showed much high tumor uptake, with T/M ratios of 3.4 ± 0.8. Interestingly, [64CuIIATSM] has also been characterized as a potential hypoxia-selective agent for radiotherapy [134].
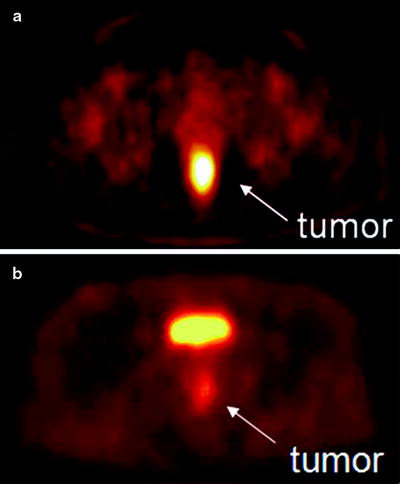
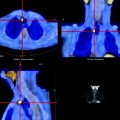
Fig. 3.17
(a) [60CuIIATSM] PET scan showing a hypoxic tumor (tumor-to-muscle (T/M) uptake ratio = 3.1). The tumor has increased tracer uptake compared with surrounding tissues because the [60CuIIATSM] is reduced and retained more avidly in hypoxic tissues. This tumor did not respond to neoadjuvant chemoradiation therapy. (b) [60CuIIATSM] PET scan showing a normoxic tumor (T/M ratio = 2.3). This tumor responded to neoadjuvant chemoradiation therapy. The bright spot above the tumor is the bladder. (From Dietz DW, Dehdashti F, Grigsby PW, et al. Tumor hypoxia detected by positron emission tomography with 60Cu-ATSM as a predictor of response and survival in patients undergoing neoadjuvant chemoradiotherapy for rectal carcinoma: a pilot study. Dis Colon Rectum 2008;51:1–8, with permission)
Imaging Cancer Biomarkers
While targeting the overall microenvironment of tumors is a promising strategy for cancer imaging, it is not the only option. Malignant tumors can often be discriminated from healthy tissues by differences present on the cellular level. These alterations often manifest themselves in the presence or overabundance of molecular biomarkers. These biomarkers are usually displayed on the cell surface and as such offer extremely attractive targets for radiotracers capable of avid, marker-specific binding. In addition, significant discrepancies in fundamental cellular processes—notably the metabolism of molecular building blocks—exist between cancerous cells and their normal counterparts, and these differences can also be exploited as targets for imaging. In the following pages, the targeting of these cellular differences by small molecules, peptides, and antibodies will be discussed.
Imaging Cancer Biomarkers with Small Molecules
Small molecules are organic moieties with median molecular weights of 450 Da and below [135]. Typically, these agents accumulate at their intended target sites through metabolic, transport-based, or receptor-mediated processes [136]. Examples of agents that follow each of these pathways are included in the following pages.
Hormone Receptors
Hormone receptors—most notably steroid, sigma, and folate receptors—are often overexpressed in breast and prostate tumors. Specifically, estrogen, progesterone, and androgen receptors are found in the cell nucleus, whereas sigma and folate receptors are membrane-bound [36, 137]. A number of receptor-targeted, small-molecule imaging agents have been developed to obtain both information about the location of the tumor and to assess the level and functional status of these receptors themselves. Several of these molecules labeled with radiohalogens, 99mTc, and 68Ga have proved successful in animal models, but only a handful have been translated to the clinic (Table 3.6) [138, 139]. One of the most promising small-molecule imaging agents studied to date is 16α-18F-fluoro-17β-estradiol (18F-FES), a radiopharmaceutical employed most often in breast cancer (Fig. 3.18) [140, 141]. 18F-FES has high estrogen receptor (ER) binding affinity and can be prepared in high specific activity [142]. Also, an improved automated radiosynthesis of 18F-FES has been developed [143]. In a study of 13 breast cancer patients, 18F-FES uptake was detected in primary breast carcinomas and generated PET images which correlated strongly with ER concentrations obtained by in vitro receptor binding assays (R = 0.96) [144]. In another human study, 18F-FES PET could be used as a predictive tool to assess patient response to hormone therapy [145]. Despite the clear clinical utility of 18F-FES, it is still not considered an optimal tracer due to its facile reduction to give radioactive metabolites that recirculate in the blood. In an effort to remedy this issue, several analogs of 18F-FES have also been synthesized by radiolabeling the parent molecule with 18F at various positions (C-2, C-4, C-17) or adding a methoxy group at C-11 [142, 146, 147].
Table 3.6
Some small molecule imaging agents that have been tested in the clinic
Imaging agent | Imaging modality | Receptor target | Tumor type | No. of patients |
|---|---|---|---|---|
Z-123I-MIVE [276] | SPECT | Estrogen | Breast cancer | 23 |
P-123I-MBA [277] | SPECT | Sigma | Breast cancer | 12 |
16β-18F-βFMOX [278] | PET | Estrogen | Breast cancer | 12 |
18F-FES [145] | PET | Estrogen | Breast cancer | 51 |
18F-FES [279] | PET | Estrogen | Breast cancer | 11 |
18F-FES [280] | PET | Estrogen | Breast cancer | 16 |
18F-FES [281] | PET | Estrogen | Breast cancer | 40 |
18F-FES [282] | PET | Estrogen | Breast cancer | 43 |
18F-FES [283] | PET | Estrogen | Breast cancer | 47 |
18F-FDHT [284] | PET | Androgen | Prostate cancer | 20 |
18F-FDHT [148] | PET | Androgen | Prostate cancer | 7 |
18F-FDHT [149] | PET | Androgen | Prostate cancer | 7 |
Fig. 3.18
Chemical structures of the steroid-based imaging agents 18F-FES and 18F-FDHT
Another hormone-based radiopharmaceutical, 16β-18F-dihydrotestosterone (18F-FDHT), is currently under investigation as a prostate cancer imaging agent in humans (Fig. 3.18). 18F-FDHT targets androgen receptors (AR) that are overexpressed by aggressive prostate tumors. In a clinical trial conducted at Memorial Sloan-Kettering Cancer Center (New York), seven patients showing signs of metastatic prostate cancer were subjected to 18F-FDHT PET and [18F]FDG-PET scans. Remarkably, the average SUV of multiple lesions for both scans were 5.28 and 5.22, respectively. Furthermore, two patients who received testosterone therapy showed markedly reduced 18F-FDHT uptake at the tumor site [148]. Estimates of normal tissue radiation-absorbed dose from 18F-FDHT administration were also obtained from the same patient base, and a recommended maximum administered activity of 331 MBq 18F-FDHT was proposed [149].
Lipid Metabolism
In addition to upregulated glycolytic activity, tumors are also often characterized by perturbed lipid metabolism. Under normal conditions, the synthesis of triglycerides is the primary cellular mechanism for the long-term storage and transport of energy derived from carbohydrate metabolism. Cancer cells, however, do not maintain substantial energy stores and thus preferentially employ lipid metabolism pathways in the production of essential membrane phospholipids, such as phosphatidylcholine [150]. Consequently, overexpression of fatty acid synthase (FAS) and choline kinase (ChoK)—two enzymes essential for the production of phospholipids—are often seen in malignancies, including lung, colon, breast, ovarian, and prostate cancer [151]. FAS catalyzes the de novo synthesis of fatty acids from malonyl-CoA, a precursor derived from acetic acid (Fig. 3.19) [152]. ChoK is responsible for the synthesis of phosphocholine, a product that eventually converges with the products of FAS activity in the synthesis of the phospholipid phosphatidylcholine.
Fig. 3.19
The transport and metabolic pathways for acetate and choline converge on phosphatidylcholine
Several PET radiotracers have been developed for imaging choline uptake and metabolism. Both 11C and 18F-labeled choline derivatives such as 18F-choline and 18F-fluoroethylcholine have been used to study tumor lipid metabolism (Fig. 3.20) [153–155]. The uptake of these radiotracers is extremely rapid and occurs within the first few minutes post-injection, permitting the use of short-lived radionuclides [153]. It was found that choline metabolism is not significant on this timescale, an observation that suggests that the accumulation of radiotracer is due to elevated rates of choline transport and not the activity of ChoK [156]. This hypothesis was supported by subsequent investigations with 18F-deshydroxycholine, a choline analogue which is not phosphorylated by ChoK. In these experiments, the uptake of 18F-deshydroxycholine closely resembled that of radiolabeled choline at early time-points (<10 min), but differences were more pronounced at later time-points, suggesting differences in irreversible cellular retention due to ChoK activity [157].
Fig. 3.20
PET tracers for studying tumor lipid metabolism
Another radiotracer, [11C]acetate, has also been employed to image lipid metabolism in tumors [158]. In tissues with active oxidative phosphorylation (e.g., myocardial tissue), [11C]acetate is funneled into the Krebs cycle, and within minutes after intravenous injection, the tracer is metabolized and released as [11C]CO2. In tumors, however, the rate of oxidative metabolism is reduced. In this case, [11C]acetate accumulates steadily within the malignant tissue [159], indicating the prominent use of acetate in the synthesis of fatty acids and lipids. Indeed, direct correlation between [11C]acetate uptake and FAS expression in tumors was observed in animal models [160]. It is unlikely, though, that lipid synthesis is the only reason for the rapid uptake of acetate, as the use of FAS inhibitors failed to completely suppress radiotracer uptake [160].
PET imaging of lipid metabolism is most often used as a diagnostic tool in prostate, breast, and brain tumors (Fig. 3.21) [161]. In prostate cancer imaging, for example, choline-based PET radiotracers offer several important advantages over conventional [18F]FDG-PET, which can often give false-negative results due to the low metabolic rates of prostate tumors [162]. For instance, in comparison to [18F]FDG, the activity of [11C]choline—and, to a lesser extent, 18F-choline—in urine is dramatically reduced, leading to decreased background from bladder activity, allowing better delineation of tumors in the pelvic region [154]. In practice, however, the apparent advantages of [11C]choline versus [18F]FDG-PET imaging for staging prostate cancer have not been widely accepted due to weak correlations with the Gleason scoring method [163]. In addition, newly diagnosed prostate cancer shows a strong inverse correlation between antihormonal therapy and choline uptake; [163] after radical prostatectomy or radiotherapy, this correlation becomes less apparent [164]. Further examples of the use of radiotracers in prostate imaging can be found in Chap. 21.
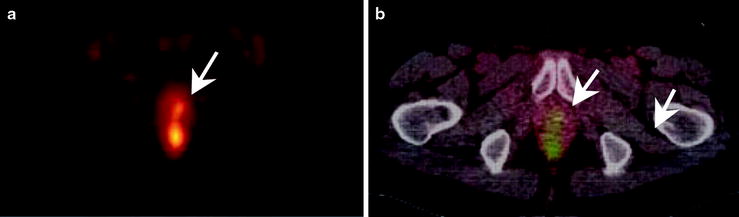
Fig. 3.21
An example of a [11C]acetate PET scan showing (a) focal hyperactivity in the prostate bed and (b) the fused imaging with the corresponding CT. Note the small, focal hyperactivity (arrows)
Amino Acid Transport
Amino acids are too polar for passive diffusion through the cell membrane, and as such, mammalian cells have developed a set of specialized transporters for the uptake of these important building blocks. Thirteen major amino acid transporters have been identified to date, and these can be subdivided into two groups: sodium-dependent (ASC and A) and sodium-independent (L) transporters (Fig. 3.22) [165]. The activity of the ASC- and A-type transporters depends on the transmembrane sodium gradient, with the enzymes transporting sodium ions along with their amino acid cargo. In contrast, L-type transporters act by exchanging one amino acid for another and are thus free of any sodium dependence. Regardless of their mechanism, amino acid transporters are ubiquitous in many proliferating tissues [166], and tumors often exhibit dramatically elevated levels of expression compared with normal tissue [167]. Indeed, the production of both the A and L families of transporters has been found to be upregulated in certain cancer cell lines. The activity of A-type transporters has shown a positive correlation with cell growth in many cell types, including virally transduced cells [168]. Likewise, histological data on L-transporter expression was found to correlate with poor prognosis in patients with gliomas [169] and transitional cell carcinomas [170].
Fig. 3.22
Principal mechanisms of the amino acid transport. ASC transporters move one molecule of amino acid and Na+ ion inside the cell for each amino acid moved outside the cell (sodium dependent, active transport). L transporters move one amino acid inside the cell for every one amino acid moved outside the cell (passive transport along the concentration gradient). A transporters move one amino acid inside the cell along with one Na+ ion (sodium dependent, active transport)
Given these correlations, a number of PET radiotracers have been developed to probe the expression of amino acid transporters in tumors (Fig. 3.23). The small size of these molecules and rapid kinetics favors the use of short-lived isotopes, and thus most studies have been conducted using 11C and 18F. The short half-life of these radionuclides is actually beneficial, because imaging at early time-points reduces the contribution of catabolic and anabolic pathways to the background activity [171]. This idea was reinforced by a comparison between the in vivo behavior of the radiotracers and their analogs modified to preclude biological transformations [172]. A recent review by Plathow et al. provides a comprehensive overview of radiolabeled amino acids for PET imaging [173].
Fig. 3.23
PET and SPECT radiotracers based on the amino acids: l-[11C]-Tyr, l-[123I]-IMT, l-[18F]-FET, [18F]-l-DOPA, [11C]-MET, [11C]-MeAIB, [11C]-ACBC, and [18F]-FACBC
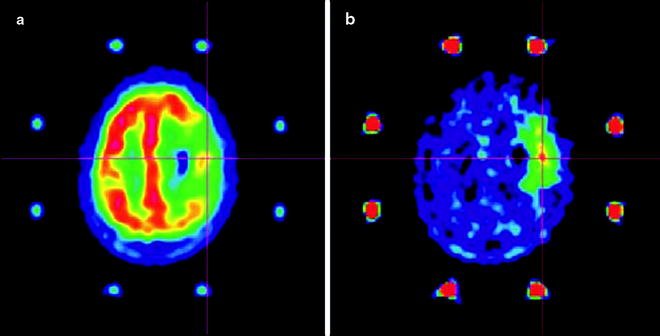
One radiolabeled nonnatural amino acid—[11C]methylaminoisobutyric acid, commonly known as [11C]MeAIB—has been shown to be a specific agent for imaging the activity of A transporters [174]. Despite uptake in various normal tissues, including the salivary glands and pancreas [175], [11C]MeAIB was found to accumulate in lymphomas and head and neck malignancies with low renal excretion [176]. In contrast, the possibility of a specific radiotracer for L transporter activity is precluded by the broad range of amino acids translocated by these proteins. L transporters have been identified as the main conduits by which l-(methyl-[11C])-methionine ([11C]MET) [177], radiolabeled tyrosine/phenylalanine analogs [178], 1-aminocyclobutane-1-[11C]carboxylic acid ([11C]ACBC), and 1-amino-3-18Ffluorocyclobutylcarboxylic acid (18F-FACBC) [179] accumulate in cells. The lack of specificity of the L transporters is thought to be responsible for the similarities observed in the biodistribution profiles of radiolabeled methionine analogues with tyrosine analogs 123I-α-methyl-l-tyrosine (123I-IMT) [180] and 3,4-dihydroxy-6-[18F]fluoro-l-phenylalanine ([18F]L-DOPA) [172].
In the clinic, radiolabeled amino acid analogues show high background uptake in the liver, pancreas, and intestines [181], and tissues which are infected or inflamed often display high accumulation of activity [182]. With the exception of [11C]MET [183] and 18F-FACBC [184], which have both been employed in the delineation of prostate cancer, amino acid radiotracers have had limited clinical impact in cancers of the ventral cavity, primarily because their uptake and sensitivity is less favorable than that of [18F]FDG [185]. However, amino acid radiotracers have found widespread application in brain tumor imaging. This is primarily due to the limitations of [18F]FDG-PET in brain imaging: glucose metabolism of the brain is persistently high, resulting in high cerebral uptake of [18F]FDG and low tumor-to-background ratios (vide supra) [186]. A comparison of [11C]MET with [18F]FDG uptake in glioblastoma clearly demonstrates the efficacy of using amino acid-based radiotracers in neurological cancer imaging (Fig. 3.24) [187].