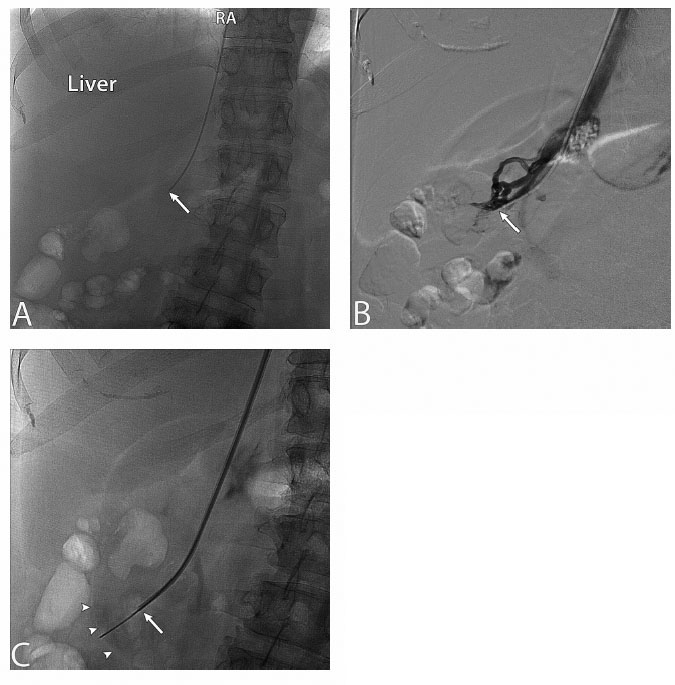
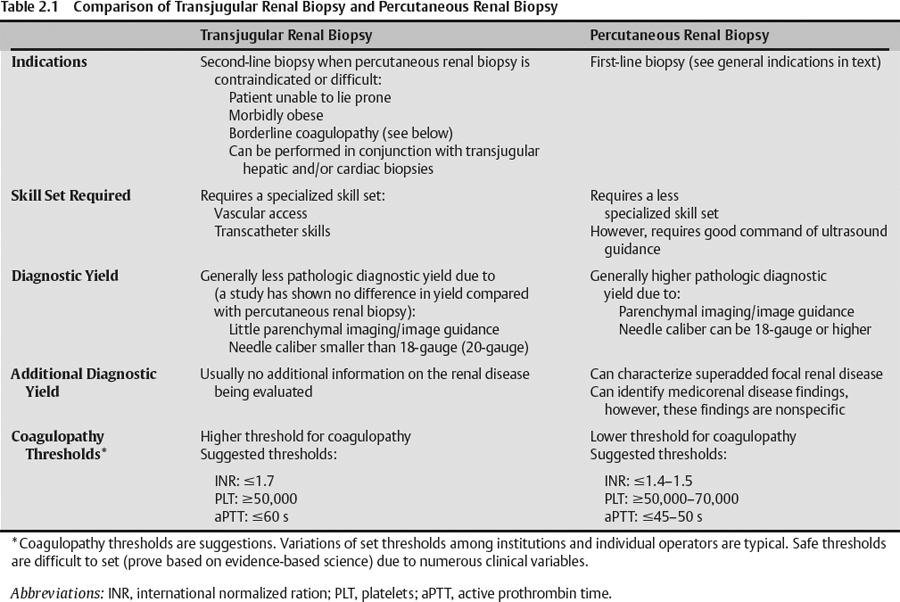
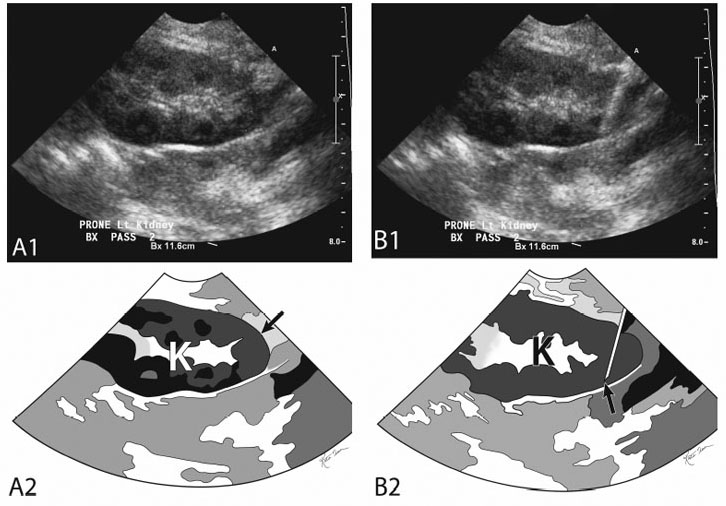
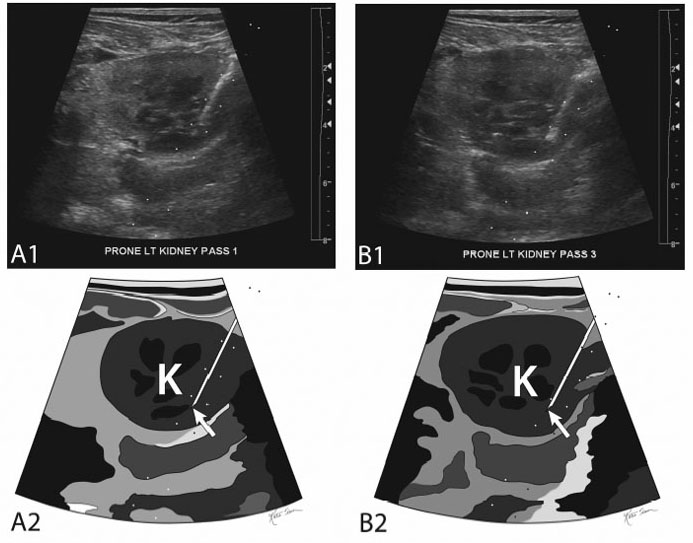
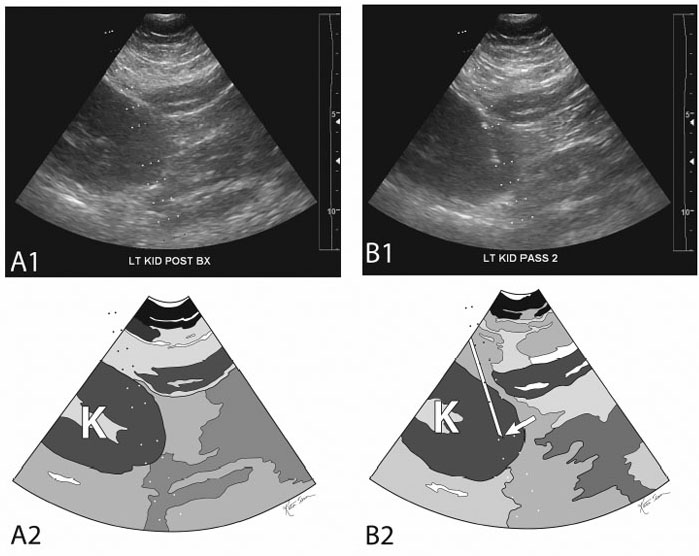
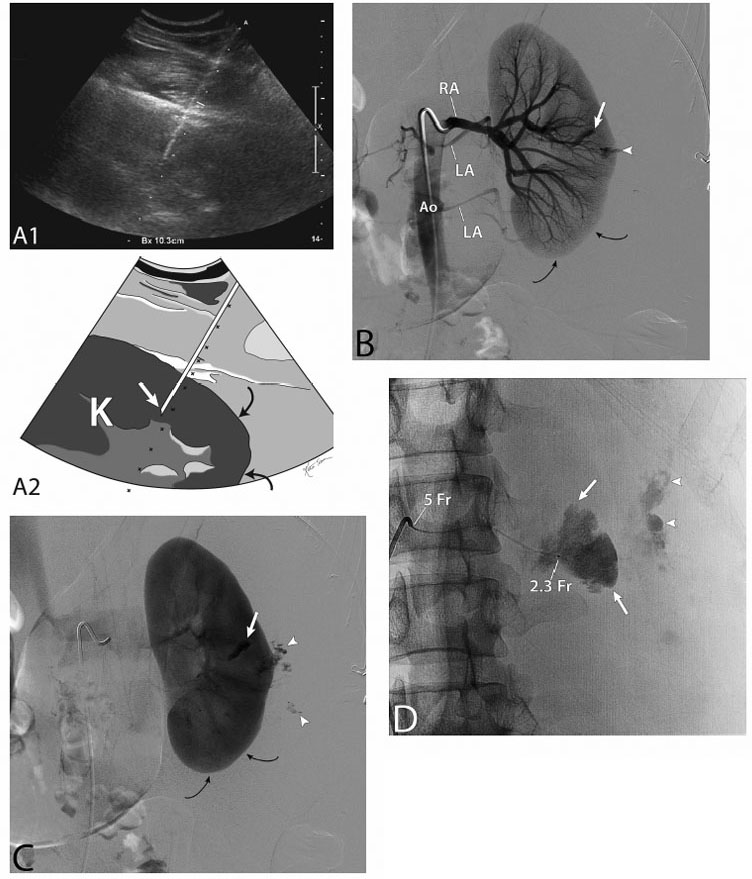
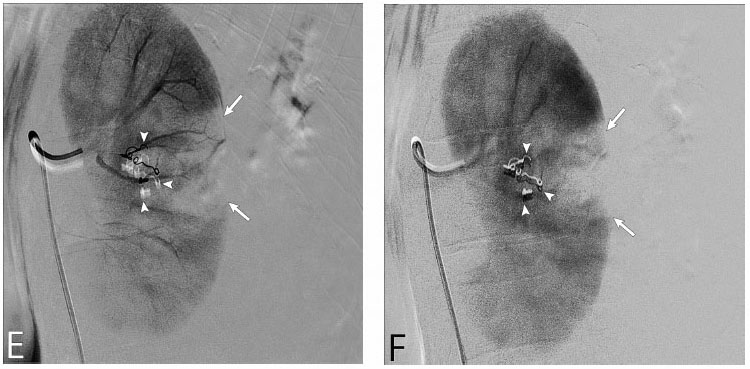
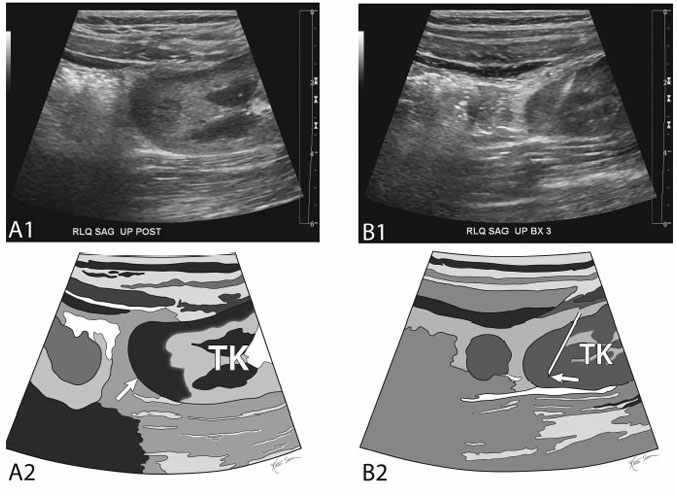
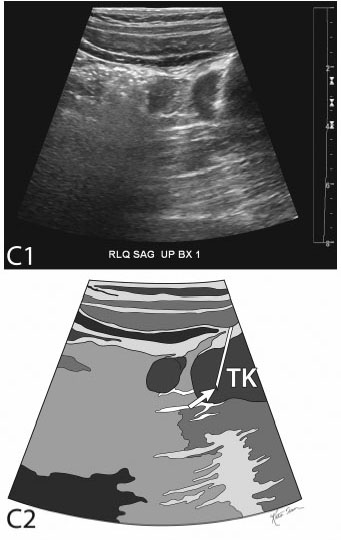
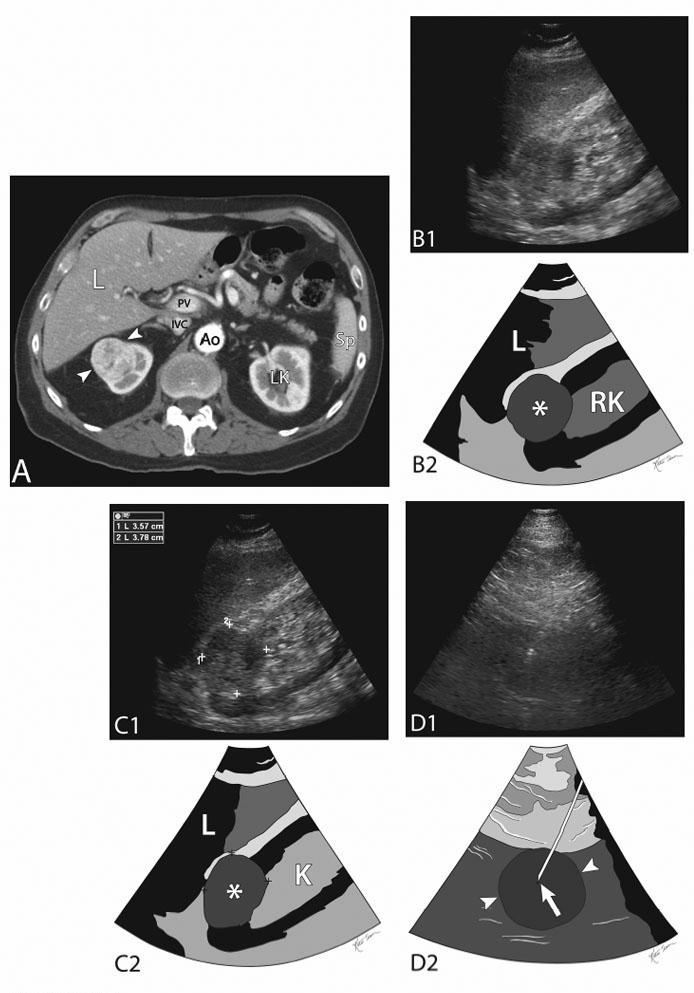
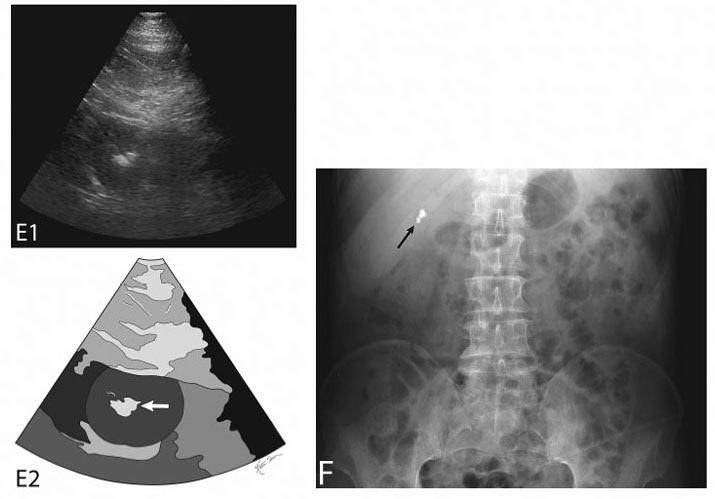
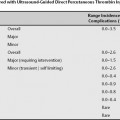
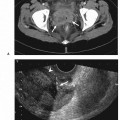
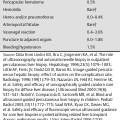
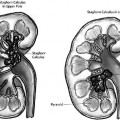
2 Renal Biopsy Kidney biopsies are classified into random renal biopsies and target-specific renal lesion biopsies. A random renal biopsy is a kidney tissue sample that is obtained to evaluate diffuse kidney disease (medicorenal disease) such as There are two types of random renal biopsies (Table 2.1): Fig. 2.1 (A) Fluoroscopic image during a transjugular renal biopsy. The catheter tip (arrow) is in the right renal vein. The hepatic (Liver) shadow is seen above it. The catheter has been passed down (in order): the right jugular vein, the superior vena cava, the right atrium (RA), the inferior vena cava, and the right renal vein. (B) Image from a digital subtraction venogram of the right renal vein. The catheter tip (arrow) is in the renal vein. The venogram is for documentation that the catheter is actually in the renal vein and not another vein such as a right hepatic vein. An accessory right hepatic vein is more cephalad than the main right hepatic vein and may be thought to be a renal vein especially if venography is not performed. (C) Fluoroscopic image during a transjugular renal biopsy. The 20-gauge needle has been passed down its metal introducer sheath (so not to injure adjacent structures). The arrow is at the tip of the metal-coated introducer sheath. The semiautomatic needle has been passed and then “fired” from the metal introducer sheath tip (arrow) toward and reaching the renal capsule (arrowheads). Remember that the cortex needs to be sampled and so the needle should be passed to the capsule. Fig. 2.2 Common setup/layout for random parenchymal renal biopsy. (A) Gray-scale ultrasound image of the left kidney (K) (top) and schematic sketch of it (bottom). The transducer is long on the left kidney and is clearly visualizing the lower pole of the kidney (arrow). The needle is to be guided to sample the lower pole of the kidney and slanted toward the renal sinus. This is a common layout for a random renal biopsy. (B) Ultrasound image of the left kidney (K) (top) and sketch of same (bottom). The transducer is long on the left kidney and is clearly visualizing the lower pole of the kidney. An 18-gauge biopsy needle has been passed through the lower pole of the kidney (arrow at needle tip). Fig. 2.3 Obliqued random parenchymal renal biopsy. (A) Ultrasound image of the left kidney (top) and sketch of same (bottom). The transducer is obliqued (midway between long and transverse) on the lower pole of the left kidney. An 18-gauge biopsy needle has been passed through the lower pole of the kidney (arrow at needle tip). (B) Gray-scale ultrasound image of the left kidney (K) (top) and schematic sketch of it (bottom). The transducer is obliqued (midway between long and transverse) on the lower pole of the left kidney. Another 18-gauge biopsy needle has been passed through the lower pole of the kidney (arrow at needle tip). Fig. 2.4 Random parenchymal renal biopsy with needle directed away from the renal sinus. (A) Ultrasound image of the left kidney (K) (top) and sketch of same (bottom). The transducer is long on the left kidney and is clearly visualizing the lower pole of the kidney. The needle is to be guided to sample the lower pole of the kidney and slanted away from the renal sinus. The operators who use this technique (needle directed away from the renal sinus) feel that this is safer as the needle is directed away from the larger vessels in the center of the kidney. (B) Ultrasound image of the left kidney (K) (top) and sketch of same (bottom). The transducer is long on the left kidney and is clearly visualizing the lower pole of the kidney. An 18-gauge biopsy needle has been passed through the lower pole of the kidney (arrow at needle tip) directed away from the renal sinus. Fig. 2.5 Random parenchymal renal biopsy complicated by bleeding. (A) Ultrasound image of the left kidney (K) (top) and sketch of same (bottom). An 18-gauge biopsy needle has been passed through the midportion of the kidney (arrow at needle tip) directed at the renal sinus. The needle is not passing through the lower pole of the kidney (between curved arrows). Needle passage directed at the midportion of the kidney reduces the likelihood of obtaining a cortex dominant sample (which is required) due to a relatively thinner cortex in the midportion of the kidney. In addition, inadvertent deep passage of the needle in the midportion of the kidney may increase the likelihood of injuring a larger renal sinus vessel. The patient bled after the renal biopsy, dropping hematocrit and having a subcapsular hematoma. The patient was taken to the angiography suite to evaluate for the source of bleeding with possible embolization of the vessels. (B) Digitally subtracted arteriogram of the left kidney through a 5-French SOS catheter during the late arterial phase. The arteriogram demonstrates extravasation of contrast (bleeding) where the biopsy was taken (arrowhead). In addition, a stagnant linear collection of contrast is seen signifying a second site of bleeding (arrow). The two curved black arrows point to the lower pole where the biopsy should have been taken (RA, renal artery; LA, lumbar artery(ies); Ao, aorta). (C) Digitally subtracted arteriogram of the left kidney during the nephrogram phase. Again noted is the extravasation of contrast (bleeding) where the biopsy was taken (arrowheads). In addition, the stagnant linear collection of contrast is seen signifying the second site of bleeding (arrow). The two curved black arrows point to the lower pole where the biopsy should have been taken. (D) Super-selective arteriogram of the left kidney segment in the midportion of the left kidney utilizing a 2.3-French (2.3Fr) microcatheter passed coaxially through the 5-French SOS catheter (5 Fr). The renal segment stains with contrast (between arrows) and the pooling of contrast (bleeding) is again seen (arrowheads). (E) Digitally subtracted arteriogram of the left kidney during the late arterial phase after embolization utilizing microcoils (arrowheads). There is a wedge-shaped segmental infarct (between coils and arrows) correlating with the wedge-shaped super-selective angiogram in Fig. 2.5D. No bleeding is identified. (F) Digitally subtracted arteriogram of the left kidney during the nephrogram phase after embolization utilizing microcoils (arrowheads). There is a wedge-shaped segmental infarct (between coils and arrows) correlating with the wedge-shaped super-selective angiogram in Fig. 2.5D. No bleeding is identified. Fig. 2.6 Random parenchymal renal biopsy of a transplanted kidney in the right lower quadrant. (A) Ultrasound image of the transplanted right lower quadrant kidney (TK) (top) and sketch of same (bottom). The transducer is long on the transplanted kidney and is clearly visualizing the lateral pole of the kidney (arrow). In transplanted kidneys that usually lie across (transversely) in the abdomen, the poles are usually referred to medial and lateral. Avoiding the small bowel and the iliac vessels are the major concerns for this biopsy. (B) Ultrasound image of the transplanted right lower quadrant kidney (TK) (top) and sketch of same (bottom). The transducer is long on the transplanted kidney and is clearly visualizing the lateral pole of the kidney (arrow). An 18-gauge biopsy needle has been passed through the lateral pole of the kidney (arrow at needle tip) directed away from the renal sinus. (C) Ultrasound image of the transplanted right lower quadrant kidney (TK) (top) and sketch of same (bottom). The transducer is long on the transplanted kidney and is clearly visualizing the lateral pole of the kidney (arrow). Another 18-gauge biopsy needle has been passed through the lateral pole of the kidney (arrow at needle tip) directed away from the renal sinus. A renal lesion biopsy is a kidney tissue sample that is obtained to evaluate a specific focal kidney lesion such as ( Fig. 2.7 ): Fig. 2.7 Upper pole right renal mass biopsy. (A) Contrast-enhanced computed tomography (CT) scan of the abdomen demonstrating an enhancing heterogeneous mass (between arrowheads) in the upper pole of the right kidney. (L, liver; LK, left kidney; Ao, aorta; IVC, inferior vena cava; PV, portal vein; Sp, spleen) (B) Ultrasound image of the right kidney (RK) (top) and sketch of same (bottom). The transducer is long on the right kidney and visualizes the upper pole mass (asterisk in center of mass). The sonographer is utilizing the liver (L) as an acoustic window. This explains the clarity of the image. When actually performing the procedure/biopsy the use of the liver as a sonographic window is usually not feasible and thus the images during the biopsy may be less clear (Figs. 2.7D and 2.7E). (C) Ultrasound image of the right kidney (top) and sketch of same (bottom). The transducer is long on the right kidney and visualizes the upper pole mass (asterisk in center of mass). The sonographer is utilizing the liver (L) as an acoustic window. This explains the clarity of the image. When actually performing the procedure/biopsy the use of the liver as a sonographic window is usually not feasible and thus the images during the biopsy may be less clear (Figs. 2.7D and 2.7E). (D) Ultrasound image of the right kidney mass (top) and sketch of same (bottom
Classification
Random Renal Biopsy
Target-selected Renal Biopsy/Renal Lesion Biopsy
![]()
Stay updated, free articles. Join our Telegram channel

Full access? Get Clinical Tree


