(1)
Department of Medical Imaging, Linkou Chang Gung Memorial Hospital, Taoyuan, Taiwan
(2)
Department of Medical Imaging and Radiological Sciences, Institute of Radiological Research Chang Gung University, Taoyuan, Taiwan
3.1 Renal Simple Cyst: Bosniak’s Category I
Case 1
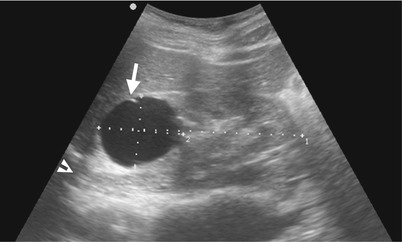
Fig. 3.1
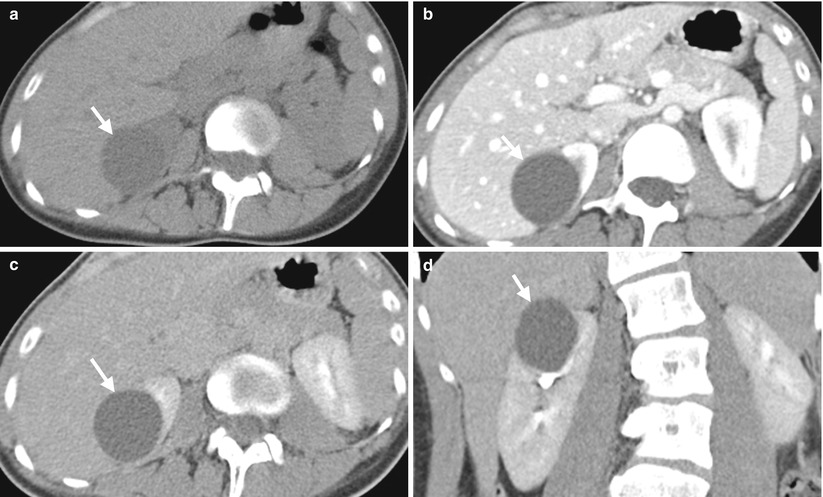
Fig. 3.2
Renal ultrasound (US) and computed tomography (CT) show imaging features of a renal simple cyst. Figure 3.1, right renal US shows an anechoic mass (arrow) with smooth wall and posterior enhancement (arrowhead), compatible with a simple cyst. Figure 3.2a, axial unenhanced CT image shows a low-density lesion of water density (arrow) at the right kidney. Figure 3.2b, axial enhanced CT image at corticomedullary phase shows no contrast enhancement of this cystic lesion (arrow) which has no discernible wall. Figure 3.2c, axial enhanced CT image at excretory phase shows absence of enhancement and calcification of this cystic lesion (arrow). Figure 3.2d, coronal enhanced CT image at excretory phase shows a well-defined appearance of this cystic lesion (arrow) without enhancement.
Key Diagnostic Features
Renal simple cysts are diagnosed by imaging appearances of a cystic lesion with no wall or very thin wall, no internal enhancement, no septum, and no calcifications. A cystic lesion means a lesion with water content. Therefore, renal cysts present as anechoic masses on ultrasound. On computed tomography (CT), renal cysts appear with a water density of 0–20 Hounsfield units. On magnetic resonance imaging (MRI), cystic lesions show low signal intensity on T1-weighted images (T1WI) and high signal intensity on T2-weighted images (T2WI). Renal simple cysts show no contrast medium enhancement on either CT or MRI. According to renal cystic masses proposed by Bosniak, renal simple cysts are category I lesions, which are virtually all benign and have no need of further studies or follow-up [1].
3.2 Renal Cystic Masses of Bosniak’s Category II
Case 2
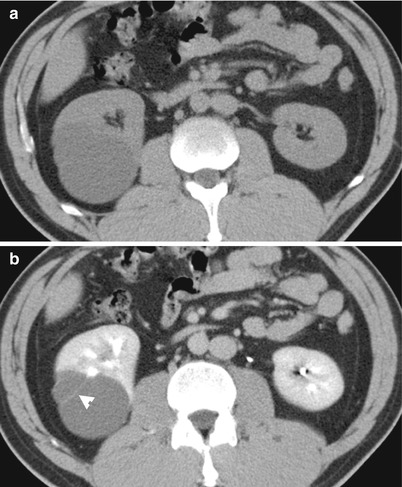
Fig. 3.3
Renal computed tomography (CT) shows imaging features of a Bosniak II cystic mass with thin septum. Figure 3.3a, unenhanced axial CT image shows a lesion of low density (relative to water density) at the right kidney with barely seen septa. Figure 3.3b, enhanced axial CT image shows a cystic lesion having a hair-thin septum (arrowhead). A right renal cyst of Bosniak’s category II is considered on CT.
Case 3
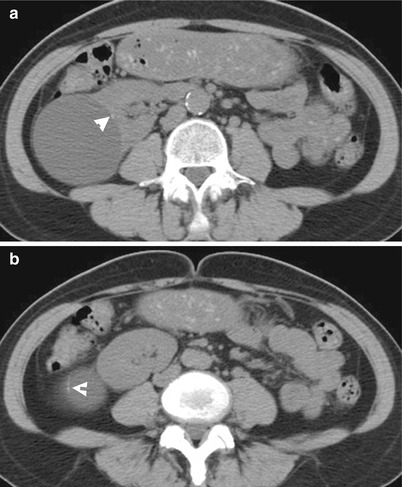
Fig. 3.4
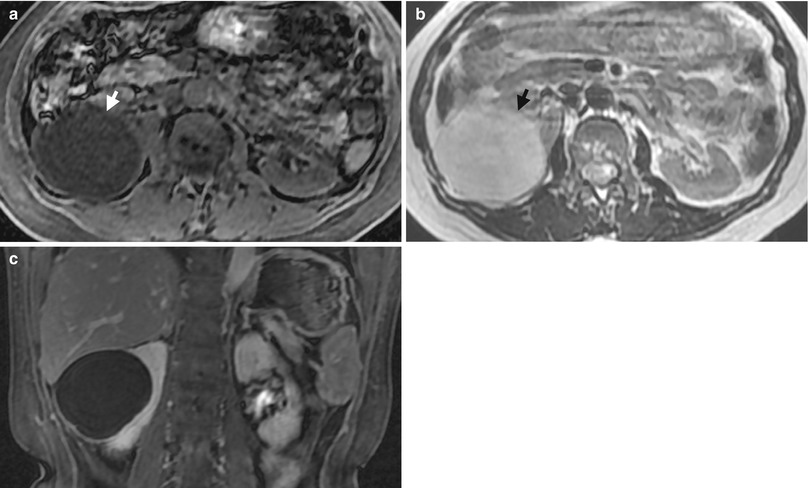
Fig. 3.5
Renal computed tomography (CT) and magnetic resonance imaging (MRI) show an imaging finding of a Bosniak II cystic mass with thin calcifications. Unenhanced axial renal CT images (Fig. 3.4a, b) show pencil-thin calcifications (arrowheads) at medial (Fig. 3.4a) and lateral walls (Fig. 3.4b) of a right renal cyst at lower pole, respectively. Unenhanced axial T1 fat-suppressed (T1FS) image (Fig. 3.5a), unenhanced axial T2-weighted image (Fig. 3.5b), and enhanced coronal T1 fat-suppressed image (Fig. 3.5c) show this cystic lesion (arrows) having thin wall and no internal enhancement. However, the thin calcified foci could not be recognized on MRI. A renal cyst of Bosniak’s category II is considered based on CT findings.
Case 4
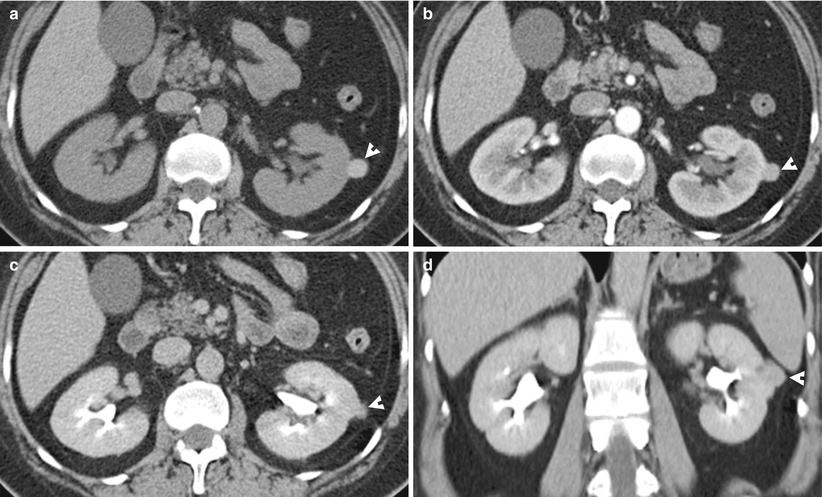
Fig. 3.6
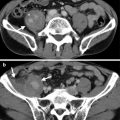
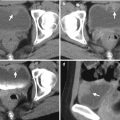
Renal computed tomography (CT) shows imaging findings of a Bosniak II cystic mass with hemorrhage. Unenhanced axial renal CT image (Fig. 3.6a) shows a small hemorrhagic nodule (arrowhead) with the left kidney of exophytic appearance. Enhanced axial image of corticomedullary phase (Fig. 3.6b), enhanced axial CT image of excretory phase (Fig. 3.6c), and enhanced coronal CT image of excretory phase (Fig. 3.6) show no contrast enhancement of this hemorrhagic nodule. A renal hemorrhagic cyst classified as Bosniak’s category II is impressed on CT.
Key Diagnostic Features
Renal cystic masses are categorized by their imaging appearances which help in the assessment of the probability of a benign or malignant nature as well as in selections for follow-up and treatment. This category system is based on imaging appearances on computed tomography (CT) [1, 2]. However, similar principles could be applied to magnetic resonance imaging [2]. On CT, Bosniak’s category II cysts are characterized by the presence of a thin septum and minimal or focally thickened calcification but with no measureable contrast enhancement [2]. A high-density cyst on unenhanced CT (higher than 20 Hounsfield units) without measurable enhancement and smaller than 3 cm or with exophytic growth is categorized as a Bosniak II cyst [2]. The majority of Bosniak II cysts are benign in nature. They do not require surgery and there is usually no need for a follow-up.
3.3 Renal Cystic Masses of Bosniak’s IIF Category
Case 5
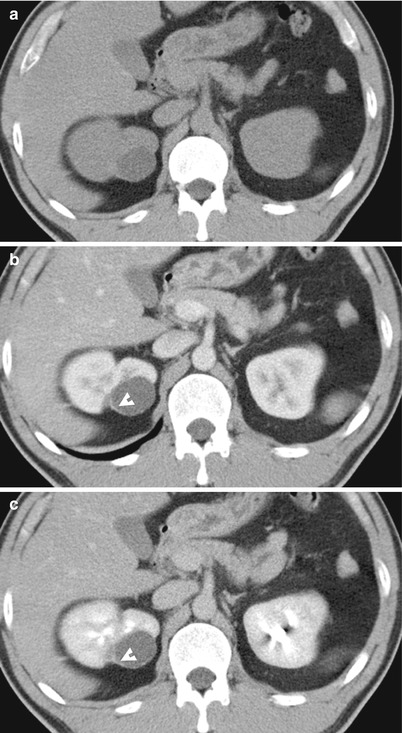
Fig. 3.7
Renal computed tomography (CT) shows imaging features of a Bosniak IIF cystic mass. Unenhanced axial (Fig. 3.7a) and enhanced axial images of corticomedullary phase (Fig. 3.7b) and enhanced axial image of excretory phase (Fig. 3.7c) show a low-density lesion (identical to water density) at the right kidney as a renal cystic mass. There is focally minimal thickening of its wall with smooth appearance (arrowheads), and a Bosniak IIF category cyst is considered.
Case 6
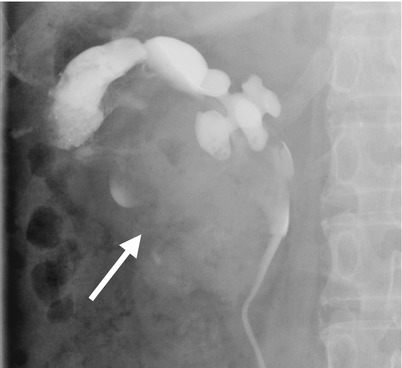
Fig. 3.8
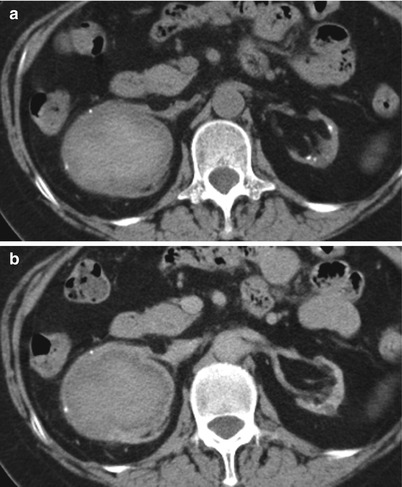
Fig. 3.9
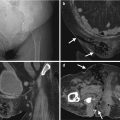
Right retrograde pyelography (RP) and renal computed tomography (CT) show a Bosniak IIF cystic mass with hemorrhage and calcifications in a patient with end-stage kidney disease. Figure 3.8, right RP shows a space-occupying lesion (arrow) with mass effect on the right renal pelvicalyceal system. Figure 3.9a, unenhanced axial renal CT images show a right renal cystic lesion with central high-density area which is measured as 65 Hounsfield units. Two small calcifications at the periphery of this lesion are noted. This lesion is measured as 6.0 cm in diameter. Figure 3.9b, enhanced axial renal CT image shows no contrast enhancement of this lesion. A hemorrhagic cyst of Bosniak’s IIF category is impressed on CT, which is proved by subsequent surgery.
Key Diagnostic Features
The F in Bosniak’s IIF category emphasizes the need for follow-up in these lesions. Renal cystic masses of Bosniak’s IIF category are characterized by mild but smooth thickening of the septum or wall, increased number of septum, or thick and nodular calcifications [2]. A non-enhancing high-density cyst larger than 3 cm or of complete intrarenal location is also categorized as Bosniak’s IIF lesion. About one-fourth of Bosniak’s IIF lesions are malignant [3]. However, there is no consensus of the duration of their follow-up time [1].
3.4 Renal Cystic Masses of Bosniak’s Category III
Case 7
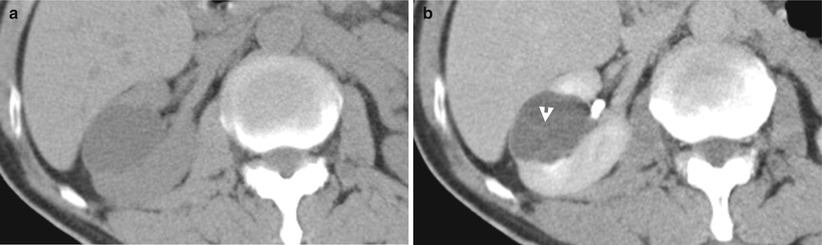
Fig. 3.10
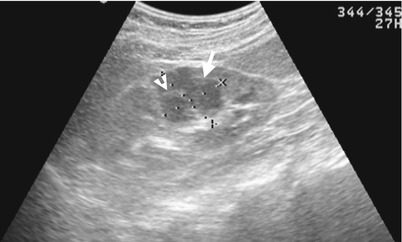
Fig. 3.11
Renal computed tomography (CT) and ultrasound show a Bosniak III cystic mass. Unenhanced axial (Fig. 3.10a) and enhanced axial images of excretory phase (Fig. 3.10b) on CT show a right renal cystic mass. Multiple septa with thickening and irregular appearances (arrowhead) in this cystic mass are shown after contrast medium administration. Figure 3.11 Right renal ultrasound reveals a predominantly anechoic mass (arrow) with irregularly thickened septa (arrowhead) of the right kidney. This cystic mass is categorized as Bosniak III due to the presence of an irregular and thickened septa.
Case 8
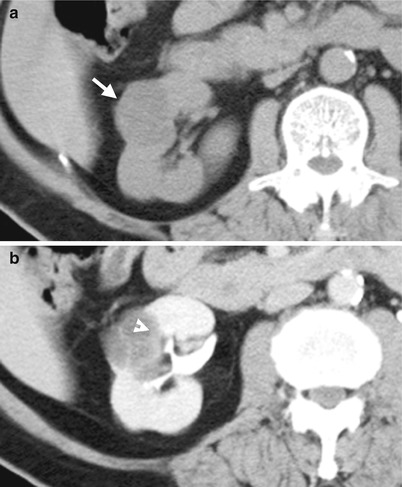
Fig. 3.12
Right computed tomography (CT) shows a Bosniak III cystic mass which proves to be a cystic renal cell carcinoma (RCC). Figure 3.12a, unenhanced axial CT image shows a cystic mass (arrow) of the right kidney. Figure 3.12b, enhanced axial CT image shows clear visualization of the septa in the right renal cystic mass after contrast medium enhancement. There is irregularly thickened wall (arrowhead) of this renal cystic mass, suggesting a Bosniak III cystic mass. Histological examination of left partial nephrectomy reveals a cystic RCC.
Case 9
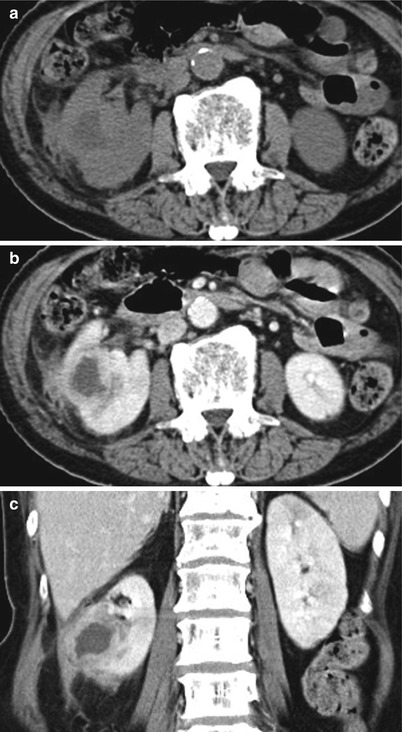
Fig. 3.13
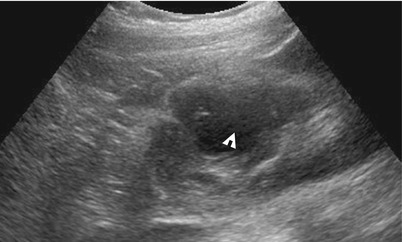
Fig. 3.14
Renal computed tomography (CT) and ultrasound show a Bosniak III cystic mass, proved as a renal abscess. Unenhanced axial (Fig. 3.13a), enhanced axial (Fig. 3.13b), and enhanced coronal (Fig. 3.13c) CT images show a cystic mass with irregular and thickened wall of the right kidney. Note obvious right perinephric stranding adjacent to this renal cystic mass. Right renal ultrasound (Fig. 3.14) shows an echo-free mass with irregular wall (arrowhead) of the right kidney. A right renal cystic mass of Bosniak’s category III is classified by its picture and a right renal abscess is emphasized, which is subsequently supported by a positive result of bacteria in a urine culture.
Key Diagnostic Features
Renal cystic masses of Bosniak’s III are indeterminate whether benign or malignant in nature on images [2]. On images, they are characterized by enhanced irregular thickening of the septa or wall or multiloculated appearance by a complex septa [1, 2]. About half of Bosniak III lesions are malignant tumors, such as cystic necrotic renal cell carcinoma (RCC), multilocular cystic RCC, and cystic papillary RCC [3]. Benign lesions such as multiloculated cysts, multiloculated cystic nephroma, infected cyst, or abscess could appear as Bosniak III lesion on CT. Therefore, surgical exploration is the general principle for treating Bosniak III lesions.
3.5 Renal Cystic Masses of Bosniak’s Category IV
Case 10
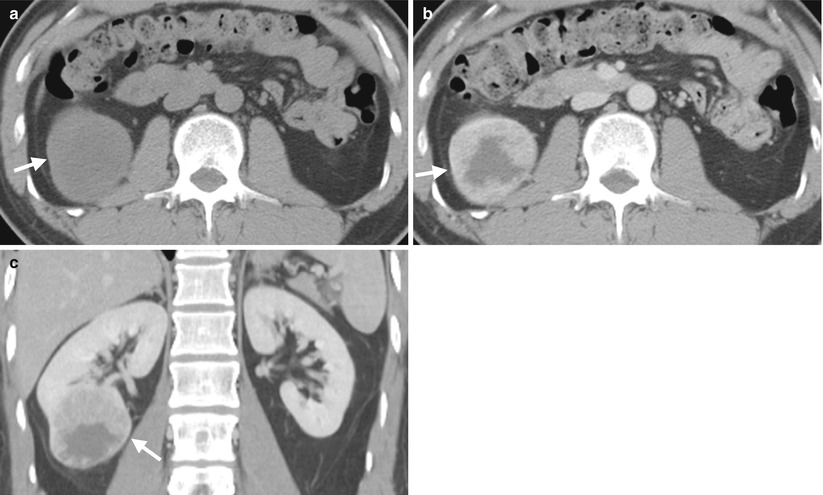
Fig. 3.15
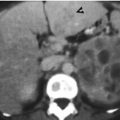
Renal computed tomography (CT) shows a Bosniak IV cystic mass, proved as cystic renal cell carcinoma (RCC). Unenhanced axial (Fig. 3.15a), enhanced axial (Fig. 3.15b), and enhanced coronal (Fig. 3.15c) CT images show a cystic mass (arrow) with obvious enhancing soft tissue part of the right renal lower pole, suggestive of a Bosniak IV cystic mass. Cystic RCC is considered on CT.
Case 11
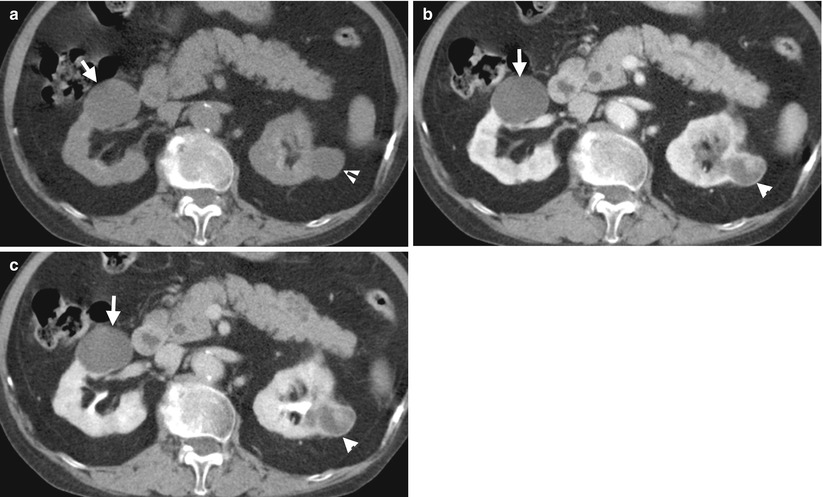
Fig. 3.16
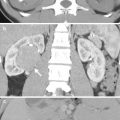
Right computed tomography (CT) shows a renal cell carcinoma (RCC) appearing as a Bosniak IV cystic mass. Figure 3.16a, unenhanced axial CT image shows one cystic mass (arrow) at the right kidney and another (arrowhead) at the left kidney. Faint calcifications of bilateral renal medullary papilla are depicted as well. Figure 3.16b, enhanced axial CT image of corticomedullary phase shows an enhancing solid part in the left renal cystic mass (arrowhead), representing a Bosniak IV lesion. The right renal cystic mass (arrow) shows a simple cyst appearance. Figure 3.16c, enhanced axial CT image of excretory phase shows persistent enhancement of the solid part of left renal Bosniak IV lesion, suggestive of a malignant neoplasm as RCC. In contrast, no enhancing soft tissue part, no wall thickening, and no septa of the right renal cystic lesion suggest a Bosniak I lesion. The patient undergoes left radical nephrectomy, and histological examination of the left renal cystic lesion reveals an RCC having a cystic appearance with a solid part.
Key Diagnostic Features
Renal cystic masses of Bosniak’s category IV suggest a clearly malignant neoplasm [1]. On images, they are characterized by one or more enhanced soft tissue parts in the cystic mass, which are adjacent to or independent of the walls or septa [1]. As Bosniak IV lesions are considered as malignancy, removal of the mass by surgery is necessary [1].
3.6 Renal Hemorrhagic Cysts
Case 12
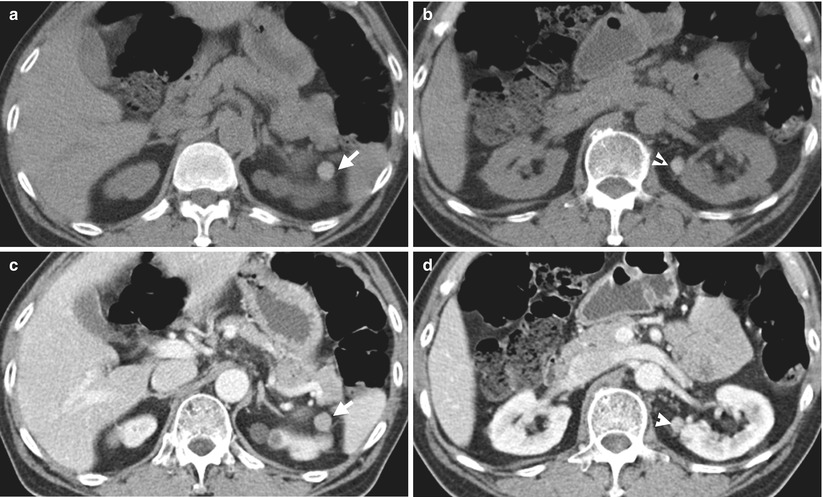
Fig. 3.17
Renal computed tomography (CT) and ultrasound (US) show hemorrhagic cysts of the left kidney. Unenhanced axial CT images (Fig. 3.17a, b) show one hemorrhagic cyst (mean density: 79 Hounsfield units) at the left renal upper pole and another hemorrhagic cyst (mean density: 101 Hounsfield units) at the medial part of the left renal midportion. Both renal hemorrhagic cysts have exophytic appearances. Enhanced axial CT images (Fig. 3.17c, d) show no contrast enhancement of both hemorrhagic cysts (arrow and arrowhead).
Case 13
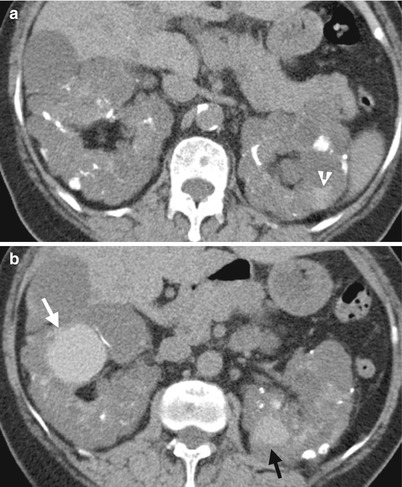
Fig. 3.18
Renal computed tomography (CT) shows imaging findings of hemorrhagic cysts of both kidneys. Unenhanced renal axial CT image (Fig. 3.18a) shows a left hemorrhagic cyst with a layering appearance (arrowhead). The hematoma is in the dependent part of the left hemorrhagic cyst. Unenhanced renal axial image (Fig. 3.18b), 1 cm caudal to Fig. 3.18a, shows a hemorrhagic cyst (white arrow) at the right kidney. There is another hemorrhagic cyst (black arrow) at the left kidney. Both hemorrhagic cysts are confined in the kidneys. Both kidneys are enlarged with multiple cysts, consistent with polycystic kidney disease.
Case 14
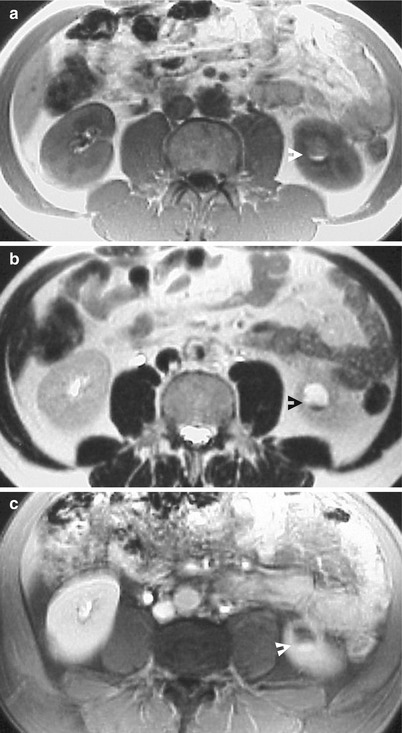
Fig. 3.19
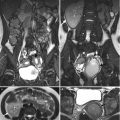
Renal magnetic resonance imaging (MRI) shows imaging findings of a left renal hemorrhagic cyst. Unenhanced T1-weighted image (Fig. 3.19a) and T2-weighted image (Fig. 3.19b) as well as enhanced T1 fat-suppressed image (Fig. 3.19c) show a hemorrhagic cyst (arrowheads) with layering appearance of the left kidney. The hematoma of intracellular deoxyhemoglobin stage in this hemorrhagic cyst appears having high signal intensity on T1-weighted image and low-signal intensity on T2-weighted image in its dependent part.
Key Diagnostic Features
Renal cysts complicated with a hemorrhagic episode are common, especially in patients with autosomal dominant polycystic kidney disease (ADPKD). On computed tomography (CT), renal hemorrhagic cysts having acute hematomas is typically of high density (higher than 60 Hounsfield units) on unenhanced images with no additional enhancement after contrast medium enhancement. However, the density of hematomas in hemorrhagic cysts decreased over time on unenhanced CT image and shows no persistent contrast enhancement on enhanced CT images. Renal hemorrhagic cysts also appear as a cystic mass with fluid-fluid level, and the hematomas are in the dependent parts of the cysts. On magnetic resonance images, hematomas appear as a variety of signal intensities depending on its stages and pulse sequences. Hematomas of intracellular deoxyhemoglobin stage appear as having high signal intensity on T1-weighted image (T1WI) and low signal intensity on T2-weighted image (T2WI). Hematomas of extracellular deoxyhemoglobin stage appear as having high signal intensities on both T1WI and T2WI. Chronic hematomas of hemosiderin stage in renal hemorrhagic cysts show low signal intensity appearances on both T1WI and T2WI. Similar to CT, a cystic lesion with internal hemorrhage shows no enhancement after contrast administration, suggesting a hemorrhagic cyst rather than a hemorrhagic neoplasm.
Main Differential Diagnosis
1.
Renal hemorrhagic neoplasms
Some renal neoplasms such as renal angiomyolipomas and renal cell carcinomas are more prone to hemorrhage than renal neoplasms of other histological types. Renal hemorrhagic neoplasms could show similar densities or signal intensities as those of renal hemorrhagic cysts on CT and MRI, respectively. Nonetheless, the presence of one or more enhancing soft tissue nodules inside a renal hemorrhagic mass suggests the diagnosis of renal hemorrhagic neoplasm. This finding also usually allows the differentiation of renal hemorrhagic neoplasms from renal hemorrhagic cysts.
3.7 Milk of Calcium Cyst
Case 15
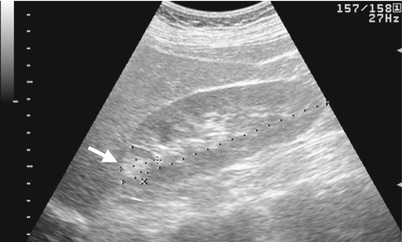
Fig. 3.20
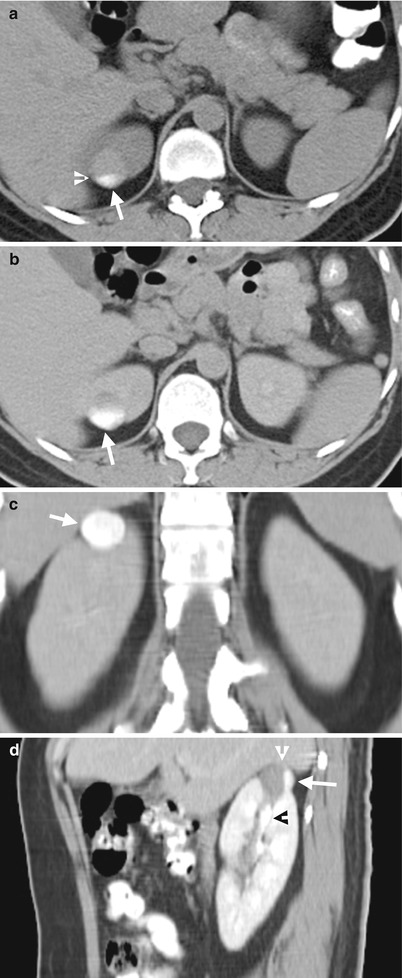
Fig. 3.21
Renal ultrasound (US) and computed tomography (CT) images show milk of calcium in a renal calyceal diverticulum. Figure 3.20, right renal US of longitudinal scan shows a lesion with a horizontal line (arrow) due to an interface between a hyperechoic part and another hypoechoic part at the right renal upper pole, suggestive of milk of calcium. Figure 3.21a, axial unenhanced CT at the renal upper pole level, with the patient in supine position, shows a layered appearance (arrowhead) with high-density calcification in the dependent portion of a lesion (arrow). Figure 3.21b, axial enhanced CT of excretory phase shows increased amount of high-density part of this lesion, suggesting a communication between the right renal collecting system and its location as a renal calyceal diverticulum. Figure 3.21c, coronal enhanced CT image shows high density on the dependent part of a right renal upper pole lesion (arrow) due to milk of calcium. Figure 3.21d, sagittal enhanced CT image of the right kidney shows high-density calcification in the posterior dependent part of this right renal upper pole lesion (arrow), consistent with milk of calcium. There is a fluid-calcification layering interface (white arrowhead) within this lesion. Note the opacification of contrast medium (right arrowhead) in the right renal collecting system.
Case 16
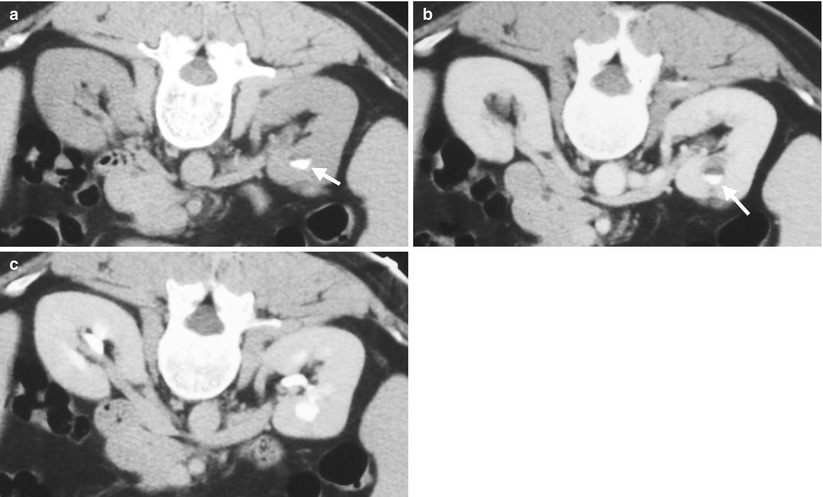
Fig. 3.22
Computed tomography (CT) images show milk of calcium in left renal calyceal diverticulum. Figure 3.22a, unenhanced axial CT image of prone positioning shows dense calcification in the dependent part of a cystic lesion (arrow) of the left kidney, consistent with milk of calcium. Figure 3.22b, enhanced axial CT image of nephrogenic phase during prone positioning shows a similar appearance of milk of calcium (arrow) of the left kidney. Figure 3.22c, enhanced axial CT image of excretory phase during prone positioning shows contrast filling in the lesion (arrow), suggestive of a renal calyceal diverticulum.
Key Diagnostic Features
Milk of calcium is a suspension of calcified materials in fluid. The calcified materials usually accumulate in the dependent part and thus form an interface between calcification and fluid. Thus, milk of calcium is diagnosed by dense calcification in the dependent portion with a layering appearance on renal ultrasound, computed tomography, or standing film of plain radiography of the kidney, ureter, and bladder (KUB) [4, 5]. Milk of calcium is most commonly seen in calyceal diverticulum, which could be confirmed by contrast medium opacification due to its communication with the renal collecting system.
Related posts:
Stay updated, free articles. Join our Telegram channel

Full access? Get Clinical Tree


