Fig. 9.1
Left image: Intravenous pyelogram demonstrating normal configuration of a left kidney with upper-pole (white arrows), mid-pole (red arrows), and lower-pole (blue arrows) calyces. Right image: MR urogram of normal kidneys with distinguishable upper, mid, and lower poles
Renal vasculature is highly variable with up to 40 % of kidneys not having the classic renal blood supply with one renal vein and one renal artery. The renal artery branches into 4–5 segmental arteries which are end arteries supplying a distinct area of the kidney with no collateral arterial blood flow. The segmental arteries branch into lobar arteries which branch into the interlobar arteries which give rise to the arcuate arteries. The arcuate arteries run along the corticomedullary junction and branch into the interlobular arteries which give rise to the afferent arterioles that supply the glomerulus. From the glomerulus, the efferent arterioles give rise to the vasa recta. The venous drainage parallels the arterial supply with the major difference that there is collateral venous drainage. The main renal vein is generally anterior to the renal artery.
Normal Kidney Imaging
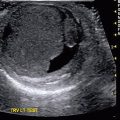
Antenatally and early in life, the kidneys show corticomedullary differentiation on renal ultrasound which can be confused with hydronephrosis of the calyces (Fig. 9.2). In addition, fetal lobulation of the kidney is seen at birth and generally disappears by 1 year of age but may persist (Fig. 9.3). Generally, the pelvicalyceal anatomy is not seen well on ultrasound unless there is significant hydronephrosis (Fig. 9.4). A normal kidney on ultrasound is slightly less echogenic than the liver with the difference in echogenicity generally increasing with age (Fig. 9.5).
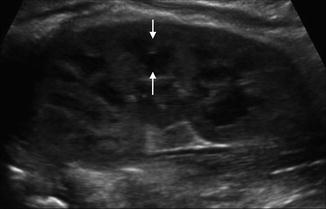
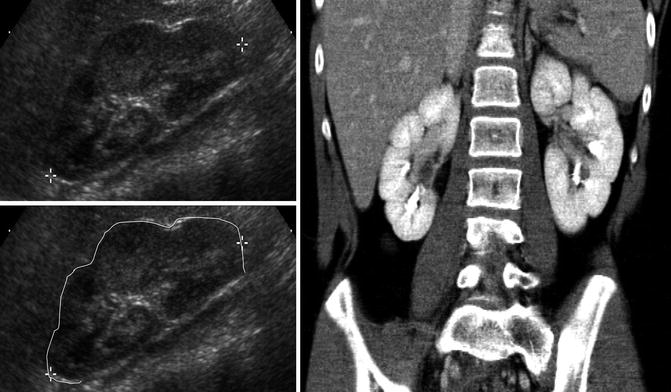
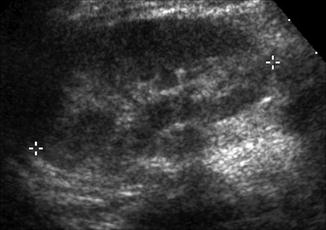
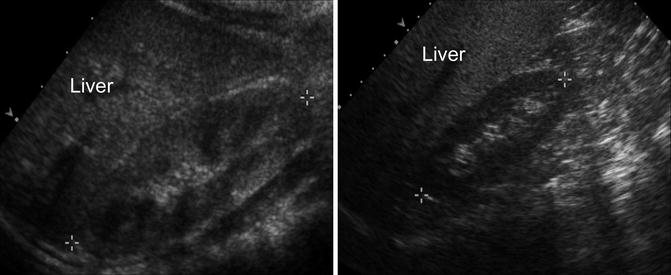
Fig. 9.2
Ultrasound of the left kidney in a 1-week-old infant demonstrating corticomedullary differentiation. The hypoechoic areas are the renal pyramids (one pyramid identified by white arrows)
Fig. 9.3
Renal ultrasound of the right kidney in a 1-year-old demonstrating fetal lobulations (left images) with the renal contour highlighted in the lower image. CT scan with IV contrast in a 10-year-old demonstrating persistence of fetal lobulations into childhood (right)
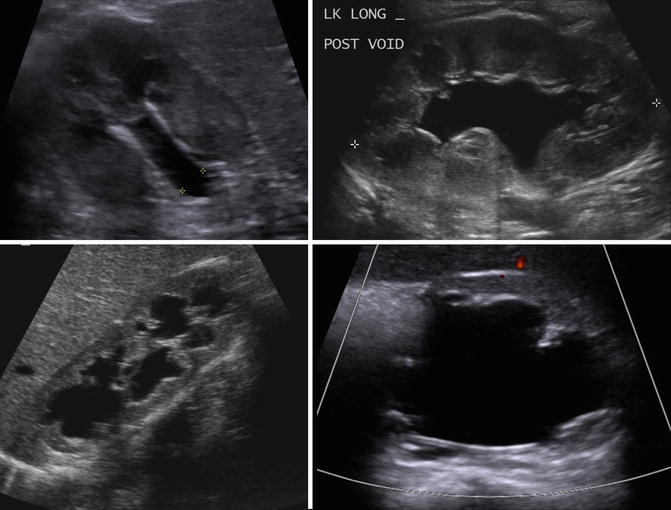
Fig. 9.4
Normal renal ultrasound of the left kidney in a 1-year-old demonstrating inability to discern pelvicalyceal anatomy (asterisk denote renal polar length)
Fig. 9.5
Normal renal ultrasound of the right kidney in a 1-year-old demonstrating normal echogenicity compared to the liver (left). Normal renal ultrasound of the right kidney in a 10-year-old demonstrating that difference in echogenicity generally becomes more pronounced (right)
The normal kidney on the noncontrast phase of a CT scan should have a radiodensity measured in Hounsfield units of around 30. The renal cortex, medulla, and calyces are generally not distinguishable on a noncontrast phase. After infusion of intravenous contrast, the cortex is able to be distinguished from the medulla on an early nephrogram phase. On a later nephrogram phase, the cortex and medulla may be less distinguishable, and the contrast enhancement should be symmetric between the two kidneys. On the excretory phase, the renal calyces should be crisp and not dilated (Fig. 9.6).
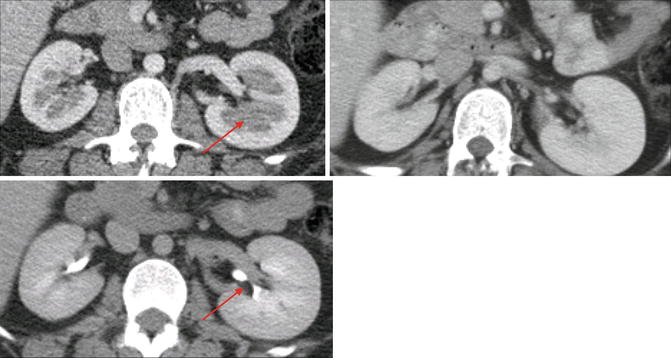
Fig. 9.6
Axial CT scan of the kidneys with intravenous contrast. The upper left image shows an early nephrogram phase, note how the medulla of the kidney has yet to fully enhance with contrast and is distinguishable from the cortex (arrow). The upper right image shows a later nephrogram phase of the same patient at another time where the contrast has now reached the medulla. The lower image shows the excretory or urogram phase with contrast easily visible within the renal collecting systems (arrow)
In a normal kidney imaged by T1-weighted MRI, the cortex has a higher signal intensity than the medulla and therefore appears brighter than the medulla allowing the cortex and medulla to be differentiated (Fig. 9.7). On T2-weighted MRI, the medulla has a higher signal intensity and appears brighter than the cortex. In addition, the collecting system has a higher signal intensity on T2-weighted MRI and can be somewhat visualized. Visualization of the collecting system and vascular supply can be improved with the addition of intravenous contrast such as gadolinium (Fig. 9.7).
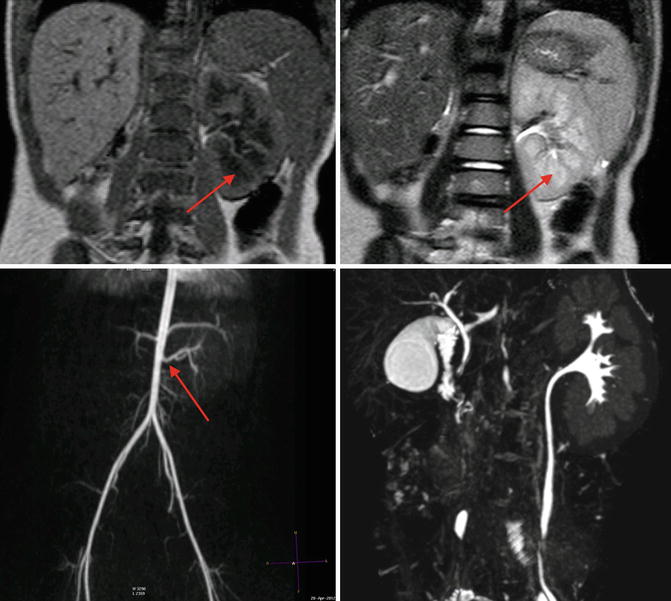
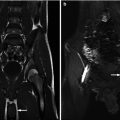
Fig. 9.7
MRI of a 4-year-old with solitary left kidney. Upper left image is a T1-weighted MRI image, note the cortex has a higher signal intensity than the medulla (arrow). On the T2-weighted MRI image in the upper right, the medulla (arrow) has a higher signal intensity than the cortex, and the collecting system is somewhat discernable. The lower left image is a three-dimensional reconstruction of an arterial phase demonstrating MR angiography; the arrow denotes the renal artery. The lower right image is a three-dimensional reconstruction of the excretory phase after addition of intravenous contrast demonstrating the collecting pelvicalyceal collecting system
The normal kidneys on radionuclide scans should uptake radiotracer symmetrically and homogeneously throughout the kidneys (Fig. 9.8). In the case of a MAG3 renal scan, the radiotracer should begin excretion into the collecting system within 10 min and should wash out promptly if furosemide is given. A time for half of the radiotracer to wash out (T ½) under 10–15 min is considered unobstructed. The differential function on a MAG3 renal scan is determined by the amount of radiotracer taken up by the kidneys within the first 2–3 min after radiotracer infusion.
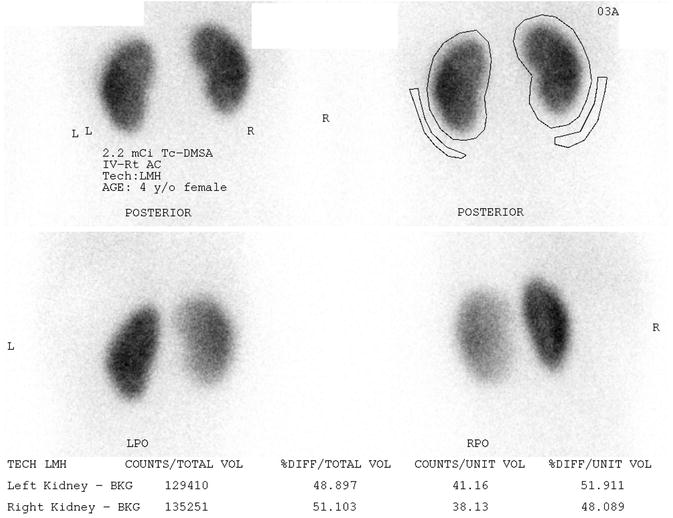
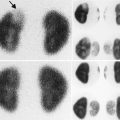
Fig. 9.8
Normal DMSA scan of a 4 year old female with vesicoureteral reflux. The kidneys uptake the radiotracer symmetrically and homogeneously on the posterior images (upper images). Posterior oblique images (lower images) give an asymmetrical appearance
Normal Ureter Anatomy
The renal pelvis drains to the ureter whose origin is normally posterior to the renal artery. The ureter courses caudally and anterior to the psoas muscle toward the pelvis. The ureter crosses the iliac vessels close to its bifurcation. Once in the pelvis, the ureter passes posteroinferiorly along the lateral walls of the pelvis and then courses anteromedially to come into contact with the bladder. The ureter travels 2–3 cm within the bladder wall before the ureteral orifice. There are three points of anatomical narrowing in the ureter that are common sites of ureteral nephrolithiasis: the ureteropelvic junction, the iliac vessels, and the ureterovesical junction. The normal ureter size in adults is 1.8 mm (SD 0.9 mm) with 96 % of ureters less than 3 mm [6]. The blood supply of the upper ureter comes medially from the aorta, and the blood supply of the lower ureter comes laterally from the iliac vessels.
Normal Ureter Imaging
Most ureters are not able to be visualized their entire length by ultrasonography unless there is hydroureter. Normal ureters can be visualized on CT and MRI, and their visualization is enhanced on the delayed excretory phase of a contrast-enhanced study (Fig. 9.9). A retrograde pyelogram can also be used to study the ureters but requires cystoscopy and anesthesia (Fig. 9.10).
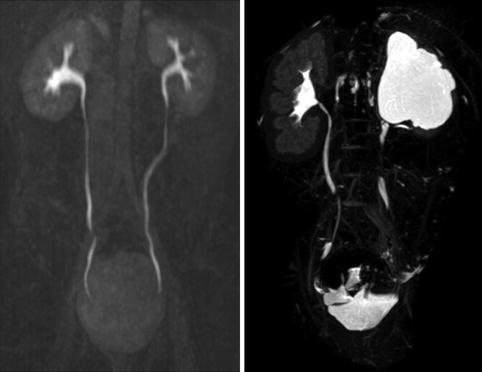
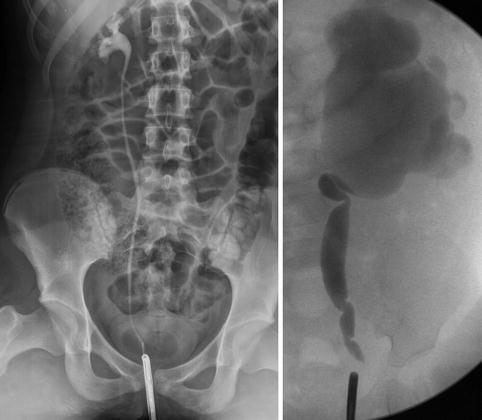
Fig. 9.9
Normal ureters on excretory phase of MRI (left image). It is normal for the entire ureter not to be visualized on the excretory phase as some parts of the ureter may be undergoing peristalsis. The right image shows a normal left kidney and a right kidney with hydronephrosis and thin parenchyma on excretory phase of MRI
Fig. 9.10
Normal right ureter on retrograde pyelogram in a 10-year-old (left image). Left kidney with UPJ obstruction in a 1-year-old (right image), the ureter has evidence of fetal folds which are a normal variant in young children
Normal Bladder Anatomy
The bladder is a retroperitoneal pelvic organ. The superior surface is covered with peritoneum, and the urachus attaches the bladder to the anterior abdominal wall. When full, the bladder is an ovoid shape.
Normal Bladder Imaging
The bladder can be visualized by ultrasound, and the volume of urine can be estimated. The normal bladder wall thickness in adults is around 3 mm [7]. In school-age children, the normal bladder wall thickness is 1–2 mm [8]. Another study found that the normal bladder wall thickness for all ages of children from newborn to teenager was around 2 mm [9]. A VCUG can demonstrate the size of a bladder as well as its contour. The bladder contour should be smooth and ovoid shaped without trabeculations and diverticulum (Fig. 9.11).
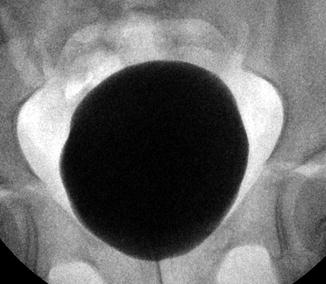
Fig. 9.11
Normal appearance of the bladder on VCUG with no trabeculations and a smooth, ovoid shape
Congenital Anomalies of the Kidney and Urinary Tract
CAKUT represents a wide variety of malformations and disorders that result from abnormal development of the kidney and collecting system. They can be divided in to three major categories:
1.
Anomalies of renal parenchyma development
2.
Anomalies of embryonic renal migration and fusion
3.
Anomalies of collecting system development
Anomalies of Renal Parenchyma Development
Anomalies of renal parenchyma development result in renal dysplasia. Renal dysplasia is characterized by abnormal nephron and collecting system development that leads to malformed kidney tissue with pathologic findings such as primitive-appearing tubules, fibrosis or scarring, and metaplastic tissue such as cartilage being present. This process can lead to several different clinical diagnoses such as renal hypoplasia, renal dysplasia or hypodysplasia, multicystic dysplastic kidney, polycystic kidney disease, or renal agenesis. The genes associated with renal dysplasia are often genes expressed during kidney development [10]. Exposure to angiotensin converting enzyme inhibitors in utero has been associated with renal dysplasia and is an example of an environmental exposure associated with renal dysplasia [11].
Renal Hypoplasia
Renal hypoplasia is a rare entity that results in congenitally small kidneys with normal architecture but reduced number of nephrons. Renal hypoplasia may be unilateral with contralateral compensatory hypertrophy. Bilateral renal hypodysplasia can be part of genetic syndromes such as branchio-oto-renal syndrome and renal-coloboma syndrome [12, 13]. When bilateral, renal hypoplasia often results in end-stage renal disease (ESRD) with pathology consistent with focal segmental glomerular sclerosis and interstitial fibrosis presumably from hyperfiltration injury of the reduced number of nephrons [14].
The diagnosis of renal hypoplasia is a clinical diagnosis when an imaging study, typically renal ultrasonography, demonstrates a kidney smaller than 2 standard deviations of the mean kidney size by age (Fig. 9.12) [15]. Absence of renal scarring on a 99mTc-dimercaptosuccinic acid (DMSA) radionuclide scan is expected (Fig. 9.13).
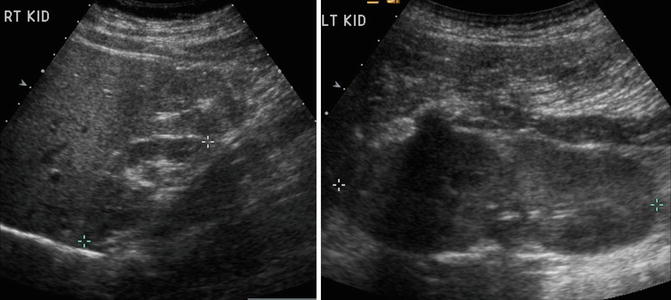
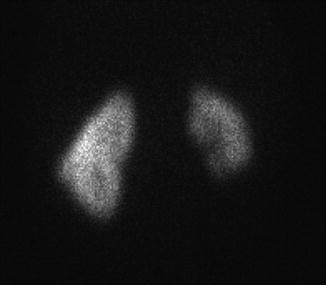
Fig. 9.12
Renal ultrasound of a 13-year-old with right renal hypoplasia. The right kidney (left image) is 2 standard deviations smaller than the mean size for age, and the left kidney demonstrates compensatory hypertrophy
Fig. 9.13
DMSA radionuclide renal scan of a 13-year-old from Fig. 9.12 with right renal hypoplasia with absence of renal scarring. The right kidney contributes 30 % of overall renal function
Renal Dysplasia
Renal dysplasia is more common than renal hypoplasia and is characterized by a kidney that is often smaller than normal depending on the size of associated cysts. Renal dysplasia occurs in about 3 of every 1,000 births and can be bilateral or unilateral with males affected 30–90 % more frequently than females [16]. Collecting system anomalies such as VUR, megaureter, ureteral atresia, and duplicated ureters occur at an increased incidence in kidneys with dysplasia [17–19]. Therefore, a voiding cystourethrogram (VCUG) is often obtained along with a renal ultrasound. As with renal hypoplasia, unilateral renal dysplasia is often associated with contralateral renal hypertrophy, and bilateral renal dysplasia is often associated with ESRD.
In children, ultrasonography is often the first imaging modality to evaluate renal dysplasia. Cystic areas, echogenic renal parenchyma, small kidneys, and hydronephrosis with thin renal parenchyma are examples of ultrasound findings with dysplasia but findings can be quite variable (Fig. 9.14). Findings on CT scan for renal dysplasia can also be quite variable (Fig. 9.15). A static renal scan such as a DMSA scan will show heterogenous, decreased uptake of radionuclide and possibly a small kidney representing poor renal function compared to a normal contralateral kidney (Fig. 9.16). As stated above, a VCUG is often obtained to evaluate for VUR which is often associated with renal dysplasia.
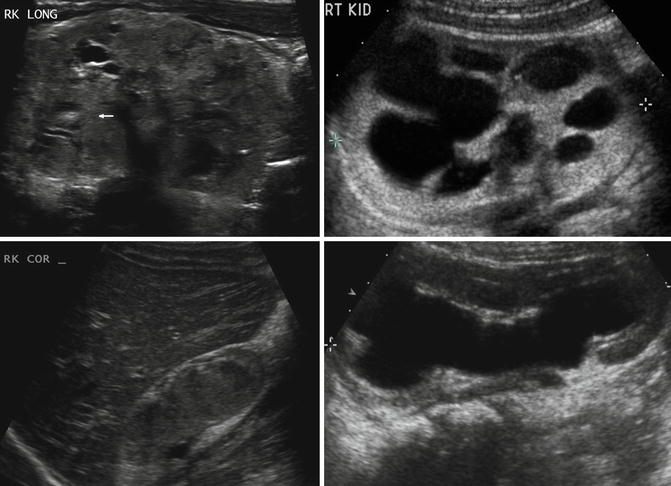
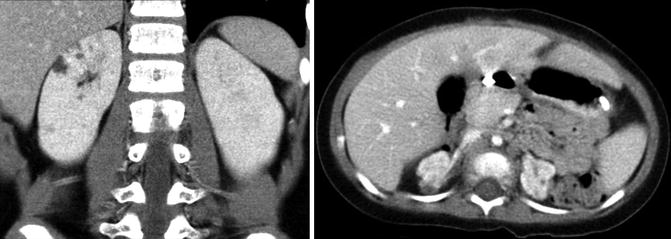
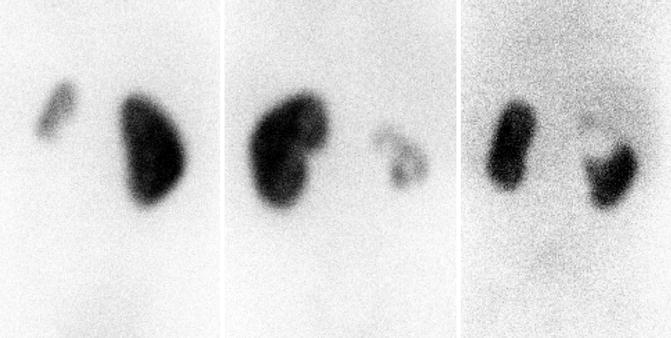
Fig. 9.14
Renal dysplasia can have many different appearances on renal ultrasound. An 8-day-old with areas of cystic renal dysplasia (Top left). A 4-year-old with echogenic renal cortex and hydronephrosis (Top right). A 2-year-old with renal hypodysplasia with cystic areas (bottom left). A 6-month-old with thin renal parenchyma and hydronephrosis (bottom right)
Fig. 9.15
Small areas of cystic renal dysplasia (left image). Bilateral renal dysplasia with hypoplastic kidneys demonstrating heterogeneous uptake of contrast and cystic areas (right image)
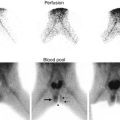
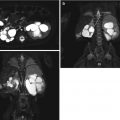
Fig. 9.16
DMSA scans demonstrating heterogeneous uptake of radiotracer with renal dysplasia. Left image is a 4-year-old with small congenitally dysplastic left kidney associated with vesicoureteral reflux. The middle image is a 7-year-old with dysplastic and hydronephrotic right kidney associated with ectopic ureter. The right image is a 4-month-old with a duplex right kidney with the upper pole associated with an ectopic ureter
Multicystic Dysplastic Kidney
A multicystic dysplastic kidney (MCDK) is a very severe form of renal dysplasia characterized by a kidney that is non-reniform in shape, composed of noncommunicating cysts, lacking functional renal tissue, and has an absent or atretic ureter [20]. Most cases of MCDK are detected antenatally by ultrasound and are found between 0.3 and 1 in 1,000 live births [21]. As with other forms of renal dysplasia, if the contralateral kidney is normal, it often shows compensatory hypertrophy. Children with unilateral MCDK have a low risk of any significant sequelae such as hypertension, proteinuria, significant renal impairment, or contralateral abnormalities such as VUR or ureteropelvic junction obstruction (UPJO) that require surgical correction [22, 23]. Historical concerns about an increased risk of malignancy in children with unilateral MCDK are not supported by current literature [24, 25].
On ultrasound, a MCDK generally appears as a collection of noncommunicating cystic structures of variable size. MCDK can be quite large in neonates and may even be palpable, but the majority of children with unilateral MCDK show involution of the MCDK over the first few years of childhood (Fig. 9.17). Cross-sectional imaging with CT scan will demonstrate similar findings as ultrasound as well as contralateral compensatory hypertrophy (Fig. 9.18). DMSA radionuclide scan demonstrates no significant update to the MCDK (Fig. 9.19). Grossly, a MCDK does not have the typical reniform shape, contains multiple cysts, and the ureter may be atretic (Fig. 9.20).
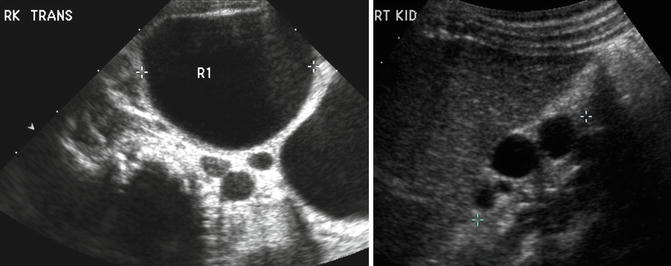
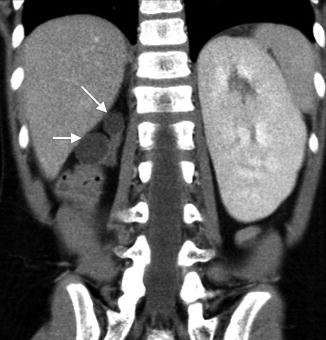
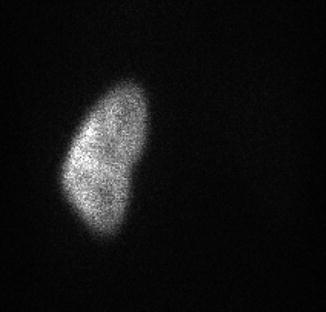
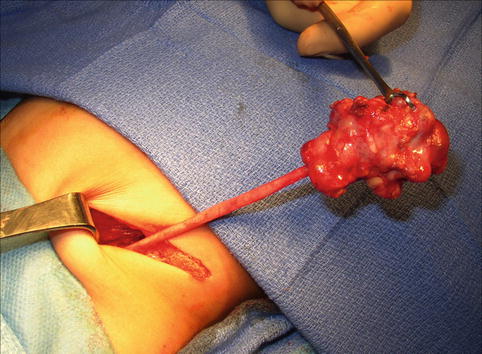
Fig. 9.17
A large multicystic dysplastic kidney in a newborn infant (left). Note the multiple noncommunicating cysts of varying size. The same child at age 2 with involuting MCDK (right)
Fig. 9.18
CT scan with right MCDK (arrows) and compensatory renal hypertrophy on left
Fig. 9.19
DMSA scan of a 9-year-old child with right MCDK and normal left kidney
Fig. 9.20
Gross image of MCDK at time of removal. This particular example has a well-defined ureter, but the ureter may also be atretic
Autosomal Recessive Polycystic Kidney Disease
Autosomal recessive polycystic kidney disease (ARPKD), previously called infantile polycystic kidney disease, has an estimated incidence of 1 per 10,000–40,000 births [26, 27]. Mutations in the PKHD1 gene on chromosome 6p12 that encodes for the protein fibrocystin are responsible for ARPKD with over 200 mutations identified [28]. The kidneys are increased in size and are filled with small cysts (<3 mm) arising from the collecting ducts that appear to radiate from the medulla to the cortex. The liver is also affected in ARPKD with evidence of congenital fibrosis due to malformation of the biliary system and may show hepatomegaly, increased echogenicity, and dilation of bile ducts on ultrasonography [29]. The clinical spectrum of ARPKD varies widely from death in utero or in infancy due to complications of oligohydramnios, to bilateral nephrectomies at birth with dialysis, and to delayed diagnosis into early adulthood with only signs of hepatic fibrosis [30]. In general, the earlier the diagnosis is discovered, the more severe the renal impairment will be. Most severe cases of ARPKD are detected by prenatal ultrasound.
On ultrasound, the kidneys are large most commonly have a reniform shape but will be filled with multiple small cysts causing the echotexture to be hyperechoic (Fig. 9.21). Cross-sectional imaging can demonstrate the cysts that arise in the cortex and radiate from the medulla to the cortex (Fig. 9.22). A newborn with severe ARPKD will have oligohydramnios, and the kidneys can be quite large and may need to be removed for any potential for survival with dialysis (Fig. 9.23).
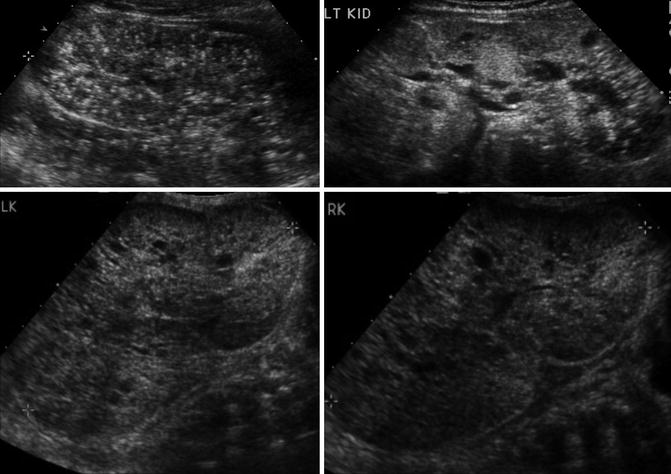
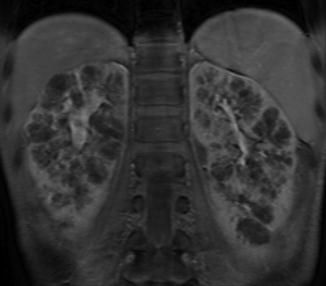
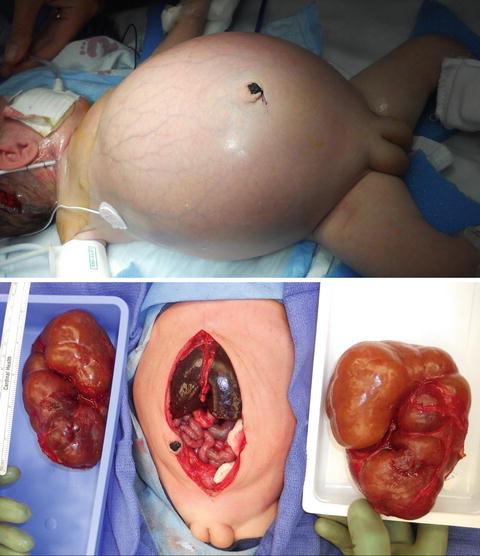
Fig. 9.21
Ultrasound examples of a newborn with ARPKD. Multiple small cysts in a reniform-shaped kidney that are both over 11 cm in length. The kidney also has increased echogenicity
Fig. 9.22
MRI image of ARPKD in a 7-year-old. The kidneys retain a reniform shape, and multiple small cysts are seen radiating from the medulla to the cortex
Fig. 9.23
Newborn female with ARPKD, oligohydramnios, renal failure, and pulmonary insufficiency (ultrasound shown in Fig. 9.20). Gross images after bilateral native nephrectomy
Autosomal Dominant Polycystic Kidney Disease
Autosomal dominant polycystic kidney disease (ADPKD), previously adult polycystic kidney disease, may present in childhood. ADPKD is much more common than ARPKD with 1 case occurring every 400–1,000 live births. The mutation for ADPKD occurs in the PKD1 or PKD2 gene with PKD1 mutations accounting for 85 % of the cases [31]. The PKD1 and PKD2 genes encode the polycystin-1 and polycystin-2 proteins, respectively. Pathologically, the kidneys develop cysts of variable size in all parts of the nephron. Since the number of cysts generally increases with age, children may only have a few cysts. The natural history of ADPKD is a progressive increase in the number and size of cysts with corresponding deterioration of renal function resulting in renal replacement in middle age to late adulthood. Most children with ADPKD are asymptomatic, but occasionally complications associated with the later stages of ADPKD such as ESRD, hypertension, pain, hematuria, or cyst infection can occur [32]. Other significant organ involvement occurs including hepatic, pancreatic, or splenic cysts; cerebral aneurysms in up to 10 % of patients; and increased left ventricular size [33, 34].
Renal ultrasound in children with ADPKD can be normal, have a small number of cysts, or demonstrate kidneys that are filled with cysts (Fig. 9.24). The cysts on cross-sectional imaging often have varying signal intensity due to hemorrhage or infection history (Fig. 9.24).
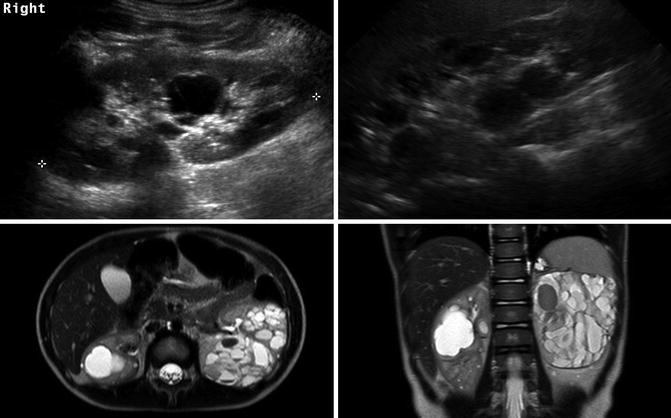
Fig. 9.24
ADPKD in a 9-year-old (left image) with a small number of cysts. The same patient at 20 years old (right image) showing progression and the right kidney now almost entirely filled with cysts. The lower T2-weighted MRI images of a 4-year-old demonstrate that ADPKD in children can be quite severe. The cysts have varying signal intensity likely due to hemorrhage
Isolated Renal Cysts
Isolated renal cysts are common incidental findings with the prevalence increasing with increasing age. Given how common isolated renal cysts are and the concern about risk of malignancy with complex renal cysts, the Bosniak classification system was created in which cysts are classified into one of five categories based upon morphologic and enhancement characteristics with CT scanning [35].
Category I: Benign simple cysts with thin wall and without septations, calcifications, or solid components. It has the density of water and does not enhance with contrast (Fig. 9.25).
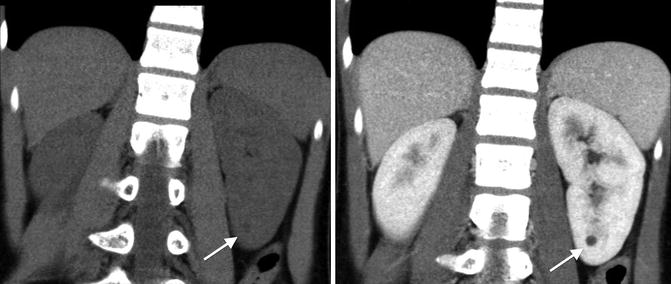
Fig. 9.25
CT scan images of a category I simple renal cyst (arrows). They cyst is smooth and round without any calcifications or solid components. The fluid within cyst is homogenous with a density similar to water (Hounsfield units less than 20). No contrast enhancement exists
Category II: Benign cystic lesions that may have a few thin septa, fine calcifications, or a short segment of thickened calcification. No contrast enhancement. Also includes lesions less than 3 cm in size with higher attenuation than water but without enhancement.
Category IIF: More complicated cystic lesions than category II but without contrast enhancement. Multiple thin septa may be present as well as thick calcifications. Also includes lesions greater than 3 cm in size with higher attenuation than water but without enhancement. Considered nonmalignant but follow-up required.
Category III: Cystic lesions that can be complex with measurable contrast enhancement. Approximately 50 % are malignant with low-grade renal cell carcinoma as the most common diagnosis (Fig. 9.26) [36].
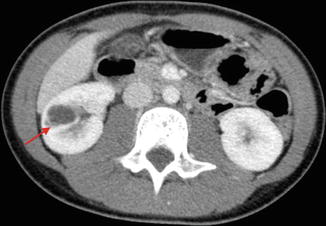
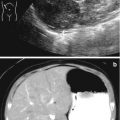
Fig. 9.26
CT scan image showing category III renal cystic lesion (red arrow) in a 13-year-old. Note the presence of septations with measurable contrast enhancement. Contrast enhancement of septations (Bosniak III) and soft tissue components (Bosniak IV) are the main distinguishing factors for renal cysts considered to have a high risk of malignancy
Category IV: These lesions are similar to category III lesions, and they contain contrast-enhancing soft tissue components. Greater than 75 % chance of malignancy with category IV lesions.
The Bosniak classification system has been evaluated on a limited scale in children with complex renal cysts. In one study, 5 of 39 children with complex renal cysts underwent resection; three had a benign cyst (Category IIF in 2, Category III in 1), and two had renal cell carcinoma (Category III in 1 and Category IV in 1) [37]. In another study of 22 children, all lesions classified as Category I or II were benign, and all malignant lesions were classified as Category III or IV [38].
The most common type of isolated renal cyst seen in children and adults is the simple renal cyst. Among adults, the prevalence of simple renal cysts increases from approximately 5 % in the fourth decade of life to over 30 % in the eighth decade of life [39]. The prevalence among people age 15–30 years old is less than 1 % [40]. One study evaluated over 16,000 renal ultrasounds of children from birth to age 18 found that the prevalence of simple renal cysts was 0.22 %, which was relatively stable across all age groups [41]. The average cyst size was 1 cm (range 0.3–7 cm), and of the 23 cysts followed, only 2 were slightly larger and only 1 cyst required treatment with percutaneous drainage [41].
Ultrasound is used most commonly in children to evaluate simple renal cysts, and a CT scan is not needed if a cyst meets ultrasound criteria for a simple cyst. On ultrasound a simple renal cyst is defined as being round and sharply demarcated with smooth walls, no internal echoes within the cyst, and there is a posterior wall echo with enhanced transmission beyond the cyst (Fig. 9.27) [42]. Rarely, a large simple cyst will cause pain and will require treatment such as laparoscopic cyst decortication or percutaneous drainage (Fig. 9.28).
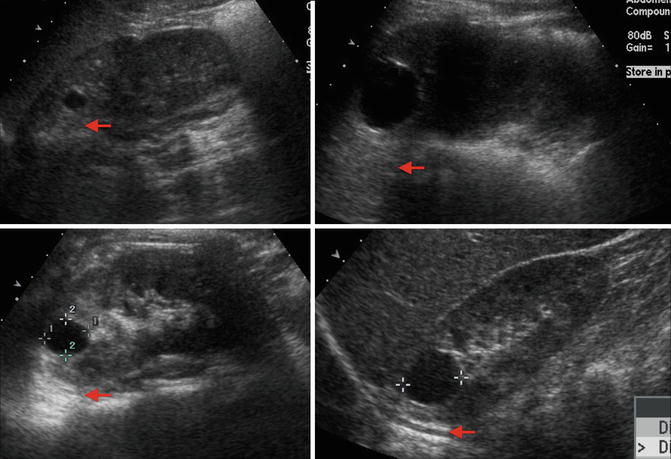
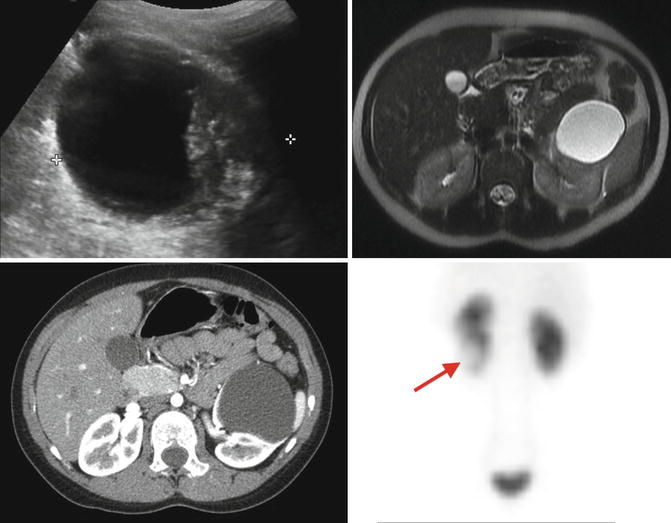
Fig. 9.27
Examples of ultrasound images of simple cysts in four different children. The cysts are round with smooth walls, there are no internal echoes, and there is a posterior wall echo with enhanced transmission beyond the cyst (arrows showing enhanced transmission)
Fig. 9.28
Preoperative evaluation prior to laparoscopic decortication of a symptomatic left lower-pole renal cyst. The renal ultrasound shows a large lower-pole cystic structure with questionable thick walls (upper left). The MRI (upper right) and CT scan (lower left) demonstrate a non-enhancing simple cyst. The MAG3 renal scan demonstrated a left kidney that functions well but had an area in the lower pole with lack of contrast uptake (arrow) that corresponded to the cyst (lower right)
Renal Agenesis
The congenital absence of renal parenchymal tissue, renal agenesis, results from an early disruption of metanephric development and occurs approximately every 1 per 3,000–5,000 births [1, 43]. Renal agenesis is thought to be due to a failure of ureteral bud induction or development of the mesonephric duct [1]. Most patients are asymptomatic and are diagnosed during screening antenatal ultrasound or for imaging performed for other reasons showing an absent renal fossa and contralateral compensatory renal hypertrophy. A postnatal ultrasound and radionuclide scan confirm the diagnosis. Other congenital anomalies such as VUR, UPJO, and ureterovesical junction obstruction (UVJO) are more common in the remaining kidney [44, 45]. Unilateral renal agenesis in males can be associated with abnormalities or absence of structures derived from the mesonephric duct such as the seminal vesicles, vas deferens, and epididymis [46]. Unilateral renal agenesis in females is associated with an increased risk of Mullerian abnormalities such as uterine didelphys, duplicated vagina, and obstructed hemivagina [47].
Anomalies of Renal Migration and Fusion
Renal migration and fusion anomalies result in renal ectopia and renal fusion anomalies, respectively. The kidney normally ascends during development from the pelvis to the lumbar position by week 8 of gestation. As the kidney ascends, the kidney obtains its blood supply from nearby vessels. As a result, ectopic kidneys have an anomalous blood supply. The kidney also normally rotates medially 90° as it ascends causing the renal hilum to be oriented medially. Fusion anomalies occur when the developing kidneys fuse abnormally prior to ascent. All forms of ectopic or fused kidneys are associated with an increased risk of ipsilateral and contralateral renal abnormalities such as VUR, UPJO, hydronephrosis, kidney stones, and urinary tract infections [48].
Renal Ectopia
The most common position for an ectopic kidney is below the ipsilateral pelvic brim. These pelvic kidneys are found in 1 in 500–1,200 births [46]. Pelvic kidneys also fail to rotate properly and tend to have an anteriorly directed blood supply and renal pelvis. The blood supply is variable and can come from a one or a combination of the internal iliac, external iliac, common iliac, or aorta. Rarely, an ectopic kidney can be located in the thoracic region [49]. There is an increased incidence of other urologic abnormalities in the ectopic kidney as well as the contralateral kidney with vesicoureteral reflux to the ectopic kidney being the most common [48]. In females, Mullerian abnormalities have been associated with ectopic kidneys such as Mayer-Rokitansky-Kuster-Hauser syndrome or ipsilateral uterine agenesis [50, 51].
Simple renal ectopia is often evaluated with ultrasonography or cross-sectional imaging (Fig. 9.29). A DMSA scan can be obtained to evaluate function of the ectopic kidney (Fig. 9.30). A VCUG is commonly obtained to evaluate for VUR in the ectopic or contralateral kidney.
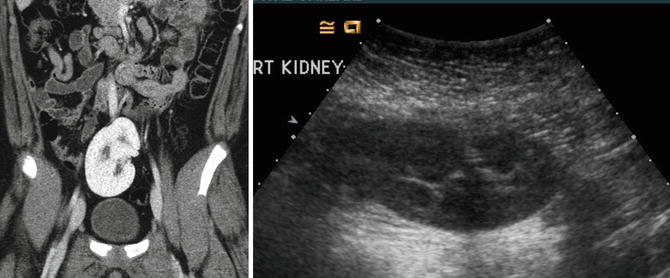
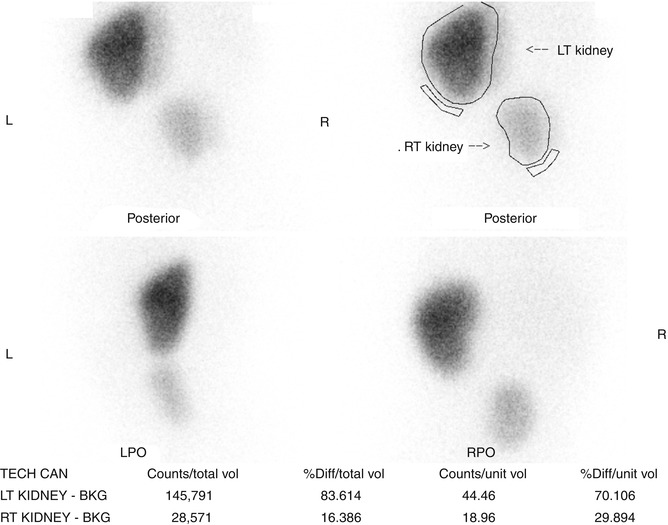
Fig. 9.29
CT and ultrasound images of a 10-year-old with right ectopic kidney (pelvic kidney)
Fig. 9.30
DMSA scan of the right pelvic kidney. Note the decreased function that is typical of ectopic kidneys with the right pelvic kidney contributing 16 % of total renal function
Crossed Renal Ectopia
Crossed renal ectopia occurs in 1 in 1,000–2,000 births and is associated with some fusion to the other kidney 90–95 % of the time [46, 52]. Most commonly, the fusion is between the upper pole of the crossed ectopic kidney and the lower pole of the kidney on the appropriate side. The ureter of the crossed ectopic kidney generally crosses back to the other side and inserts into the bladder trigone. Other rare forms of crossed renal ectopic include crossed unfused renal ectopia and bilateral crossed renal ectopia.
Crossed renal ectopia can also be detected with ultrasonography and cross-sectional imaging, and an excretory phase can be obtained to further characterize the anatomy if needed (Fig. 9.31). Radionuclide scans are also helpful in determining the anatomy and relative function of the kidneys (Fig. 9.32).
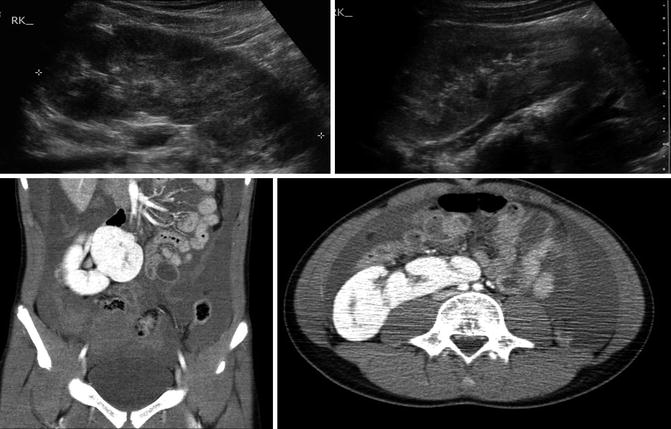
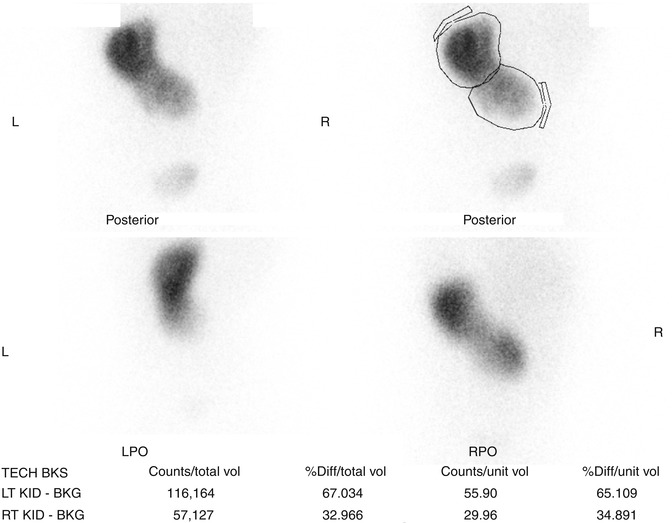
Fig. 9.31
Ultrasound and CT imaging of crossed fused ectopia found incidentally after trauma (note free fluid on CT images). The ectopic kidney has anteriorly facing renal pelvis
Fig. 9.32
DMSA scan of crossed fused renal ectopia. The ectopic kidney has decreased function compared to the non-ectopic kidney
Horseshoe Kidney
Horseshoe kidneys are the most common renal fusion abnormality occurring in 1 in 600 individuals [53]. The horseshoe kidney occurs when the lower poles of the developing kidneys fuse prior to renal ascent. The part of the horseshoe kidney that connects the two sides is called the isthmus and can contain functional renal tissue or just be a fibrous band depending on how early the fusion event occurred. The fused kidneys are not able to rotate properly, and ascent is limited by the isthmus coming into contact with the inferior mesenteric artery. As a result, a horseshoe kidney has its distinct horseshoe shape, is located more caudal than normal kidneys, has an anteriorly directly renal pelvis, and has a highly variable blood supply from the aorta and iliac vessels [54, 55]. The presence of a horseshoe kidney is often asymptomatic but is associated with an increased risk of VUR, hydronephrosis, UPJO, kidney stones, and UTIs [21].
Ultrasonography can usually detect the isthmus of a horseshoe kidney (Fig. 9.33), but sometimes cross-sectional imaging is needed (Fig. 9.34). In addition, studies such as a VCUG or MAG3 furosemide renal scan are obtained if there is the presence of hydronephrosis and/or urinary tract infections (Fig. 9.35).
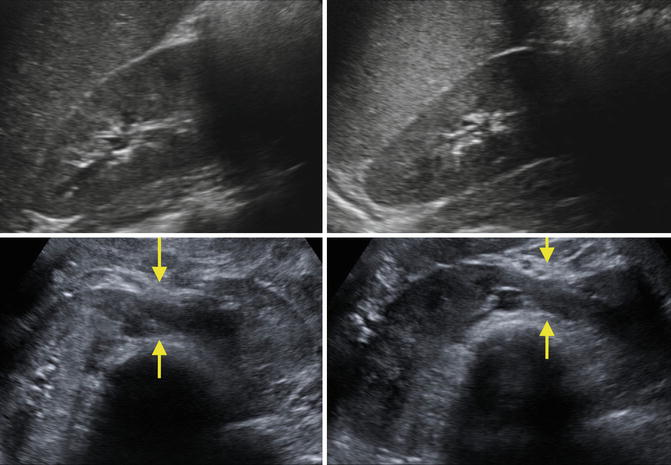
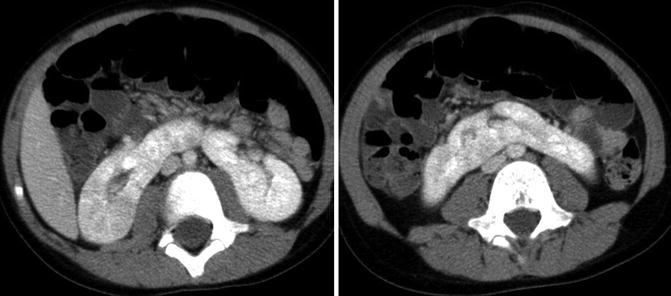
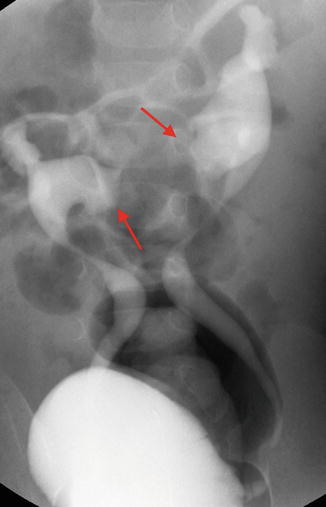
Fig. 9.33
Ultrasound images of a 7-year-old with a horseshoe kidney. Right kidney (upper left), left kidney (upper right), and isthmus indicated by arrows (bottom images)
Fig. 9.34
CT images of horseshoe kidney demonstrating prominent isthmus in a 10-year-old
Fig. 9.35
VCUG demonstrating bilateral vesicoureteral reflux into a horseshoe kidney. Note the medially directed calyces (red arrows) typical of a horseshoe kidney
Anomalies of Collecting System Development
Anomalies of collecting system development constitute some of the more common CAKUT diseases. Anomalies of the renal pelvis include congenital hydronephrosis, congenital UPJ obstruction, and megacalycosis. Anomalies of the ureter include primary megaureter, ectopic ureter, duplicated ureter, ureteroceles, and vesicoureteral reflux. Anomalies of the bladder and urethra include bladder exstrophy and epispadias complex, prune-belly syndrome, posterior urethral valves, bladder diverticulum, duplicated urethra, and urethral atresia.
Congenital Hydronephrosis
Antenatal hydronephrosis is found in approximately 1–2 % of all fetuses screened by prenatal ultrasound and seems to be more common in male fetuses [56, 57]. Clinical outcomes are related to severity of hydronephrosis, and two main grading systems are used. The Society for Fetal Urology (SFU) criteria grade antenatal hydronephrosis and postnatal hydronephrosis based upon the degree and location of hydronephrosis as well as presence of thinned renal parenchyma [58].
Grade 0: Normal examination with no dilatation of the renal pelvis
Grade 1: Mild dilatation of renal pelvis only (Fig. 9.36)