Estimation of renal plasma flow (GFR/global renal function)
Evaluation of renal cortical lesions (pyelonephritis, scarring)
Estimation of differential renal function (DRF)
Evaluation of urinary drainage, diagnosis of renal obstruction
Evaluation and surveillance of vesicoureteral reflux
Determination of testicular blood flow in cases of suspected testicular torsion
The success of radionuclide renal imaging depends on several factors, including: (1) plasma protein binding and thus volume of distribution of the tracer; (2) rapid delivery to and selective uptake of the tracer by the target organ, e.g., the kidneys, versus the “background”; (3) photon attenuation by fluid collections and surrounding organs; (4) renal function; and (5) technical aspects such as selection of the region of interest (the organs to be evaluated) as well as selection of an appropriate background area.
In general, radionuclide image resolution is diminished compared to, while the radiation dose is similar or often lower than other radiologic imaging modalities such as the conventional VCUG, intravenous pyelography (IVP), and CT scanning. Unlike standard radiology, radiation dosage depends primarily on the amount of radioactivity administered. Patient exposure is independent of the number of images obtained, and this allows for almost unlimited “real-time” dynamic imaging which can be important when determining time-dependent processes, such as sporadic vesicoureteral reflux or renal drainage. Administered activity (radiotracer dosage) guidelines can be found in the Society of Nuclear Medicine website (www.snm.org).
Radiopharmaceuticals
Radiopharmaceuticals for evaluation of the kidney s are classified into three general categories: cortical agents, tubular agents, and glomerular agents.
Cortical Agents
99mTc-Dimercaptosuccinic acid (DMSA) is extensively bound to plasma proteins (90 %), and very little is taken up by red blood cells (0–5 %) [1]. A small amount is glomerularly filtered [2, 3], but this tracer accumulates predominantly in the proximal convoluted tubules. Up to half of the injected activity is retained in the kidneys at 2 h and 70 % at 24 h postinjection [1, 4]. The highest-quality images are obtained about 2–4 h postinjection. These characteristics of DMSA make it an ideal imaging agent for the renal cortex to detect and define pyelonephritis, and renal cortical scarring and to assess the size, shape, and position of the kidneys, and to provide a reasonable estimate of split renal function. Due to its complex renal clearance, DMSA is not useful for estimating global renal function or GFR [5]. Similarly, it is not useful for evaluating urinary drainage because only a small fraction is eliminated in the urine (6 % at 1 h, 25 % at 14 h) [1]. DMSA has been used to aid in localization of renal ectopia, but abdominopelvic ultrasonography may obviate the need for this [6].99mTc-Glucoheptonate, another agent used for renal cortical imaging, is no longer available.
Tubular Agents
These agents are excreted principally through the tubules.99mTc-Mercaptoacetyltriglycine (MAG3) is the only approved tubular agent available for use in the United States. It is largely bound to plasma proteins (up to 90 %) with minimal (1–2.3 %) binding to red blood cells. This results in a significantly reduced volume of distribution and a high target to background ratio which translates into improved image quality and increased utility in younger patients [7–9].99mTc-MAG3 is rapidly extracted and secreted by the proximal renal tubules, in a manner qualitatively similar to that of orthoiodohippurate. Renal uptake is reduced by poor function. Up to 70 % of the injected dose is eliminated within 30 min, and by 3 h, up to 90 % can be recovered in the urine [7, 10].99mTc-MAG3 can be used quantitatively or qualitatively for evaluating obstructive uropathy, renovascular hypertension, and renal allografts and has been used to approximate effective renal plasma flow (ERPF) measurement. However,99mTc-MAG3 slightly underestimates split renal function when compared directly to99mTc-DMSA. This effect was magnified when there was a large difference in function between kidneys but never exceeded 4.3 % [11]. Some authors also have used it for cortical imaging [12, 13].
Glomerular Agents
99mTc-Diethylenetriaminepentaacetic acid (DTPA) is excreted predominantly by glomerular filtration and can be used to measure GFR. Like99mTc-MAG3,99mTc-DTPA can be used to assess renal blood flow and function, renal allografts, suspected renovascular hypertension, and obstructive uropathy [14, 15]. Its renal extraction fraction, however, is only about 20 %, compared to 40–50 % for99mTc-MAG3 (K). Renal excretion is significantly affected by reduced renal function and performs inferior to99mTc-MAG3 in patients with poor renal function and in suspected obstruction [16, 17]. It is not a good agent for renal cortical imaging because of its relatively rapid excretion.
Iodine-125 iothalamate is used exclusively for the nonimaging assessment of GFR. The glomerular agents131I-orthoiodohippurate and123I-orthoiodohippurate, once the mainstay of radionuclide renal studies, are no longer available in the United States.
Radiation Dosimetry
In recent years, much has been written regarding radiation dose limitation, specifically the concept of “ALARA – as low as reasonably achievable.” This has led authors to favor imaging modalities that do not utilize ionizing radiation whenever possible, such as ultrasonography or magnetic resonance imaging. In situations where this is not feasible or when US or MRI does not perform as well as nuclear or radiographic studies, one needs to choose the study that offers the greatest diagnostic information and with the least radiation exposure.
The majority of nuclear studies, with the exception of cystography, carry a significant radiation burden (Table 6.2). In most cases, nuclear medicine studies used in pediatric urology offer similar or less radiation than other comparable imaging modalities. An exception would be scrotal scintigraphy, whose nonnuclear imaging counterpart is Doppler.99mTc-DMSA renal cortical imaging, because of its selective tubular uptake and delayed excretion, provides one of the higher effective radiation doses. This is similar to that of IVP but offers greater sensitivity and specificity [18]. Radionuclide cystography, due to the relatively short period of time and distribution limited mostly to the bladder, provides a much lower effective dose [19] than contrast voiding cystourethrography (VCUG). However, strides have been made in reducing the radiation exposure during VCUG by limiting fluoroscopy time and technical refinements of the instrumentation. The use of grid-controlled pulsed fluoroscopy decreases radiation doses across all age groups by 10–50 % compared to continuous fluoroscopy with an effective dose comparable to that of DRC [19, 20].
Table 6.2
Estimated total body radiation dosimetry (effective dose) for various radiologic and nuclear imaging studies
Effectivedose (mSv) | Effectivedose (mSv) | Effective dose as a percentage of total annual atmospheric radiation exposure (%) | |
|---|---|---|---|
1 year of age | 5 years of age | ||
99mTc-DMSA cortical scintigraphy | 0.8–0.9a,b | 0.8–0.93a,b | 25–3 |
99mTc-MAG3 diuretic renography/indirect radionuclide cystography | 0.6–0.77a,c | 0.6–1.49a,c | 19–51 |
99mTc-Pertechnate direct radionuclidecystography | 0.08c | 2.5 | |
99mTc-Pertechnate scrotal scintigraphywithout thyroid blockade | 1.4–1.9a,c | 1.4–1.9a,c | 45–61 |
Intravenous pyelogram (IVP) with grid | 1.0b | 1.2b | 32–38 |
Voiding cystourethrogram (VCUG) | 0.45–0.89d,e | 0.45–0.72d,e | 14–28 |
Voiding cystourethrogram (VCUG)with GCPL | 0.053–0.069d | 1.7–2.2 | |
GFR Measurement
Traditionally, GFR has been determined by clearance of a substance that is (1) completely filtered by the glomerulus; (2) not synthesized, destroyed, reabsorbed, or secreted by the renal tubule; (3) physiologically inert; and (4) not bound to plasma proteins [21]. Agents such as inulin, urea, and creatinine have been used to measure GFR. While inulin clearance is generally acknowledged as the gold standard, it has limited clinical utility as it must be continuously infused and requires multiple timed blood samples. 99m Tc-DTPA, however, despite having minimal protein binding, meets the above criteria and requires only one injection [22].
GFR can be estimated via DTPA scintigraphy with serial timed plasma samples or via a camera-only method, which is less cumbersome, requires less time, and does not involve blood sampling. Briefly, DTPA is drawn up into a syringe, a 1-min preinjection measurement of the amount of radioactivity in the syringe is made, it is rapidly injected intravenously, a 1-min postinjection measurement of the empty syringe is made, and serial images of both kidneys are acquired at 1-min intervals between 1 and 3 min postinjection. The 2–3-min interval is the best time for GFR measurement. Both total and fractional GFR can be estimated. The entire duration of the study is less than 10 min.
The camera-only technique was described by Gates who compared DTPA measurements of GFR to 24-h creatinine clearance values obtained for each patient. There was an excellent linear correlation (r 2 > 0.9) between the two measurements across a wide range (1–113 mL/min) of renal function. The DTPA study was repeated 24–48 h later, and a remarkable correlation coefficient (99 %) with the first study confirmed the technique’s reproducibility [23]. Some studies suggest that99mTc-DTPA is not reliable for estimating GFR in young children [24, 25]. Chandhoke et al. reported significant inaccuracy in estimation of GFR when compared to clearance of continuously infused iothalamate in children. They postulated that this may be due to the fact that the adult renal depth correction used in the Gates method may not be applicable to children [26].
Renal Cortical Scintigraphy
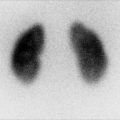
The very high uptake of99mTc-DMSA by the pars recta of the proximal tubules and its minimal glomerular filtration and loss in the urine allows for detailed images of the renal cortex (Fig. 6.1). Traditionally,99mTc-DMSA cortical imaging has been used to delineate areas of cortical hypoperfusion that accompany acute pyelonephritis and also to demonstrate renal scarring from prior infections. Lesions associated with acute pyelonephritis appear as areas of photopenia, with preservation of the normal renal contour. In contrast, renal cortical scars appear as wedge-shaped areas of photopenia which distort the renal contour (Fig. 6.2). This information can aid in surgical planning and has been proposed to identify patients who should be screened for vesicoureteral reflux, the so-called top-down approach [27, 28].
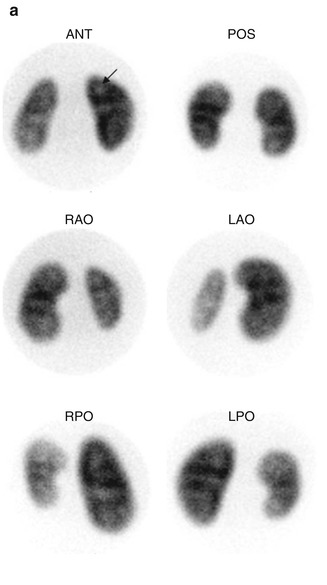
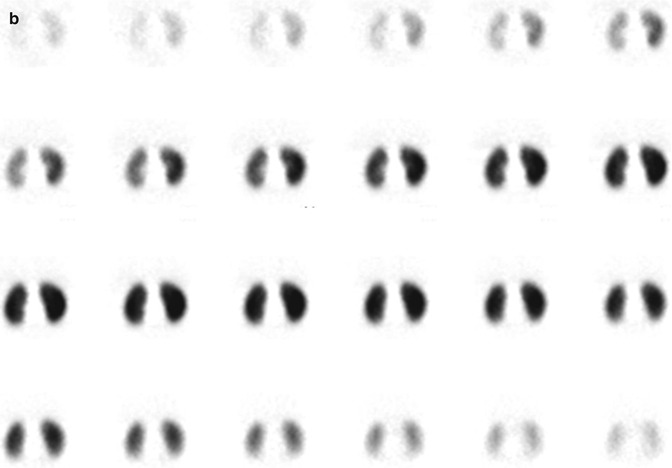
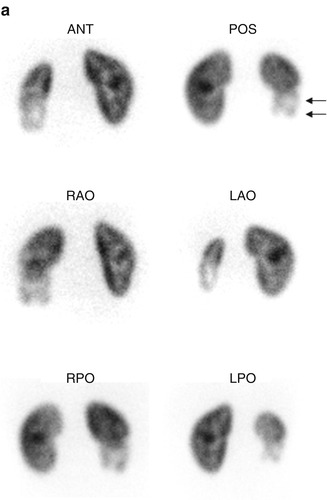
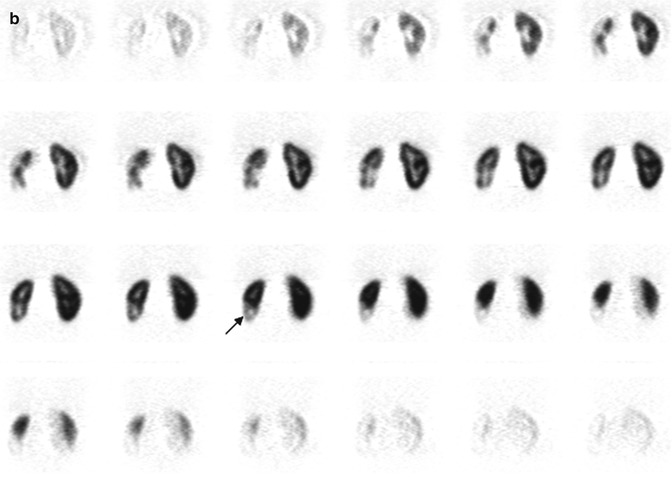
Fig. 6.1
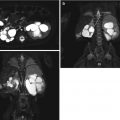
Normal DMSA renal cortical study. (a) There is homogeneous distribution of activity throughout both kidneys on the pinhole images. The discrete round areas of decreased activity (arrow) are the calyces. The pinhole collimator distorts apparent organ size, which is why in some of the views, one kidney appears larger than the other. The coronal SPECT images (b) demonstrate homogeneous distribution of activity throughout the cortex of both kidneys. Note that unlike their appearance on the pinhole images, the kidneys are similar in size (With respect to the orientation of the SPECT images, the anterior most aspect of the kidneys is in the upper left image, and the posterior most aspect is in the lower right image)
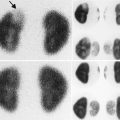
Fig. 6.2
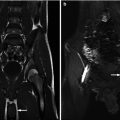
Renal cortical scarring. Pinhole images (a) demonstrate an area of decreased tracer uptake with associated cortical volume loss (arrow), in the lower pole of the right kidney. On the coronal SPECT images (b), the right lower pole abnormality is equally well seen. In addition, the right kidney is smaller than the left
99mTc-DMSA cortical scintigraphy also can provide information about differential renal function (Fig. 6.3). However, because it is filtered to a small degree, and blood clearance occurs over a period of hours, variations in renal DMSA uptake are not always equivalent to true variations in function. Thus,99mTc-DMSA should not be used to estimate absolute renal function or GFR [29].
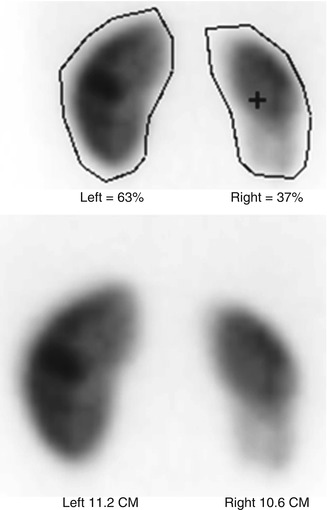
Fig. 6.3
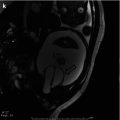
When performing renal cortical scintigraphy, it also is possible to determine differential (split) renal function and to measure renal size
Description of Technique for99mTc-DMSA Cortical Scintigraphy
In an effort to standardize reporting and methodology for renal cortical scintigraphy, several consensus statements and procedure guidelines have been issued, but there is still some variation in the timing of image acquisition (1.5–4 h postinjection), the need for sedation, type of views (planar and pinhole magnification vs. SPECT), and reporting of results [30, 31]. For clarity, the described technique is that of the Society of Nuclear Medicine Guideline publication in 1997, with some recent modifications by Zeissman et al. [31]. Single-photon emission computed tomography (SPECT) imaging will be described separately as there is considerable disagreement as to its utility versus standard planar and pinhole magnification images and also serious difficulties in multicenter standardization [31–34].
A large or standard field of view gamma camera equipped with a parallel-hole high-resolution collimator and/or a pinhole collimator with a 4 mm aperture is recommended. The patient is placed supine for parallel-hole imaging and prone for pinhole imaging. Imaging can begin at 1.5–2 h postinjection, although superior image quality is obtained by waiting at least 4 h [31, 35]. Classically, images are acquired in the posterior and the left and right posterior oblique planes. Differential function is calculated from the posterior planar view using the parallel-hole collimator. Background correction can be undertaken by selecting a region of interest (ROI) around both kidneys in the planar projection and then drawing circumferential background regions approximately 2 pixels in width and 2 pixels away from the kidney. Acquisition time for the images varies by technique, with pinhole magnification requiring fewer counts (150,000 vs. 300,000) but longer acquisition time than the parallel-hole collimator (10 min vs. 5 min). For pinhole images, the kidney should fill approximately 2/3 of the field of view. In cases of significant hydronephrosis, furosemide can be given and/or delayed images can be performed up to 24 h after injection of radiotracer.
Various techniques have been described to adequately image the cortex; most centers rely on pinhole magnification to properly delineate renal scarring and acute pyelonephritis. These images should be correlated with other imaging modalities such as ultrasonography and voiding cystography, when available. A sample grading protocol used in the RIVUR trial is described in Table 6.3 in which the renal cortex is divided into numbered segments and severity graded by the quantity of segments involved [31].
Table 6.3
Sample grading system for renal cortical scarring in99mTc-DMSA scans (Zeissman et al. [31])
Grade | Severity | Number of affectedrenal segments |
|---|---|---|
0 | Normal | 0 |
1 | Mild | 1–2 |
2 | Moderate | 3–4 |
3 | Severe | >4 |
4 | Global atrophy | Diffuse scarring |
SPECT Versus Standard Planar/Pinhole Imaging
Single-photon emission computed tomography, or SPECT, provides a panoramic multi-image view of both kidneys versus the standard three views of planar and pinhole magnification. Some suggest that SPECT is more sensitive and easier to interpret than planar and pinhole images. Other disagree contending that SPECT is less specific than planar and pinhole imaging. In an international multicenter survey of nuclear medicine experts, SPECT was performed routinely by only 22 % of respondents and seldom performed by 45 % of respondents and never used by 33 % of the respondents [30]. Further complicating matter is the absence of an accepted standard technique, with several authors reporting a range of projections (60–120) and varying increments of scanning time [35–37].
Interobserver Variability in SPECT and Planar99mTc-DMSA Cortical Scintigraphy
99mTc-DMSA planar imaging has been shown to have excellent interobserver agreement in several reports using various measures. Consensus opinion regarding “normal” and “abnormal” among expert observers was 93.5 % and 90.5 %, respectively [38, 39]. While the reliability and reproducibility of planar and pinhole imaging is well established, little has been published on SPECT interobserver agreement, and the absence of a standard acquisition protocol hinders accurate comparisons among studies. Craig et al. suggest decreased reproducibility and interobserver agreement in interpretation of SPECT images compared to planar images [40]. Cost also can be a factor; by one estimate, SPECT costs up to 36 % more to perform than planar imaging. This is presumably due to longer image acquisition times and a possible greater need for sedation [41].
SPECT Versus Planar/Pinhole Magnification Imaging Animal Models
In comparison to standard planar and pinhole imaging, SPECT is comparable, possibly at the expense of decreased specificity and higher false-negatives. The performance of standard planar and pinhole magnification DMSA cortical imaging in the diagnosis of acute pyelonephritis has been widely investigated, and most authors agree on a sensitivity around 90 % and specificity between 90 and 100 % [42, 43].
Craig et al. report the results of a meta-analysis of published animal trials evaluating the overall ability of99mTc-DMSA cortical scintigraphy to diagnose acute pyelonephritis. He initially found an average sensitivity of 84 % and an average specificity of 88 %; however, after correcting statistical errors and excluding some unusable data, there were no significant difference between SPECT and planar imaging [41].
In one elegantly designed study correlating histopathology and cortical scintigraphy in piglets, Majd et al. directly compared SPECT and pinhole imaging for detection of pyelonephritis 1–10 days after infection. After evaluating all zones of pyelonephritis over the entire time period, SPECT carried a sensitivity of 91 % vs. 86 % for pinhole imaging but was less specific, 82 % vs. 95 % compared to planar imaging. Overall accuracy was similar for both techniques, 88 % for SPECT and 90 % for pinhole imaging (Table 6.4) [42].
Sensitivity (%) | Specificity (%) | Accuracy (%) | |
|---|---|---|---|
Pinhole magnification | 90 | 95 | 92 |
SPECT | 96 | 95 | 96 |
Rossleigh et al. compared SPECT to standard planar imaging in the diagnosis of renal cortical scarring in a refluxing piglet model with post-study histopathologic confirmation. Each animal after VCUG-confirmed VUR and99mTc-DMSA-confirmed pyelonephritis underwent another planar99mTc-DMSA and SPECT scan 3 months later. They reported similar sensitivity, specificity, and overall accuracy between planar images, pinhole magnification, and SPECT (Table 6.5) [34].
Sensitivity (%) | Specificity (%) | Accuracy (%) | |
|---|---|---|---|
Pinhole magnification | 74 | 99 | 92 |
SPECT | 59 | 98 | 87 |
SPECT Versus Planar Imaging for Detecting Pyelonephritis
There are several human studies demonstrating the ability of SPECT to detect more renal lesions in acute pyelonephritis and renal cortical scars than planar and pinhole imaging. Tarkington et al. compared the ability of SPECT and pinhole imaging to detect renal cortical defects of various etiologies in 33 children, about 60 % of who did not have UTI, VUR, or prior pyelonephritis. In this heterogeneous population, 63 % of the pinhole image studies read as “normal” were found to have cortical abnormalities on SPECT. They also found that SPECT “clarified or enhanced” the pinhole imaging in 71 % of the kidneys studied. Overall SPECT found 55 % more cortical defects than pinhole imaging [44]. Yen et al. compared SPECT to planar imaging in 27 infants and 17 children upon diagnosis of acute pyelonephritis and at 3 months posttreatment and found SPECT identified significantly more scarring than planar imaging (33 % vs. 9.5 %, p < 0.05) at 3 months, particularly in the presence of high-grade VUR than those found using planar imaging [36]. The prospective data of Applegate et al. seem to confirm prior human studies that SPECT detects more “definite” lesions than pinhole and planar images. Cortical defects were classified as “possible” or “definite” and “single” or “multiple” as defined by a consensus of three blinded experts. However, they found that no technique was superior for detecting multiple as opposed to solitary defects [32].
SPECT Versus Planar/Pinhole Imaging Summary
Data from studies in human subjects seem to corroborate previous animal studies that demonstrate increased sensitivity with SPECT, but without histopathologic analysis, false-positives cannot be excluded with certainty. As such, the pooled data from the animal studies is slightly less impressive but probably more accurate than that reported in human subjects. Regardless of technique, the performance of99mTc-DMSA renal cortical scintigraphy in the diagnosis of acute pyelonephritis and the detection of renal cortical scarring is excellent. At best, SPECT is slightly more sensitive than, and is comparable in specificity to standard pinhole imaging. It seems that the combination of SPECT and pinhole imaging may improve interobserver agreement and may be more useful than either test alone.
Description of Technique for Diuretic Nuclear Renography
In 1992 the Society for Fetal Urology and the Pediatric Nuclear Medicine Council released a consensus statement regarding performance of the “well-tempered diuretic renogram” in response to a lack of standardization of technique and interpretation of dynamic renal imaging. However, this protocol has not been adopted universally, and debate continues regarding such technical aspects as method of pretest hydration, need for urethral catheterization, timing of diuretic administration, and even the method of calculation of urinary drainage [45, 46].
Patient Preparation
The infant kidney continues to mature, and GFR continues to increase for the first year of life which is reflected in the child’s ability to clear99mTc-MAG3 from the plasma [47]. In general, diuretic renography should be performed after the child is at least 1 month of age to limit spurious prolongation of drainage and a potentially inadequate response to diuretic challenge due to immature renal tubules [46]. Oral hydration is encouraged, and IV hydration is provided as a 15 mL/kg bolus of D5 0.3NS or D5 0.25NS 15 min prior to injection of radiotracer. Maintenance intravenous fluid is provided throughout the study. A urethral catheter for constant bladder drainage decreases the radiation dose to the bladder wall and gonads and also minimizes impedance of antegrade flow of urine from the collecting system simulating delayed drainage.
Renogram Phase
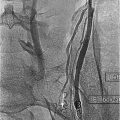
99mTc-MAG3 is administered intravenously with the child placed in supine position and the gamma camera under the bed. The field of view should include the heart, kidneys, ureters, and the bladder. Digital images are collected at 20 s/frame, and analog images are recorded for 30 min with practitioner preference determining the timing. A typical renogram acquisition is 1- or 2-min image intervals for 30 min (Fig. 6.4).
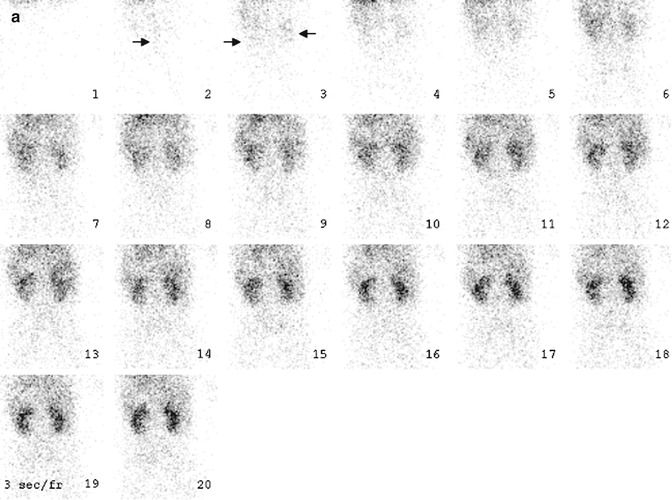
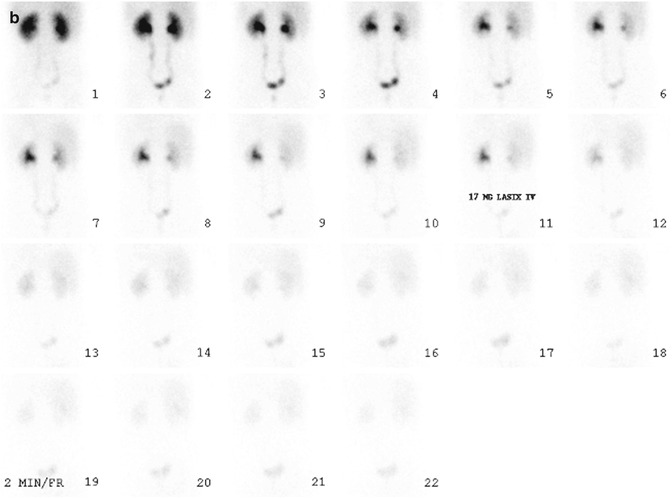
Fig. 6.4
Normal diuretic renography. On the flow phase (a) of the study, the abdominal aorta (arrow) appears in frame 2. The kidneys (arrows) are seen about 3 s later, in frame 3. Visualization of the kidneys within 2–3 s after visualization of the abdominal aorta generally is equated with normal renal perfusion. In the case of the renal transplant (not shown), the kidney should appear within 2–3 s after the iliac artery is seen. On the functional phase (b) of the study, the kidneys are similar in size, and there is prompt appearance of activity in the collecting systems and urinary bladder. Adequate hydration is important to the success of diuretic renography. Activity should appear in at least one of the collecting systems within 3–5 min after radionuclide injection. Alternatively bladder activity should appear within 10 min after injection. In this patient, activity is clearly seen in both collecting systems and the urinary bladder on frame 1 or about 3 min after injection
For accurate estimation of split renal function during the renogram phase, care must be taken when selecting the region of interest (ROI). This can be done manually or with computer assistance in a semiautomated or fully automated fashion. Regardless, the ROI must encompass the entire kidney including the renal pelvis. The background ROI should be approximately 2 pixels wide and encircle the renal ROI. Acquisition time should be a minimum of 20–30 min. To calculate differential renal function (DRF), the total counts of the renogram curve for each kidney minus the background counts are calculated during the interval from 60 s post tracer injection until the appearance of activity in the collecting system. Usually this is within the first 60–120 s of the study. There are several methods used to estimate DRF, but the two most commonly employed are the integral method where area under the renogram curve is calculated and the Rutland-Patlak plot which relies on the mean slope of the ascending renogram curve. In most situations, both methods are thought to be equivalent [48].
Controversy exists over the so-called “supranormal” functioning kidney, split renal function of ≥55 % in unilateral hydronephrotic kidneys, which has a prevalence of 4–21 % [49–53]. Various explanations have been proposed, including compensatory hyperfunction, artifact related to background correction [49, 53], or variation in the method of quantification of function [50, 54]. Reports of laterality are variable.
Diuretic Phase
Furosemide at a dose of 1 mg/kg (max 40 mg) for children <1 year and 0.5 mg/kg for children >1 year is given IV after completion of the renogram phase, usually at 20–30 min (F + 20–30) or when the collecting system is thought to be full. Other centers advocate simultaneous administration of tracer and diuretic (F0) in cases of known hydronephrosis [55]. To ensure uniform distribution of radiotracer throughout the collecting system, the child may be placed prone or in the sitting position to maximize drainage. In the setting of hydronephrosis, the ROI for the diuretic time-activity curve should only include the renal pelvis and collecting system. The background ROI should circumscribe the kidney excluding the hilum. For children with hydroureteronephrosis, the ROI for the diuretic time-activity curve should be placed around the dilated renal pelvis with a separate ROI circumscribing the ureter to the level of the UVJ making sure to exclude the urinary bladder.
Related posts:
Stay updated, free articles. Join our Telegram channel

Full access? Get Clinical Tree


