(1)
Department of Medical Imaging, Linkou Chang Gung Memorial Hospital, Taoyuan, Taiwan
(2)
Department of Medical Imaging and Radiological Sciences, Institute of Radiological Research Chang Gung University, Taoyuan, Taiwan
4.1 Clear Cell Renal Cell Carcinoma
Case 1
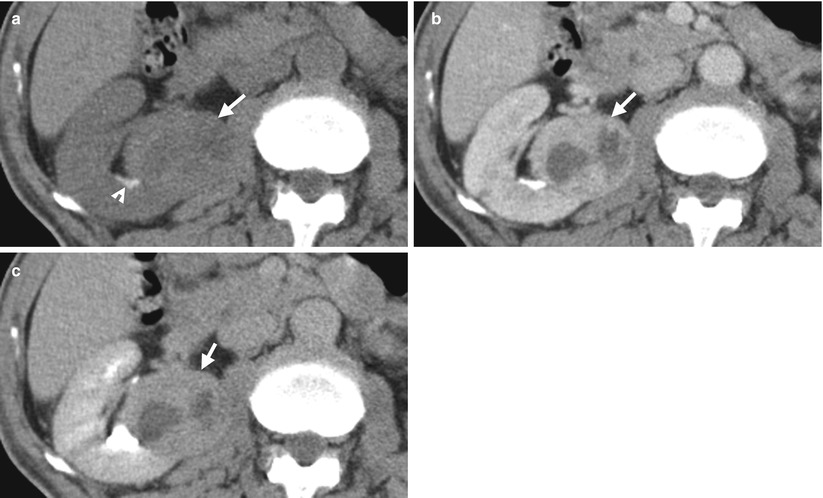
Fig. 4.1
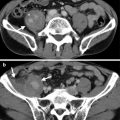
Renal computed tomography (CT) shows imaging findings of a clear cell renal cell carcinoma. Unenhanced renal axial CT image (Fig. 4.1a) shows a right tumor (arrow) of heterogeneous density. Enhanced renal CT images (Fig. 4.1b, c) show this renal tumor (arrows) with obvious enhancement of its solid part at the late enhanced phase (Fig. 4.1b) and slight fading out of enhancement at the excretory phase (Fig. 4.1c). The low-density part in this tumor showing no enhancement represents necrosis. There is a stone (arrowhead, Fig. 4.1a) adjacent to the right renal tumor.
Case 2
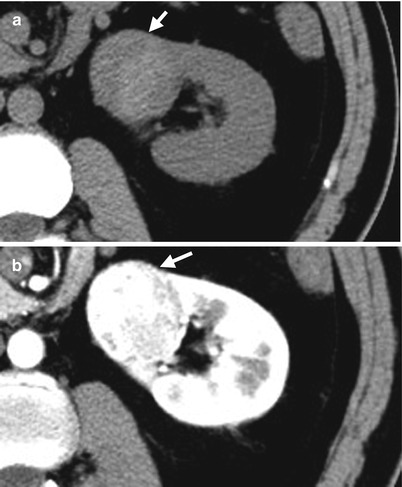
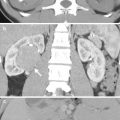
Fig. 4.2
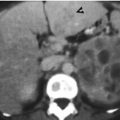
Renal computed tomography (CT) illustrates a left renal cell tumor of clear cell type. Unenhanced axial CT (Fig. 4.2a) shows a right renal solid tumor (arrow) with slight heterogeneous density. Enhanced axial CT of corticomedullary phase (Fig. 4.2b) shows strong but heterogeneous enhancement of this tumor (arrow). The strong enhancement part of this tumor on corticomedullary phase is as highly dense as that of the enhanced renal cortex.
Case 3
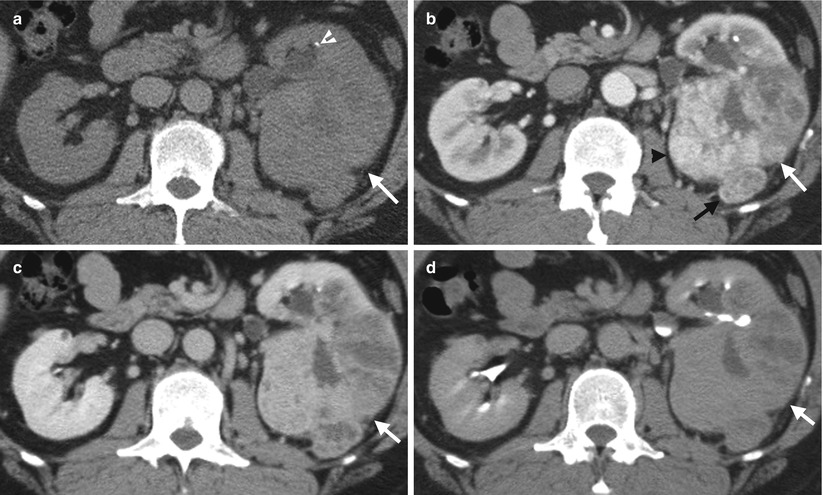
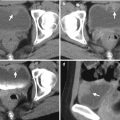
Fig. 4.3
Renal computed tomography (CT) shows a left clear cell renal cell carcinoma (cRCC) with left perinephric extension. Axial unenhanced (Fig. 4.3a), enhanced corticomedullary phase (Fig. 4.3b), enhanced nephrographic phase (Fig. 4.3c), and enhanced excretory phase (Fig. 4.3d) CT images show a large left renal tumor with heterogeneous density on all unenhanced and enhanced phases. This large tumor has a focal protrusion (black arrow) into the left perinephric space, suggestive of perinephric tumor invasion. The tumor has the strongest enhancement on corticomedullary phase and becomes gradually less enhanced on nephrographic phase and least enhanced on excretory phase. The most enhanced part (black arrowhead, Fig. 4.3b) of this tumor of corticomedullary phase is nearly isodense to that of renal artery and renal cortex. There is a left renal stone (white arrowhead, Fig. 4.3a).
Case 4
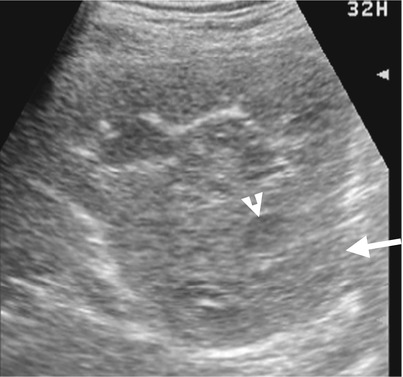
Fig. 4.4
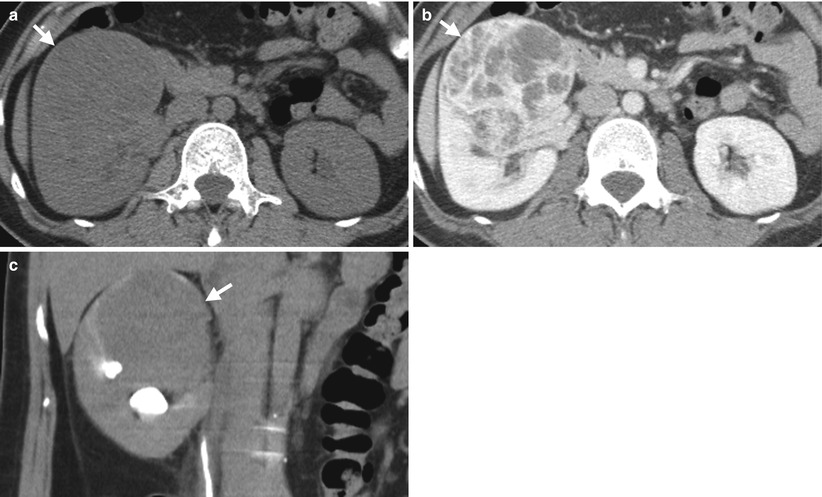
Fig. 4.5
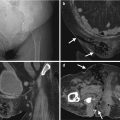
Renal ultrasound (US) and computed tomography (CT) show a clear cell type of renal cell carcinoma (RCC) in the right kidney. Right renal ultrasound (Fig. 4.4) shows a solid tumor (arrow) with internal hypoechoic region (arrowhead). Unenhanced axial CT (Fig. 4.5a) shows a homogeneous density tumor (arrow) at the anterior part of the right kidney. Enhanced axial CT of nephrographic phase (Fig. 4.5b) shows very heterogeneous enhancement of this tumor (arrow) simulating a multilocular appearance but with enhancing soft tissue part. Enhanced coronal CT of excretory phase (Fig. 4.5c) shows this tumor (arrow) at the right renal upper pole with compression on the right renal calyces.
Case 5
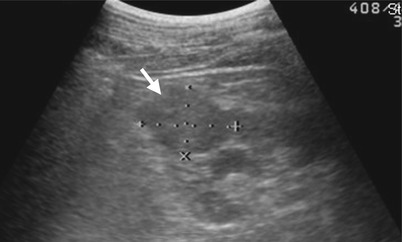
Fig. 4.6
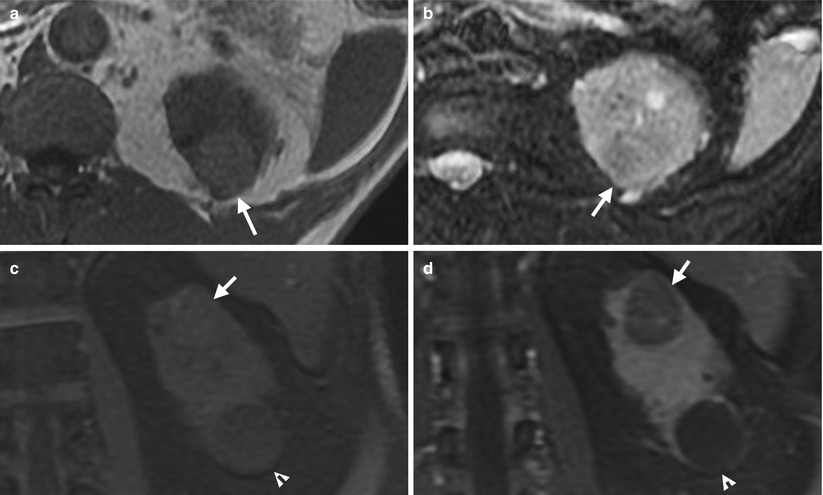
Fig. 4.7
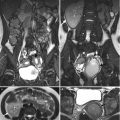
Renal ultrasound and magnetic resonance imaging (MRI) show a right clear cell renal cell carcinoma. Right renal ultrasound (Fig. 4.6) shows an isoechoic tumor (arrow) with protruding appearance. Unenhanced axial T1-weighted image (T1WI) of MRI (Fig. 4.7a) shows a left renal tumor (arrow) with hyperintensity to the renal parenchyma. Unenhanced axial T2-weighted image (T2WI) of MRI (Fig. 4.7b) shows slightly lower signal intensity of the tumor (arrow) to the renal parenchyma. Unenhanced coronal T1 fat-suppressed (T1FS) image of MRI (Fig. 4.7c) shows a tumor (arrow) at the right renal upper pole with no signal drop after fat-suppression technique. Enhanced coronal T1 fat-suppressed image of MRI (Fig. 4.7d) shows heterogeneous enhancement of the tumor (arrow). There is a cyst (arrowhead) at the left renal lower pole.
Case 6
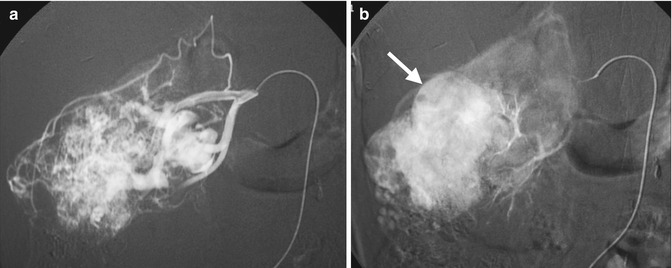
Fig. 4.8
Renal arteriography shows typical imaging findings of a clear cell carcinoma of the right kidney. Right renal arteriography at arterial phase (Fig. 4.8a) shows numerous and dilated tumor vessels in a right renal tumor, suggestive of high vascularity. Right renal arteriography at parenchymal phase (Fig. 4.8b) shows obvious tumor stain (arrow) of this renal tumor.
Key Diagnostic Features
Clear cell renal cell carcinoma (cRCC) is the most common subtype of renal cell carcinoma, which is also regarded as “conventional” RCC. Von Hippel-Lindau disease and tuberous sclerosis complex are associated with cRCC [1]. cRCC typically shows heterogeneous density, especially after contrast enhancement [2]. The strongest enhancement of cRCC appears on corticomedullary phase. cRCC compared to papillary and chromophobe renal cell carcinomas (ChRCCs) is usually larger in size and has more local extension, vascular invasion, and distant metastasis to the adjacent structure [3]. cRCC is more common to have cystic degeneration, necrosis, and hemorrhage than other subtypes. The signal intensity of cRCC on MRI depends on the presence or absence of hemorrhage, necrosis, and cystic change in the tumor [3]. cRCC usually appears as an isointense tumor of the renal parenchyma on T1-weighted image and a high-intensity tumor on T2-weighted images, especially in the necrotic or cystic parts [3]. Nonetheless, cRCC also appears as a hypointense mass on T2-weighted image occasionally [3]. For a cRCC containing cytoplasmic fat, signal drop on out-of-phase image is noted as compared with in-phase image on MRI [3].
4.2 Chromophobe Renal Cell Carcinoma
Case 7
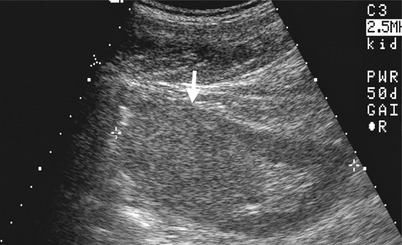
Fig. 4.9
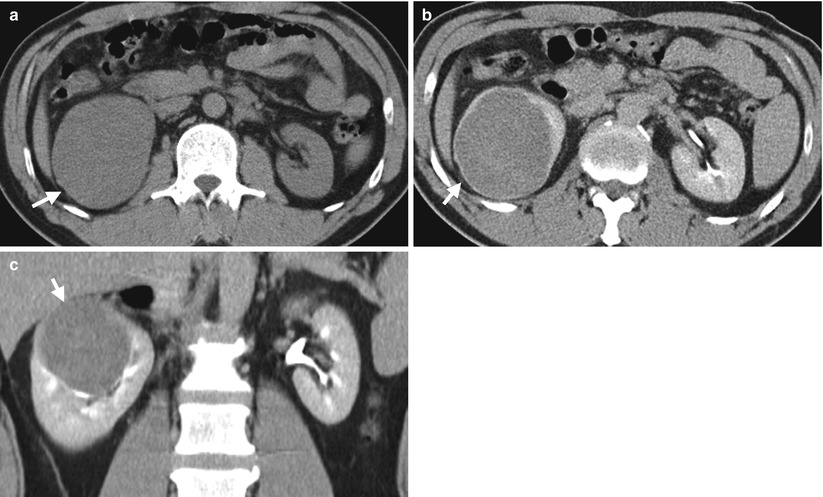
Fig. 4.10
Renal ultrasound and computed tomography (CT) shows imaging findings of a chromophobe renal cell carcinoma (ChRCC) in the right kidney. Right renal ultrasound (Fig. 4.9) shows an isoechoic homogeneous mass (arrow) on the right renal upper pole protruding into the renal sinus. Unenhanced axial CT image (Fig. 4.10a) shows enlargement of the right renal upper pole (arrow) with homogeneous density. Enhanced axial (Fig. 4.10b) and coronal CT (Fig. 4.10c) images of excretory phase show homogeneous enhancement of a right renal tumor (arrows) with displacement of the adjacent renal calyces. Right nephrectomy reveals a ChRCC of 8.5 cm in size but confined in the right kidney.
Case 8
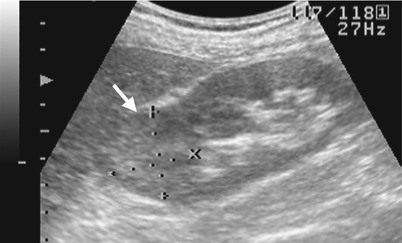
Fig. 4.11
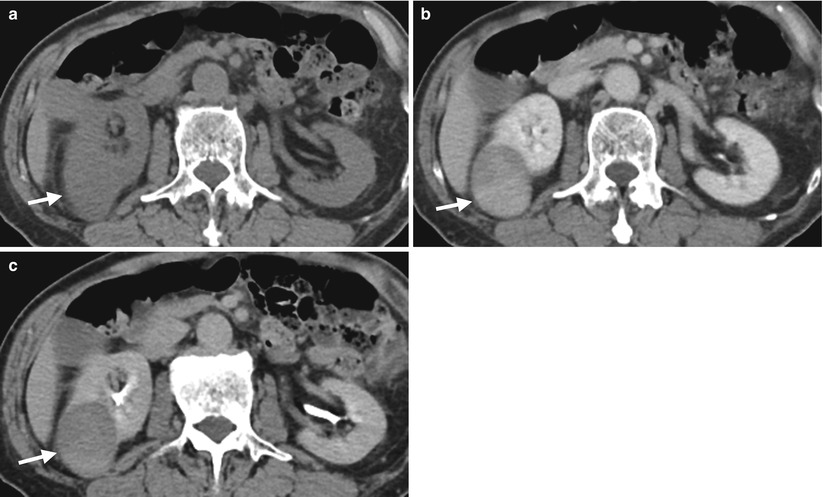
Fig. 4.12
Renal ultrasound and computed tomography (CT) illustrate a right renal chromophobe renal cell carcinoma. Right renal ultrasound (Fig. 4.11) shows exophytic right renal tumor (arrow) with predominantly homogeneous echogenicity which is slightly higher than that of renal parenchyma. Axial unenhanced image (Fig. 4.12a), enhanced image of nephrographic phase (Fig. 4.12b), and enhanced image of excretory phase (Fig. 4.12c) on CT show a right renal solid tumor (arrows) that is isodense to the renal parenchyma on unenhanced phase and has roughly homogeneous enhancement on enhanced nephrographic phase. The enhancement of this tumor (arrow, Fig. 4.12c) is decreased at excretory phase but remains homogeneous.
Case 9
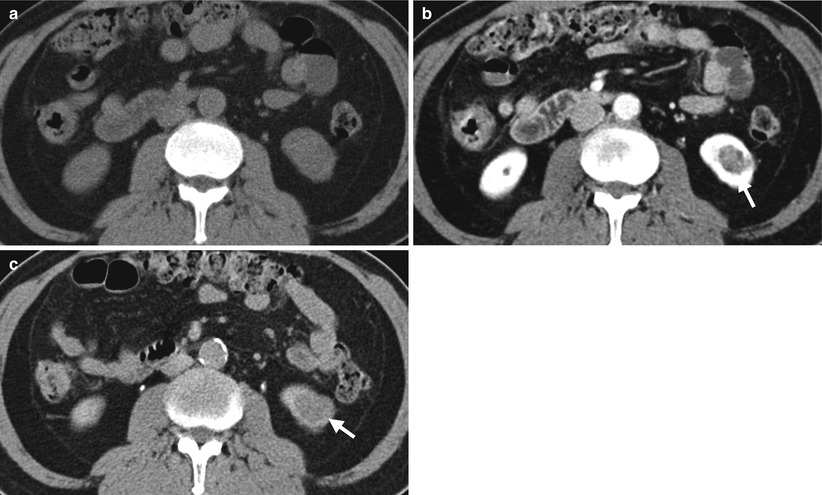
Fig. 4.13
Renal computed tomography (CT) shows a small left renal chromophobe renal cell carcinoma. Axial unenhanced image (Fig. 4.13a) enhanced image of nephrographic phase (Fig. 4.13b), and enhanced image of excretory phase (Fig. 4.13c) show a small left renal tumor (arrows) with the strongest enhancement at nephrographic phase. The tumor is undetectable on unenhanced image by its same density as that of normal parenchyma.
Key Diagnostic Features
Chromophobe renal cell carcinoma (ChRCC) is less common than clear cell and papillary subtypes of renal cell carcinomas. Among the abovementioned subtypes of renal cell carcinomas, ChRCC has the best prognosis. ChRCC is usually a hypovascular tumor [3]. ChRCC is characterized by homogeneous enhancement; however, the reported frequency of this characteristic is variable from 46 to 75 % in the literature [4]. The peak enhancement of ChRCC on computed tomography (CT) usually occurs in nephrographic phase, and its enhancement is usually less than that of clear cell subtype but higher than papillary enhancement [2]. Magnetic resonance imaging (MRI) is usually served as a complimentary imaging modality for problem solving of renal masses. ChRCC could present similar findings as that of clear cell renal cell carcinoma on magnetic resonance imaging (MRI). ChRCC may sometimes have necrosis, cystic change, or calcifications shown on CT or MRI [3, 4]. ChRCC may show central scar or spoke wheel appearances similar to those of renal oncocytomas [3]. ChRCC and renal oncocytomas also have common histological features on hematoxylin-eosin stain [3]. Tumor cells diffusely positive for Hale’s colloidal iron stain support the histological diagnosis of ChRCC rather than renal oncocytomas.
4.3 Papillary Renal Cell Carcinoma
Case 10
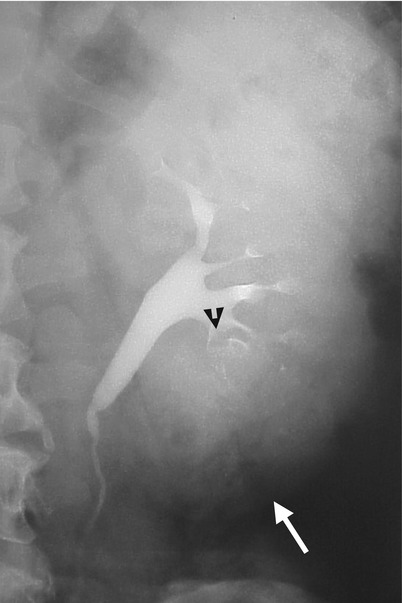
Fig. 4.14

Fig. 4.15
Excretory urography (EU) and renal computed tomography (CT) illustrate a papillary renal cell carcinoma (pRCC) at the left renal lower pole. Magnification view of the EU of the left kidney at 10 min after contrast medium administration (Fig. 4.14) shows a space-occupying lesion at the left renal lower pole, supported by a mass effect on the left renal lower calyces (arrowhead) and abnormal long distance between the left renal lower polar contour (arrow) and lower calyces. Unenhanced (Fig. 4.15a) and enhanced (Fig. 4.15b) axial CT images show a large papillary renal cell carcinoma (arrows) with heterogeneous enhancement after contrast medium administration by the presence of intratumoral necrosis.
Case 11

Fig. 4.16
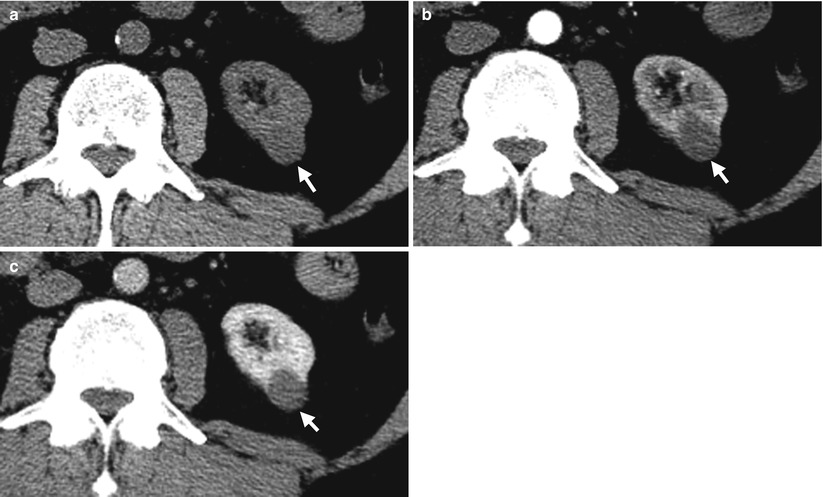
Fig. 4.17
Renal ultrasound and computed tomography (CT) show imaging findings of a small papillary renal cell carcinoma. Left renal ultrasound (Fig. 4.16) shows a small hyperechoic tumor (arrow). Unenhanced axial CT image (Fig. 4.17a), enhanced axial CT image of corticomedullary phase (Fig. 4.17b), and enhanced axial CT image of nephrographic phase (Fig. 4.17c) show a left renal tumor (arrows) of homogeneous enhancement. However, the enhancement of the tumor is less than that of the renal cortex on corticomedullary phase (Fig. 4.17b) and of renal parenchyma on nephrographic phase (Fig. 4.17c), respectively. The enhancement of this tumor is most conspicuous on nephrographic phase.
Case 12
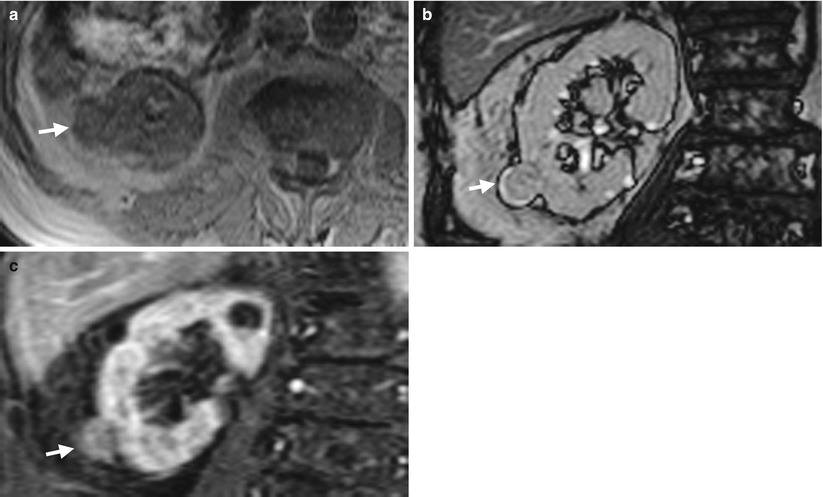
Fig. 4.18
Renal magnetic resonance imaging (MRI) shows a small papillary renal cell carcinoma in the right kidney. Axial unenhanced T1-weighted image (Fig. 4.18a), coronal unenhanced T2-weighted image by gradient echo (Fig. 4.18b), and coronal enhanced T1 fat-suppressed image (Fig. 4.18c) show a papillary renal cell carcinoma (arrows) presenting similar signal intensity on T1- and T2-weighted images. The tumor has an enhancement degree less than that of the renal cortex. The right kidney has poor differentiation of the cortex and medulla on T1-weighted image (Fig. 4.18a) due to poor renal function.
Key Diagnostic Features
Papillary renal cell carcinoma (pRCC) is the next most common subtype of renal cell carcinoma [1]. pRCC is usually a small solid tumor which is confined in the kidney at presentation [3]. pRCC is usually less enhanced than clear cell and chromophobe renal cell carcinomas on computed tomography (CT), and its peak enhancement occurs in nephrographic phase in general [2]. pRCC smaller than 3 cm is more likely to have homogeneous enhancement on enhanced CT. On the other hand, pRCC larger than 3 cm usually appears as a heterogeneously enhanced mass with the presence of hemorrhage or necrosis [5]. On angiography, pRCC is a hypovascular or avascular tumor [6]. On renal ultrasound, renal cell carcinomas could present as hyperechoic, isoechoic, or hypoechoic masses, regardless of the subtypes [5]. Hyperechoic appearance is most commonly seen in small renal cell carcinomas, which may have similar appearances as those of renal angiomyolipomas [5]. On magnetic resonance imaging (MRI), pRCC usually shows a tumor with low signal intensity similar to or lower than those of renal parenchyma on both T1-weighted and T2-weighted images [5]. The enhancement pattern and degree of MRI in pRCC are similar to that seen on CT. Pseudocapsule of pRCC is more frequently seen on MRI than on CT [5].
4.4 Collecting Duct Carcinoma
Case 13

Fig. 4.19
Computed tomography (CT) shows imaging characteristics of a left renal collecting duct carcinoma. Enhanced coronal (Fig. 4.19a) and axial CT images at left renal vein (Fig. 4.19b), left renal midportion (Fig. 4.19c), and left renal lower pole levels show a large and heterogeneous enhancing tumor (white arrows) occupying nearly the whole left kidney with preserved reniform. This left renal tumor extends to the left para-aortic and aortocaval areas (white arrowheads) as well as the left paraspinal area with the involvement of the left psoas muscle (black arrows). There is thrombosis (black arrowheads) in the left renal vein and the inferior vena cava (IVC). A metastatic tumor is depicted at the right lobe of the liver (Fig. 4.19a). Bony metastasis of the spine is illustrated in Fig. 4.19b. Histological examination of biopsy specimen of the left renal tumor reveals collecting duct carcinoma.
Key Diagnostic Features
Collecting duct carcinomas usually show distant metastasis and a large infiltrative renal tumor with preserved reniform at presentation [3]. Heterogeneous enhancement, hemorrhage, and necrosis on computed tomography (CT) are common findings of collecting duct carcinoma. It is one histological subtype of renal cell carcinoma, which has even a poorer prognosis than clear cell subtype [3]. On magnetic resonance imaging, it usually shows low signal intensity on T2-weighted image but variable signal intensities on T1-weighted image [3].
4.5 Renal Cell Carcinoma with Perinephric Extension and Lymph Node Metastasis
Case 14
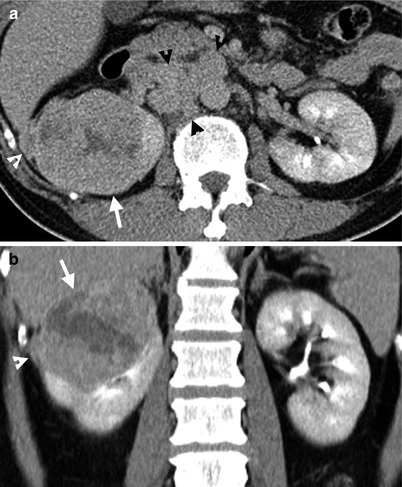
Fig. 4.20
Renal computed tomography (CT) shows imaging findings of a right renal cell carcinoma with right perinephric invasion and lymph node metastasis. Enhanced renal axial CT image (Fig. 4.20a) shows a right tumor (arrow) with heterogeneous enhancement. The tumor invades to the right perinephric space (white arrowhead). There are multiple enlarged lymph nodes (black arrowheads) anterior to the aorta and inferior vena cava or between them, representing lymph node metastasis. Surgical findings and histological examinations of right radical nephrectomy reveals a right renal cell carcinoma of clear cell type with perinephric extension and lymph node metastasis.
Key Diagnostic Features
Staging of renal cell carcinoma (RCC) is mostly commonly evaluated by computed tomography (CT) before surgery or for subsequent treatments. Perinephric tumor extension of RCC on CT is shown as (1) a focal tumor protrusion into the perinephric space which is still contiguous to the main tumor or (2) discrete perinephric nodules isolated from the main tumor. Increased perinephric stranding could be found in perinephric tumor invasion or RCC complicated with infection. Preservation and visualization of a thin layer of renal cortex on CT suggest that the tumor is still confined in the kidney. Regional lymph node metastasis from RCC usually occurs in the renal hilar area or adjacent to the aorta or inferior vena cava.
4.6 Cystic Renal Cell Carcinomas
Case 15
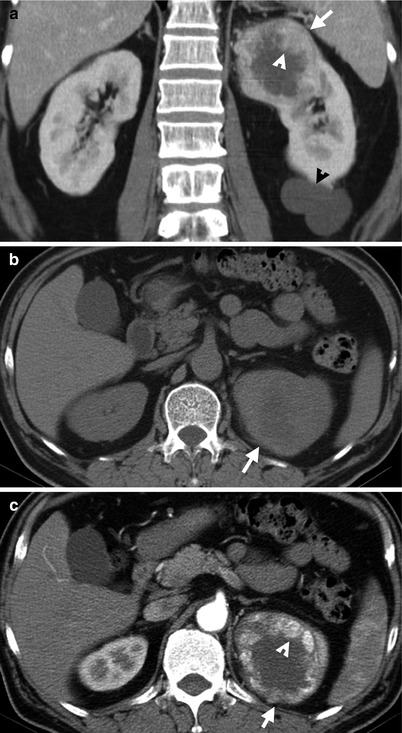
Fig. 4.21
Renal computed tomography (CT) shows imaging features of a cystic renal cell carcinoma (RCC). Unenhanced axial CT (Fig. 4.21a), enhanced axial CT (Fig. 4.21b), and enhanced coronal CT (Fig. 4.21c) images show a cystic mass (arrows) with enhancing soft tissue parts (arrowheads) contiguous to its wall, suggestive of an RCC. There is a renal cyst (black arrowhead) on the left renal lower pole as shown in Fig. 4.21c.
Case 16
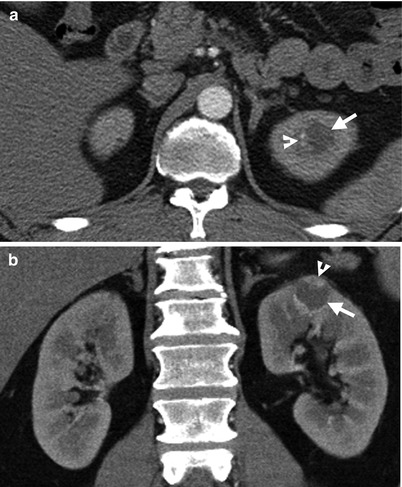
Fig. 4.22
Renal computed tomography (CT) illustrates imaging findings of a small cystic renal cell carcinoma (RCC). Enhanced axial (Fig. 4.22a) and coronal (Fig. 4.22b) CT images show a small cystic nodule (arrows) with a focal enhancing nodule (arrowheads). Left renal cystic RCC is considered. Histological examination of left partial nephrectomy for this tumor reveals an RCC of clear cell type with cystic degeneration.
Key Diagnostic Features
Cystic renal cell carcinomas (RCCs) are characterized by the presence of cystic areas in RCCs on images. Cystic areas in RCCs on images could represent massive necrosis or cystic degeneration in tumors. An RCC also could occur in a preexisting renal cyst which is most commonly seen in patients with autosomal dominant polycystic kidney disease (ADPKD) or acquired renal cystic disease (ACKD). Another kind of cystic RCCs is multilocular cystic RCC, showing multiple septa with resultant multilocular appearances. Nonetheless, the key points in diagnosing cystic RCCs rather than renal cysts upon imaging are detection of the enhancing soft tissue nodules or masses which could be contiguous to or independent of the tumor walls.
Main Differential Diagnoses
1.
Renal cysts
Renal cysts with or without complications could be differentiated from cystic RCCs by the lack of enhancing soft tissue nodules in the cystic masses.
4.7 Renal Small Cell Carcinoma
Case 17
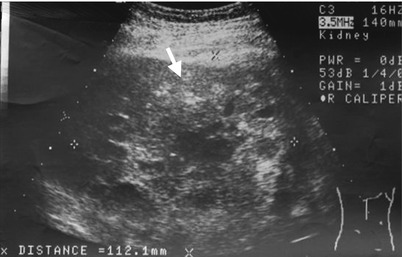
Fig. 4.23
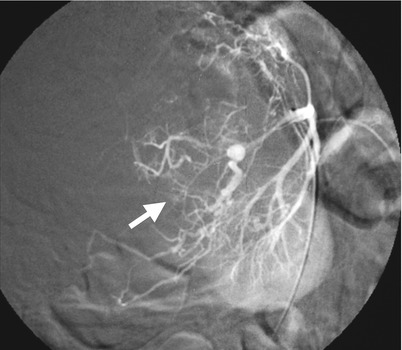
Fig. 4.24
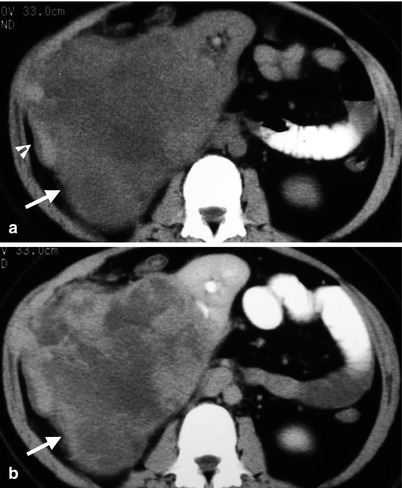
Fig. 4.25
Renal ultrasound, renal arteriography, and computed tomography (CT) images illustrate imaging findings of a small cell carcinoma (SmCC) at the right renal parenchyma. Right renal ultrasound (Fig. 4.23) shows a large tumor (arrow) with heterogeneous echogenicity. Right renal arteriography (Fig. 4.24) shows a tumor (arrow) with moderate vascularity and with tortuous and dilated tumor vessels. Unenhanced (Fig. 4.25a) and enhanced (Fig. 4.25b) axial renal CT show a right renal tumor (arrows) with peripheral hemorrhage (arrowhead, Fig. 4.25a), heterogeneous density, and heterogeneous enhancement. Obvious necrosis in the tumor is noted. The normal part of the right kidney is displaced anteriorly and toward midline by this large tumor. Histological examination of surgical specimen of right nephrectomy reveals an SmCC of the right renal parenchyma. There is no evidence of an SmCC of the lung survey. Thus, a primary renal SmCC is considered.
Case 18
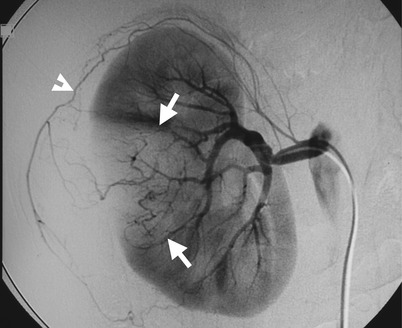
Fig. 4.26

Fig. 4.27
Renal arteriography and computed tomography (CT) illustrate imaging findings of a right renal parenchymal small cell carcinoma (SmCC) with spontaneous hemorrhage. Right renal arteriography (Fig. 4.26) shows a hypovascular tumor (arrows) and a space-occupying lesion beneath the right superior capsular artery (arrowhead). Unenhanced (Fig. 4.27a) and enhanced (Fig. 4.27b) axial renal CT show a heterogeneous density tumor (arrow) with right renal subcapsular hematoma due to spontaneous hemorrhage.
Key Diagnostic Features
Primary renal small cell carcinoma (SmCC) is rare [7]. Primary renal cell carcinoma could be considered only if there is no evidence of SmCC found in other parts of the body, especially of the lung. Renal SmCC could occur in the renal parenchyma with pure histology of SmCC or in the renal collecting system with mixed histology (usually SmCC mixed with urothelial carcinoma). Primary renal SmCC usually presents with bulky renal tumor which has heterogeneous echogenicity on ultrasound and heterogeneous density on computed tomography. Hemorrhage or necrosis is frequently seen in renal SmCC. Primary renal SmCC usually has extensive local infiltration or lymph node metastasis of advanced tumor stage on images at presentation [7].
4.8 Renal Sarcoma
Case 19
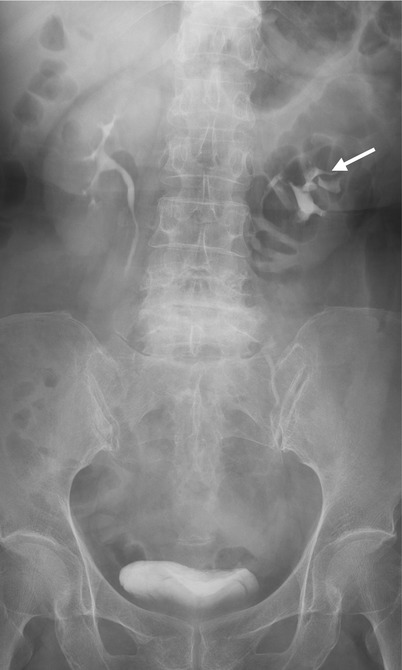
Fig. 4.28

Fig. 4.29
A patient with renal sarcoma depicted on excretory urography (EU) and computed tomography (CT) show a left renal sarcoma. Figure 4.28, EU shows mass effect on renal calyces (arrow), indicating the presence of a large space-occupying lesion. Figure 4.29a, unenhanced axial CT image shows a bulky solid tumor (arrow) at the upper pole of the left kidney with a small calcification; in Fig. 4.29b, enhanced axial CT images show mildly heterogeneous enhancement of the tumor (arrow) after contrast medium administration; and in Fig. 4.29c, enhanced coronal reformat image shows the renal tumor (arrow) protruding laterally and superiorly (arrowheads). Note the invasion of the tumor at the renal sinus of the left kidney in contrast to the preservation of the normal renal sinus fat in the right kidney upon CT.
Key Diagnostic Features
A renal sarcoma usually presents as a renal parenchymal bulky tumor with invasion to the renal sinus fat, renal collecting system, or perinephric space, which are better depicted by CT and MRI than by intravenous urogram (IVU) and sonography. In other words, renal sarcomas are commonly found in advanced stages. The loss of normal sinus fat contiguous to the tumor should alert the reader of the high probability of tumor invasion into the renal sinus. The renal sinus fat in a contralateral normal kidney could serve as a reference for comparison. Renal sarcomas are usually solid tumors with variable degrees of heterogeneous contrast enhancement, which mainly depends on the extent and size of necrotic parts in the tumor. Renal sarcomas are relatively rare. However, when encountering a bulky renal parenchymal tumor with rapid growth rate or obvious necrosis, a renal sarcoma should be taken into the list of differential diagnosis.
Related posts:
Stay updated, free articles. Join our Telegram channel

Full access? Get Clinical Tree


