Renal Perfusion Imaging with CT and PET
Sandrine Lemoine, MD, PhD
Laurent Juillard, MD, PhD
▪ Rationale
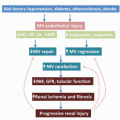
Perfusion and renal blood flow (RBF) are key determinant of renal function, altered in most kidney diseases. The ability to quantify accurately intrarenal blood flow would contribute substantially to our understanding of a variety of renal disease mechanisms. Nevertheless, this measurement is difficult to obtain noninvasively and in a manner applicable to humans. Indeed, in clinical practice, RBF can be estimated indirectly by the clearance of the para-aminohippuric acid (PAH), corrected for hematocrit and possibly PAH extraction. These corrections impair the accuracy of RBF measurement and make it unsuitable in cases of chronic renal failure. Moreover, PAH clearance provides only a two-kidney measurement of RBF and cannot be evaluated within periods of less than 30 minutes. These limitations have stimulated research for a method that would allow a direct measurement of RBF, with the ability to record regional perfusion, at least a single-kidney evaluation.
Functional imaging methods address these goals by measuring quantitatively and noninvasively renal perfusion and RBF, potentially with addition of a morphologic analysis. Moreover, some modalities such as multidetector computer tomography (MDCT) and position electron tomography (PET) can also measure either glomerular filtration rate (GFR) or oxidative metabolism. The choice of the initial imaging method depends on patient’s characteristics, local availability, and expertise.
▪ Renal Perfusion
The total RBF corresponds to about 20% of cardiac output (about 1 L/min) for about 1% of the total body weight. Renal perfusion is maximal in the cortex (420 mL/min/100 g) and minimal in the papilla (50 mL/min/100 g). In comparison, perfusion of the heart is approximately 84 mL/min/100 g and perfusion of the liver is 58 mL/min/100 g in dogs.1 Indeed, the distribution of perfusion is very heterogeneous even within the renal parenchyma.2,3 The renal cortex receives the most RBF. In the renal medulla, blood flow accounts only for 1% to 2% of the total RBF. An essential function of the renal medulla is to regulate the concentration of the urine, requiring the maintenance of a corticopapillary gradient (from about 50 mOsm/kg in the superficial cortex, up to 1,200 mOsm/kg in the deepest medulla). Approximately only 20% of the plasma in the arteriolar capillary is filtered, and only a small amount of urine is formed from this high blood flow. Then, it is important to note that this high blood flow greatly exceeds the metabolic needs of the kidney, but it is mandatory for an efficient regulation of renal function.
Kidneys have also the highest basal oxidative metabolism, representing 10% of the basal body metabolism.4 This very high oxidative metabolism is mainly due to sodium reabsorption, and changes in renal oxidative metabolism correlate closely with changes in sodium reabsorption. It is, therefore, most likely that renal oxidative metabolism could be changed significantly in chronic renal diseases, such as ischemic nephropathy.
In this review, we will describe the measure of RBF and perfusion with computer tomography and PET scan.
▪ Multidetector Computed Tomography and Electron Beam Computer Tomography
Method Description
MDCT is the latest evolution of the computer tomography technology and is a powerful modality allowing the measurement of RBF, perfusion, and GFR. CT allows a fast acquisition of renal images, with isolation of vascular and tissue peak concentration of the CM after intravenous (IV) injection.
The principle of CT imaging is based on the attenuation of x-rays by tissue structures (measured in Hounsfield units). The relationship between the attenuation measured in renal tissue and the concentration of iodinated CM is strictly linear, allowing a robust and quantitative modeling. Similar to inulin, iodine is eliminated by glomerular filtration. They are not reabsorbed nor are secreted by the tubules and thus can be used as a tracer for GFR measurement. The density observed in the renal parenchyma corresponds to the sum of the density of the parenchyma before injection, and the iodine density accumulated in the renal vessels and tubules.5
Electron beam computer tomography (EBCT) has been used since the 1980s in the United States. In this scanner, there is no rotation of the acquisition ring. The electron source, located at a distance behind the acquisition ring, produces an electron beam which is deflected electromagnetically toward the eight rows of x-ray emitters underneath the patient. The spatial resolution of EBCT is lower than a standard CT scanner but remains acceptable for renal functional
imaging. The temporal resolution is fast enough (<100 milliseconds), thanks to the absence of limitation forced by the mechanical rotation of the detector ring. These two features allow the extraction of renal perfusion and DFG using gamma variate modeling.
imaging. The temporal resolution is fast enough (<100 milliseconds), thanks to the absence of limitation forced by the mechanical rotation of the detector ring. These two features allow the extraction of renal perfusion and DFG using gamma variate modeling.
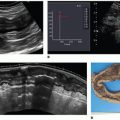
 Figure 30-1. Dynamic multidetector CT images in a pig model. A: Maximum aortic density enhancement. B: Cortical and (C) medullary phases. Top of image = pig’s left side and right of image = pig’s ventral side. |
Modeling
The repeated acquisition of images at the same level of a cross section after the iodinated CM bolus permits to obtain a kinetic of the vascular and tissue density as a function of time. Following the vascular phase, the contrast appears first in the cortex and the amount of cortical enhancement corresponds to the glomerular filtration of CM into the proximal tubule. A second enhancement is observed when the CM transits within the distal tubules (Fig. 30-1). Time density curves are obtained after manual drawing of regions of interest (ROI) corresponding to the aorta and renal cortices on each cross section. To obtain reliable and accurate kinetics, the temporal resolution of the scanner must be high, especially during the vascular transit of the CM, in order to monitor the rapid changes in density. Moreover, to prevent any errors related to respiratory movements, it is essential to acquire simultaneously several cross section images at contiguous levels of the kidney. The Gamma Variate modeling6 (Fig. 30-2) and the Rutland-Patlak Method7 are the two validated methods for extracting renal parameters from the density kinetic. Only the Gamma variate modeling allows measuring perfusion.
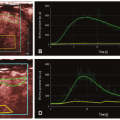
 Figure 30-2. Time density curve (TDC) obtained from a region of interest in the left cortex. |
Gamma Variate Modeling
The most commonly applied analytic models for perfusion analysis based on dynamic CT data include compartment models and deconvolution methods.
 Figure 30-3. Gamma variate modeling. TDC from Figure 30-2 in gray, gamma variate modeling in black line from corresponding time density curve. The TDC is broken down in to three peaks: vascular (dotted black line), proximal tubular (dotted gray line), and distal tubular (little gray dotted line) peaks. |
The Gamma Variate Method allows to measure the most functional parameters (perfusion, RBF, and GFR). This method was developed by Krier et al.8 The initial formula of gamma variate was [C(t) = c × ta × exp(-t/b)] that permits to describe the kinetic of a vascular peak of iodinated CM.9 An extend formula of gamma variate permits to measure perfusion and glomerular filtration. [C(t) = c × ta × [exp(-t/b) + d × exp(-t/h) + i × tj × exp(-t/k)], where C(t) corresponds to the concentration of iodinated CM in function of time, where a, b, and c describe the vascular transit of iodinated CM, d and h are the accumulation and the transit in the proximal tubule and i, j, and k in the distal tubule (Fig. 30-3). This model required a high-rate of CM injection (i.e., 15 mL/s) to obtain a bolus as short as possible because it used the maximum slope model in a single-compartment model that neglects venous outflow. This high rate injection is impossible to deliver using a peripheral catheter because of the small diameter of the peripheral vein; therefore, a central venous catheter was mandatory, the method remained invasive and cannot be used easily in routine clinical practice. Lemoine et al. validated the measurement of renal perfusion with MDCT using a low-rate injection of CM (i.e., 3 mL/s) with gamma variate extended modeling validated with a reference method using fluorescent microspheres (MS) that permits to use this technique in clinical practice.10 Kandel et al. showed that the duration of CM bolus injection does not influence perfusion measurement substantially in pigs. They recommended to use the same scheme of duration of bolus injection for longitudinal perfusion measurements in a same patient.11
Kidney Applications
The Gamma Variate method has been used in experimental and clinical practice for evaluation renal function in ischemic nephropathy, renal obstruction, and renal carcinoma.
Experimental Practice
Bentley et al. showed that the renal tissue perfusion is more dependent on the microvascular distribution volume than the vascular transit time in dogs.12 They showed that the cortical perfusion was significantly decreases when RBF was significantly reduced, whereas the medulla perfusion remain unchanged. Lerman et al. demonstrated that, in case of a unilateral chronic renal ischemia, there was a hypertrophy of the contralateral kidney and an increase of RBF.13 Krier et al. showed that in a model of renal artery stenosis in pigs the RBF was reduced significantly and proportional to the degree of the renal artery stenosis (RAS).8 Other studies show that the RAS leads to a redistribution of the intrarenal blood flow.14 With the EBCT, the microvasculature was also studied by quantifying the regional perfusion before and after injection of vasodilators in pigs with atherosclerotic RAS showing that the coexistence of an early hypercholesterolemia and hypoperfusion was associated with a greater renal functional and structural impairment, especially in the tubular and glomerular systems, compared with each condition alone.15,16 The same author showed also that the renal perfusion increased significantly after blocking oxidative stress.17
Related posts:
 Vascular Anatomy and Microanatomy
 CT and MR Contrast-Enhanced Tissue Perfusion Imaging: Basic Methodology, Postprocessing, Reliability Testing
 Clinical Applications of ASL Brain Perfusion Imaging
 Myocardial Perfusion Imaging with PET/SPECT: Techniques and Clinical Applications
 Ultrasound Perfusion Imaging: Techniques and Analytical Methods
 Contrast-Enhanced Ultrasound: Clinical Applications
Stay updated, free articles. Join our Telegram channel

Full access? Get Clinical Tree


