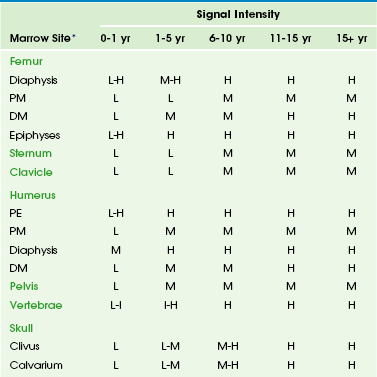
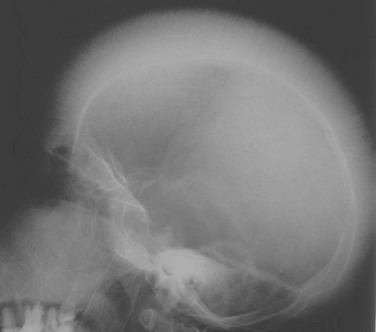
Chapter 142 Bone marrow is one of the largest and most dynamic tissues in the body. Its functions include the production of red and white blood cells and platelets for tissue oxygenation, cellular immunity, and blood coagulation, respectively. Bone marrow occupies approximately 85% of the medullary cavity and is supported by a network of trabecular bone.1 In addition to hematopoietic elements, it contains stromal cells, collagen, nerves, and a variable amount of fat. Physiology: On gross examination, bone marrow may be red because of hemoglobin in the erythrocytes and their precursors, indicating active hematopoietic marrow, or it may be yellow as a result of the presence of carotenoid derivatives dissolved in fat droplets within adipocytes.1 Hematopoietic marrow is rich in vascular sinusoids, whereas fatty marrow is considerably less vascular. During periods of decreased hematopoiesis, the fat cells increase in size and number. During periods of increased hematopoiesis, the fat cells atrophy. The cellularity of bone marrow diminishes most rapidly in the first two decades of life. The cellularity of hematopoietic marrow is near l00% at birth and decreases to 50% to 75% by 15 years of age. By adulthood, the hematopoietic marrow is composed of approximately 40% fat, 40% water, and 20% protein, with 60% of cells being hematopoietic and 40% being adipocytes.1 In contrast, the fatty marrow is composed of 80% fat, 15% water, and 5% protein, with 95% of cells being adipocytes (e-Fig. 142-1).1,2 e-Figure 142-1 Histologic sections of normal bone marrow (hematoxylin-eosin, ×75). Imaging: Conventional radiography, computed tomography, and ultrasonography are of limited value in the assessment of bone marrow.3 Since the first reports of magnetic resonance imaging (MRI) of the marrow in children were published in 1984, MRI has emerged as the primary imaging modality to evaluate the bone marrow. It provides a noninvasive method for visualizing the gross anatomic structure of a large sample of the bone marrow and for inferring alterations in its chemical and cellular composition related to a variety of physiologic and pathologic processes. Furthermore, MRI can provide valuable information about regions of the bone marrow that may be inaccessible or difficult to biopsy. The constituents of bone marrow that contribute to the signal characteristics on MRI are fat, water, and, to a lesser extent, mineralized matrix.3 Fat is the dominant contributor to both hematopoietic and fatty marrow signal intensity patterns. Most fat protons are in hydrophobic methylene (−CH2-) groups of relatively heavy molecular complexes, conferring very efficient spin-lattice relaxation; this results in a short T1 relaxation time, which results in high signal intensity on T1-weighted sequences.1 The T2 relaxation time of fat is much shorter than that of free water protons, and water contributes much more to the signal intensity of hematopoietic marrow than fatty marrow.1 The mineralized matrix of bone has a low density of hydrogen protons that lack mobility within the crystalline structure of bone, accounting for very long T1 and short T2 relaxation times and low signal intensity of mineralized matrix on T1- and T2-weighted sequences. In addition, local field gradients at the trabecular surface are generated by the fixed dipole from the immobile protons and cause magnetic field inhomogeneity. This magnetic susceptibility effect, as well as that resulting from iron deposition, can play a large role in the signal characteristics of hematopoietic and fatty marrow on gradient echo (GRE) images.1 The normal intervertebral disks, skeletal muscle, and subcutaneous fat have little interindividual and intraindividual variation in signal intensity on T1-weighted sequences during childhood and consequently serve as convenient internal reference standards for comparison with the signal intensity of the marrow.1,4 Fatty marrow has high signal intensity on conventional spin echo T1-weighted sequences. The relative amounts of fat, water, and protein contribute in a complex fashion to produce a longer T1 relaxation time in hematopoietic marrow, with signal intensity that ranges from intermediate to low (less than that of muscle or intervertebral disks) in fat-poor hematopoietic marrow to intermediate to high (greater than that of muscle or the intervertebral disks but less than that of subcutaneous fat) in hematopoietic marrow with larger proportions of fat.1,5 In neonates, hematopoietic marrow contains minimal fat and has low signal intensity on T1-weighted sequences. With aging, hematopoietic marrow signal intensity progressively increases on T1-weighted sequences, reflecting a progressive increase in fat content. After the neonatal period, hematopoietic marrow has signal intensity equal to or slightly greater than muscle and the intervertebral disks but much less than subcutaneous fat on T1-weighted sequences, whereas fatty marrow approaches the signal intensity of subcutaneous fat on T1-weighted sequences.5 Because of the similar proton densities of hematopoietic and fatty marrow, proton density sequences without fat suppression are less useful than T1-weighted sequences.6 The signal characteristics of marrow are highly variable on GRE sequences, with which images that exploit chemical shift can be obtained by choosing an echo time in which the phases of relaxing water and fat protons are either opposed 180° (out-of-phase or opposed-phase sequences) or coincide (in-phase sequences) related to differences in their resonance frequencies.1 When hematopoietic marrow contains approximately equivalent amounts of water and fat, as in normal adults, the signal intensity is markedly diminished on opposed-phase T1-weighted sequences, compared with in-phase T1-weighted sequences, as a result of intravoxel chemical shift effect.1 When the amount of fat and water is no longer balanced, for example, in fatty marrow or in edematous or hypercellular hematopoietic marrow, the marrow signal intensity does not show such a profound difference between the opposed-phase and in-phase T1-weighted images.1 Magnetic susceptibility effect from trabecular bone and iron leads to a lower signal intensity of the marrow on GRE T2*-weighted sequences than on spin echo sequences. The degree of contrast enhancement of normal marrow varies with the contrast dose, timing of image acquisition following contrast administration, the age of the patient, and the composition of the marrow. Marrow enhancement peaks within a minute of contrast administration and then slowly declines.7 Enhancement is greater in children than in adults, greater in the metaphyses than in the epiphyses, and greater in hematopoietic marrow than in fatty marrow. Enhancement can be imperceptible by visual inspection in the marrow of adults and in the marrow of the epiphyses in patients aged more than 2 years. Interindividual variation in the degree of enhancement is also substantial.7 If gadolinium-enhanced T1-weighted sequences are acquired without fat suppression, contrast between hematopoietic and fatty marrow is decreased, which potentially obscures marrow lesions or age-related marrow conversion changes.8 Image-subtraction and fat-suppression techniques facilitate the detection of abnormal marrow enhancement on postcontrast T1-weighted sequences.6 A combination of T1-weighted and fat-suppressed FSE T2-weighted or STIR sequences is sufficient for the detection and characterization of most marrow lesions.9 Contrast-enhanced T1-weighted sequences increase the cost and duration of the MRI exam while providing only modest incremental added sensitivity; because of this, they should be reserved for cases with unclear findings on the precontrast sequences. GRE sequences are valuable for the assessment of the iron content of the marrow, and chemical-shift techniques are useful to detect subtle changes in the fat and water fractions of the marrow. Practical time constraints previously limited MRI scanning of the marrow to only sections of the skeleton. This disadvantage has been mitigated by the development of fast, whole-body MRI scanning techniques that include FSE and single-shot sequences, parallel imaging, rolling table platforms with a large field of view, and global matrix coil concepts.10–12 Obscuration of lesions by motion artifact may be overcome to some extent by the use of respiratory triggering or other motion-suppression techniques. The lower signal-to-noise ratios in smaller children on whole-body MRI exams can be ameliorated by using MR systems with a higher field strength.13 Diffusion-weighted whole-body MRI holds particular promise as a technique to globally assess the bone marrow for hematologic disorders and tumor metastases.14,15 Molecular diffusion is a stochastic process characterized by brownian motion.16 Diffusion-weighted imaging (DWI) is based on the MR signal attenuation caused by the brownian motion of water molecules. In biologic tissues, the diffusion of water molecules is influenced by the microstructure of the surrounding environment. Bone marrow is semifluid in consistency and is confined within spaces defined by the bony trabeculae and supported by reticulum cells and adipocytes. DWI is not pure diffusion imaging, and the apparent diffusion coefficient (ADC) reflects both the molecular diffusion of water and the blood perfusion of the microvasculature. At b-values of 30 and 300 seconds/mm2, the ADC values of marrow are more affected by perfusion effect than by diffusion.17 A positive correlation exists between the degree of marrow cellularity and the marrow ADC. Hematopoietic marrow or marrow infiltrated by neoplastic cells has more abundant microvasculature and more intracellular and interstitial free water than fatty marrow, and it exhibits higher ADC values.18 Motion and susceptibility artifacts are especially problematic in DWI of the marrow, which is contained by bone and in proximity to physiologic motions, such as cerebrospinal fluid pulsations in the case of the spine.16 Recent advances have largely overcome these technologic challenges, and diffusion-weighted whole-body MRI is being used to evaluate an increasing number of benign and malignant conditions that include chronic recurrent multifocal osteomyelitis, Langerhans cell histiocytosis, and bony metastases.19–21 Physiology: Hematopoiesis occurs in the yolk sac in the early stages of fetal development; later in gestation, it shifts to the liver, and to a lesser extent, to the spleen. Bone marrow begins hematopoiesis in the fourth intrauterine month, overtakes the liver in this function by the sixth month, and is entirely responsible for hematopoietic cell production by birth.22 Shortly before birth, conversion from hematopoietic to fatty marrow begins in the distal phalanges of the hands and feet and proceeds in a centripetal fashion from the distal to the more proximal portions of the appendicular skeleton.4 Within the long bones, conversion from hematopoietic to fatty marrow proceeds from the mid diaphyses to the distal metaphyses and then to the proximal metaphyses. Conversion also progresses from the central medullary canal to the endosteum. Fatty transformation in the epiphyses and apophyses begins almost as soon as they begin to ossify. In infants, the skull and limbs contain about half of the total amount of hematopoietic marrow.1,4 By early adulthood, hematopoietic marrow becomes confined to the vertebrae, sternum, ribs, pelvis, skull, proximal humeri, and proximal femurs. Approximately one half of the bone marrow volume is fatty marrow in early adulthood and is located primarily in the appendicular skeleton. The involution of hematopoietic marrow continues throughout adult life, although at a slower pace than during childhood.1,4,23 Unlike skeletal maturation, there are generally no gender differences in the rate of marrow conversion during childhood.2 Knowledge of the normal age-related changes in the distribution of hematopoietic and fatty marrow is necessary for the recognition of abnormal conversion and reconversion patterns and for the detection of marrow infiltration by other pathologic processes. Imaging: Conversion from hematopoietic to fatty marrow is readily detected by MRI because of the high sensitivity of T1-weighted spin echo sequences to fat (e-Table 142-1).1 In fact, marrow conversion is observed earlier by MRI than by gross pathologic inspection because of the capability of MRI to detect microscopic fat present in marrow.2,4,5,24 Numerous publications detail the temporal and spatial sequence of marrow conversion revealed by MRI. Although there are discrepancies among these publications in the precise ages of transformation, the sequence of conversion is consistent along the long axes of individual bones and in the skeleton as a whole. Conversion occurs at a faster pace in the appendicular skeleton (extremities, shoulders, and pelvic girdle) than in the axial skeleton (skull, spine, ribs, and sternum).1,4 e-Table 142-1 T1-Weighted Signal Intensities Associated with Bone Marrow Conversion *Intensity of vertebral bodies compared to intervertebral disks. All other marrow sites compared to muscle (hypointense) and fat (hyperintense). Marrow conversion follows a similar pattern in both the upper and lower limbs. Within the long bones, conversion initially begins within the diaphysis before spreading to the metaphysis.24 In general, low signal intensity on T1-weighted images marrow within the long-bone diaphyses is unusual after 10 years of age.1,5 Long-bone metaphyseal marrow demonstrates high signal intensity on T1-weighted images by 15 to 25 years of age, except for low to intermediate signal intensity hematopoietic marrow that may persist through adulthood in the proximal femoral metaphyses, the metaphyses around the knee, and the proximal humerus, particularly in populations with increased hematopoiesis, such as smokers, endurance athletes, and obese women.1,4,25 Under normal circumstances, the epiphyseal ossification centers do not participate in hematopoiesis to any appreciable degree. Soon after the onset of epiphyseal ossification, the low signal intensity bony trabeculae and hematopoietic marrow begin to be replaced by high signal intensity fatty marrow, with near complete conversion within 6 to 8 months from the onset.26 Fatty marrow appears earlier in the proximal humeral epiphysis, compared with the femur, because of the earlier onset of proximal humeral epiphyseal ossification.1,27 The apophyses and sesamoid bones follow a similar pattern to the epiphyses. Fatty marrow conversion first occurs within the phalanges and is completed in the fingers and toes by 1 year of age.4 Conversion in the femurs begins in infancy. Fatty marrow is seen in the femoral diaphyses as early as 3 months of age and is commonly observed by 12 months of age.24 At 1 to 5 years of age, the diaphyseal fat signal becomes homogeneous, and the hematopoietic marrow in the distal femoral metaphyses becomes replaced by fatty marrow at 6 to 15 years of age (Fig. 142-2).24 However, a mottled pattern of relatively low to intermediate signal intensity in the proximal femoral metaphyses may remain, related to persistent hematopoietic marrow and bony trabeculae extending from the inferolateral aspect of the femoral neck to the superomedial aspect of the femoral head. Figure 142-2 Diagrammatic representation of changes in magnetic resonance imaging appearance of the femoral marrow with increasing age. Bone marrow conversion in the humerus follows a similar predictable pattern. Conversion to fatty marrow is complete in the proximal humeral epiphyses by 1 year of age, nearly complete in the diaphyses by 5 years of age, and nearly complete in the distal metaphyses by 10 years of age.27 Conversion occurs less rapidly in the proximal humeral metaphyses and is nearly complete by 15 years of age. However, low to intermediate signal intensity hematopoietic marrow is retained in the proximal humeral metaphyses and subchondral medial aspects of the humeral heads into adulthood, particularly in women.2,28 The acromion behaves like an epiphysis in regard to marrow distribution and conversion rate.2 Conversion of marrow in the forearm and leg bones lags slightly behind the proximal arms and thighs. Conversion to fatty marrow begins in the diaphyses between 1 and 5 years of age and is complete in all portions of the forearm and leg bones by 10 to 15 years of age.4 Marrow conversion ensues in the tarsal and carpal bones at 2 to 6 months of age and is complete by 6 years of age, with the possible exception of small foci of residual hematopoietic marrow that persists in the tarsal bones up to 15 years of age.29 In the first year after birth, hematopoietic marrow is present in the pelvis. Conversion to fatty marrow initially occurs in the anterior ilium and acetabulum, beginning as early as 2 years of age (Fig. 142-3). In the second decade of life, the remainder of the pelvic marrow increases to intermediate signal intensity. Except in infancy, heterogeneous signal intensity of the pelvic marrow is a normal finding and is most prominent in adolescents and adults in the acetabulum and anterior ilium because of macroscopic foci of both hematopoietic and fatty marrow.30 Figure 142-3 Coronal T1-weighted magnetic resonance images of the pelvis showing normal marrow changes. During the first month after birth, the vertebral marrow lacks fat and exhibits uniformly lower signal than the adjacent cartilaginous disks on T1-weighted sequences. Later in infancy, as the vertebral ossification center increases in size, and the cartilaginous end plates decrease in prominence, the veterbral body marrow increases in signal intensity on T1-weighted sequences, particularly adjacent to the cartilaginous end plates.4 Compared with the intervertebral disks and cartilaginous end plates, vertebral body marrow is usually hypointense on T1-weighted images up to the age of 1 year.31 Vertebral body marrow is commonly isointense or hyperintense on T1-weighted images compared with the intervertebral disks from 1 to 5 years of age. After the age of 5 years, vertebral body marrow signal on T1-weighted images is typically greater than that of the intervertebral disks, and a band of fatty marrow may be conspicuous in the vertebral body centrally or along the basivertebral venous plexus (e-Fig. 142-4).4,31 The spine continues as a site of hematopoietic marrow throughout life, although the proportion of fatty marrow gradually rises approximately 7% per decade. e-Figure 142-4 Sagittal T1-weighted magnetic resonance images of the lumbar spine show increase in signal intensity of vertebral body marrow with age. The skull is where the bone marrow is most frequently imaged by MRI in childhood, typically incidentally in studies obtained to evaluate the brain.32 The skull contains 25% of the active hematopoietic marrow at birth, and conversion to fatty marrow begins by 2 years of age within the facial bones and skull base before proceeding to the calvarium.4 Marrow at the site of the future paranasal sinuses becomes fatty before pneumatization.32 By 3 to 4 years of age, foci of high signal intensity on T1-weighted sequences are seen in the clivus, and complete conversion is typical by 15 years of age. In the calvarium, conversion begins earlier in the frontal and occipital bones than in the parietal bones.23 Conversion in the calvarium should be obvious by 7 years of age, and it is complete in the great majority by 15 years of age.4 The conversion to fatty marrow in the calvarium may occur more slowly in females, an exception to the rule of no gender differences.3 Marrow conversion in the sternum precedes that in the ribs. Development of foci of intermediate to high signal intensity on T1-weighted sequences occurs in the sternum after 5 years of age and in the ribs by 10 years of age.4 The sternum and, to a lesser extent, the ribs remain hematopoietic into adulthood. Detection of primary or systemic pathology that affects the marrow is usually easier in fatty marrow than in hematopoietic marrow.33 This includes processes associated with hematopoietic hypercellularity (hemolytic anemia, hematopoietic growth factor treatment, leukemoid reaction, glycogen storage disease type 1b [GSD1b], myelodysplastic syndrome, leukemia), marrow infiltration (metastatic tumor cells, inflammatory cells, Gaucher cells), iron overload, and myelofibrosis.7 Some of these processes are also associated with an increase in free water in the marrow and manifest as signal intensity higher than that of normal hematopoietic or fatty marrow on fat-suppressed FSE T2-weighted or STIR sequences. Features that favor normal hematopoietic marrow include signal intensity equal to or only slightly higher than that of muscle on fat-suppressed FSE T2-weighted or STIR sequences, dropout of signal intensity on opposed-phase GRE sequences, a “flame” or “paintbrush” shape (Fig. 142-5), no underlying trabecular disruption, symmetry with the contralateral side, and no associated abnormalities of the cortical bone or extraosseous soft tissues. Residual red marrow may sometimes have a globular appearance on T1-weighted sequences, and this is a normal finding (Fig. 142-6). However, a low-grade infiltrative or edematous process of the marrow can be difficult or impossible to distinguish from hematopoietic marrow on MRI, particularly when the hematopoietic marrow is relatively hypercellular, such as in very young children and in states of marrow reconversion in patients on granulocyte colony-stimulating factor (G-CSF) therapy (Fig 142-7). Normal red marrow should never have a round, well-circumscribed configuration, which suggests a neoplastic process (Fig. 142-8).34 Figure 142-5 An 8-year-old boy with normal marrow. Figure 142-6 A 15-year-old girl with normal marrow. Figure 142-8 Magnetic resonance images of the left knee of a 6-year-old boy with knee pain. Overview: Reconversion is a process by which established fatty marrow is replaced by hyperplastic hematopoietic marrow in response to conditions that create a demand for increased hematopoiesis. In children, reconversion is commonly encountered in patients with chronic anemia—such as from sickle cell disease, thalassemia, and spherocytosis—and in those administered hematopoietic growth factors, such as G-CSF, granulocyte-macrophage colony-stimulating factor (GM-CSF), and erythropoietin. Etiology, Pathophysiology, and Clinical Presentation: The stimulus for increased oxygen-carrying capacity of the blood in cyanotic congenital heart disease patients, endurance athletes, heavy smokers, and high-altitude dwellers also induces hematopoietic marrow hyperplasia and reconversion. Because marrow conversion is a process that occurs throughout childhood, some of what is construed as reconversion in children actually represents an arrest or delay in conversion from hematopoietic to fatty marrow and is attributable to increased hematopoietic demands (e-Fig. 142-9).4 e-Figure 142-9 Sagittal T1-weighted magnetic resonance image of the lumbar spine in a 5-year-old girl with homozygous sickle cell disease. Reconversion occurs in the reverse order of normal marrow conversion, beginning in the axial skeleton and proceeding sequentially to the proximal metaphyses, distal metaphyses, and diaphyses of the long bones of the appendicular skeleton.4,6 The more distal long bones are the last to undergo this process. The epiphyses are usually spared but can undergo reconversion in response to very high hematopoietic demands. Imaging: Positron-emission tomography (PET) with 18-fluorodeoxyglucose (FDG) may reveal increased FDG uptake in areas of marrow hyperplasia because of the metabolic demands of increased hematopoiesis. The marrow reconversion revealed by MRI is far more extensive than that suggested by technetium-99m (99mTc) phosphonate bone scintigraphy. Marrow reconversion usually begins in the metaphysis. On MRI, reconverted marrow follows the signal intensity of hematopoietic marrow and tends to involve the appendicular skeleton in a symmetric fashion.1,4 The reconverted hematopoietic marrow may be distributed in either a homogeneous or patchy pattern and may have an appearance overlapping with that of pathologic processes, such as leukemia and storage disorders. Although MRI is very sensitive to changes in marrow fat content, disease specificity is low, and the distinction between reconverted and diseased marrow often requires clinical correlation. Also, some of the conditions that exhibit marrow reconversion have additional superimposed marrow processes that complicate MRI interpretation, such as transfusion hemosiderosis in thalassemia and marrow infarction and fibrosis in sickle cell disease. Etiology, Pathophysiology, and Clinical Presentation: Thalassemia is an inherited hemoglobinopathy characterized by ineffective erythropoiesis, intramedullary hemolysis, and anemia. With effective transfusion therapy, hematopoietic to fatty marrow conversion may proceed in the extremities by puberty. However, hematopoietic marrow hyperplasia in the skull, spine, and pelvis can remain pronounced. The paranasal sinuses often fail to develop, in part as a result of abrogation of the normal fatty conversion of marrow that precedes sinus pneumatization (see Chapter 8).32 Thalassemia patients have an increased risk of pathologic fractures because of osteopenia, arthralgias that are believed to be related to iron overload or the use chelation therapy, and back pain as a result of the high incidence of scoliosis and early intervertebral disk degeneration.35 Imaging: The radiographic changes of thalassemia are due to chronic hematopoietic marrow hyperplasia. These include diffuse osteopenia, undertubulization of bone, premature physeal fusion, “hair-on-end” appearance of the calvarium with widening of the diploic space (Fig. 142-10), decreased pneumatization of the paranasal sinuses, coarse trabeculation of appendicular bones, expansion of costochondral junctions, scoliosis, and soft tissue masses related to extramedullary hematopoiesis.36 Figure 142-10 Child with thalassemia with diffuse “hair-on-end” appearance of the calvarium. (Courtesy Edward Singleton, MD.) The appearance of the bone marrow on MRI is a reflection of the diffuse erythroid marrow hyperplasia, chronic transfusions, and iron chelation therapy.4 Iron deposition in the marrow results in lowered signal intensity on T1-, T2-, and especially T2*-weighted images because of T2 relaxation-time shortening and magnetic susceptibility effects.37
Skeletal Manifestations of Systemic Disease
Normal Bone Marrow
Function and Composition
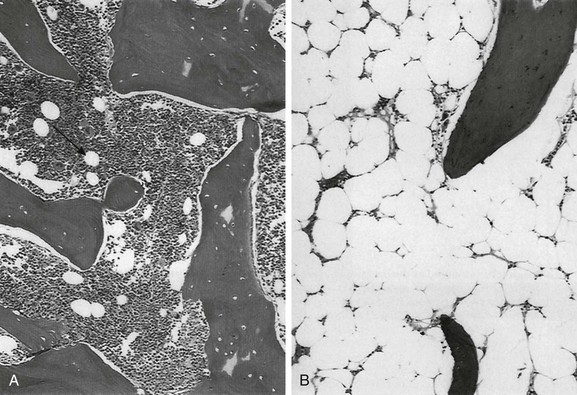
A, Hematopoietic elements and bony trabeculae of hematopoietic marrow with few adipocytes (arrow). B, Fatty marrow contains numerous adipocytes. (From Babyn PS, Ranson M, McCarville ME. Normal bone marrow: signal characteristics and fatty conversion. Magn Reson Imaging Clin N Am. 1998;6:474.)
Distribution and Conversion
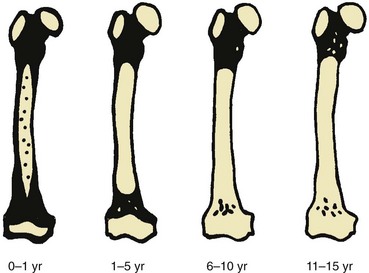
Black areas represent hematopoietic marrow, black areas represent fatty marrow or cartilage, and stippled areas indicate heterogeneous hematopoietic and fatty marrow. (From Waitches G, Zawin JK, Poznanski AK. Sequence and rate of bone marrow conversion in the femora of children as seen on MR imaging: are accepted standards accurate? AJR Am J Roentgenol. 1994;162:1401.)
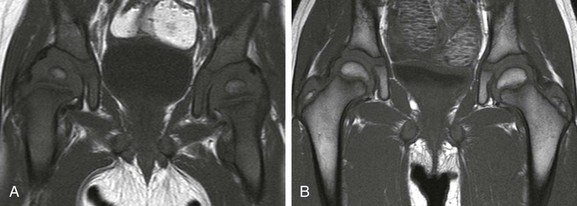
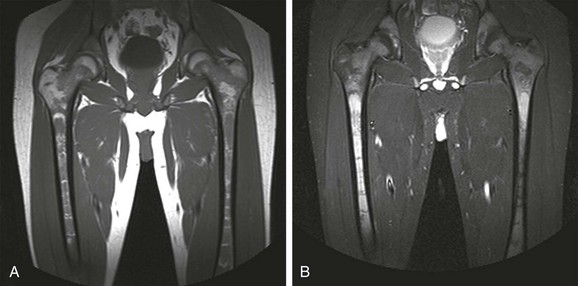
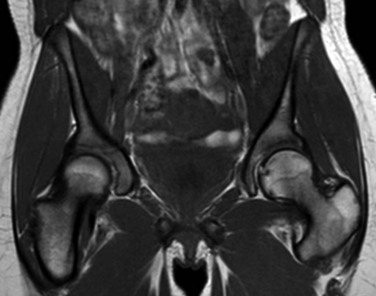
A, In an 11-month-old boy, normal low signal intensity hematopoietic marrow is present in the pelvis and proximal femurs. B, In a 3-year-old girl, normal conversion to fatty marrow has occurred by this age, manifested by increased signal intensity throughout the pelvis and proximal femurs.
Axial Skeleton
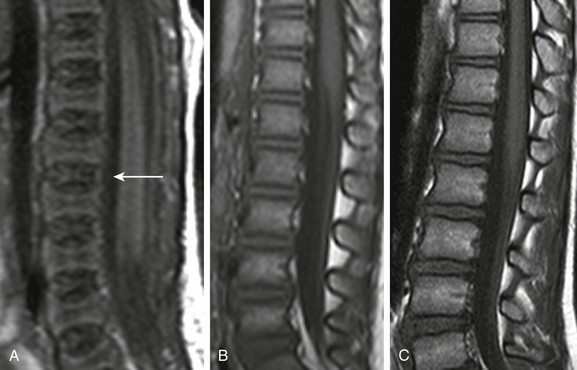
A, In a 2-day-old infant girl, the paucity of marrow fat accounts for the low signal intensity of the marrow of the vertebral body (arrow) relative to the that of intervertebral disks. B, In a 2-year-old girl, vertebral body marrow is hyperintense compared with that of the intervertebral disks. C, In a 7-year-old girl, marrow signal intensity is greater than the signal intensity of the intervertebral disks, and there is a central band of more fatty, higher signal intensity marrow in the vertebral bodies.
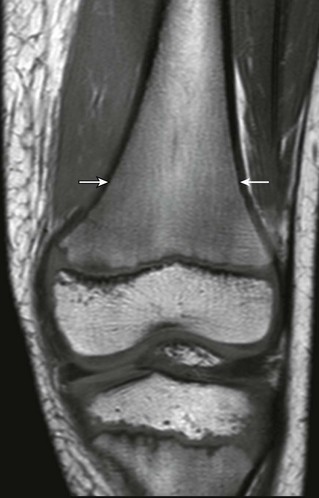
T1-weighted coronal magnetic resonance image demonstrates paintbrush-like pattern of hypointensity (arrows) in the femoral metaphysis without underlying trabecular disruption, consistent with normal residual red marrow.
T1-weighted coronal image demonstrates globular areas of decreased signal throughout the proximal femurs and throughout the innominate bones, consistent with normal, residual red marrow.
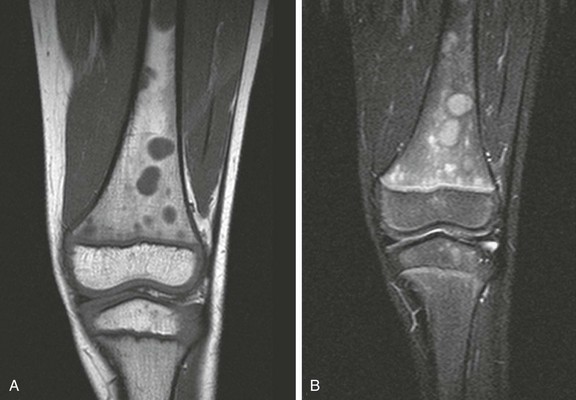
A, Coronal T1-weighted image. B, Short tau inversion recovery (STIR) image. Multiple round, sharply defined masses identified on T1-weighted images are hyperintense on STIR images because of marrow involvement by Burkitt lymphoma.
Marrow Hyperplasia and Reconversion
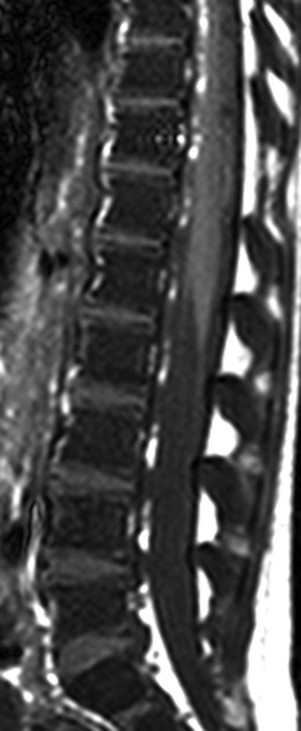
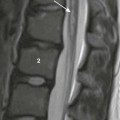
The marrow signal intensity is lower than the adjacent intervertebral disks because of the hematopoietic marrow hyperplasia associated with chronic hemolytic anemia.
![]()
Stay updated, free articles. Join our Telegram channel

Full access? Get Clinical Tree