Introduction
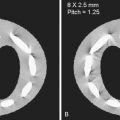
Spinal neoplasms are divided into three groups based on their anatomic locations: extradural, extramedullary-intradural, and intramedullary tumors ( Fig. 30-1 ). Extradural tumors include masses in the bones, disks, and paraspinal soft tissues. The majority of spinal tumors (60%) in adults are extradural tumors and are most commonly (90%) metastases of systemic cancer. Extramedullary-intradural tumors include masses originating from the dura/arachnoid and nerves. They are the second most common spinal tumors in adults (20%-30%) and most are either meningioma (50%) or peripheral nerve sheath tumors (50%). Intramedullary spinal cord tumors (IMSCTs) occur within the spinal cord. IMSCTs are the least common spinal tumor type in adults (4%-10%) but the most common spinal tumors in children (35%). IMSCTs primarily consist of gliomas (90%), of which ependymomas represent 60% and astrocytomas 30% ( Fig. 30-2 ). Even though rare, IMSCTs are usually associated with significant neurologic dysfunction, morbidity, and mortality.


The clinical presentation for spinal cord tumors often includes back pain, weakness, and/or insidious and progressive myelopathy. Torticollis and scoliosis can be seen in younger children. Patients with symptomatic spinal cord tumors often undergo a computed tomography (CT) examination of the spine as the first imaging modality. These images should be evaluated for the presence of intramedullary or epidural hyperdensity, which is always abnormal, usually reflecting trauma, neoplasm, or vascular malformation. Additionally CT helps identify matrix calcifications and extent of osseous destruction in cases of extradural tumors. However, magnetic resonance imaging (MRI) is the most appropriate imaging modality for any spinal cord and extramedullary-intradural pathology and for most of the extradural lesions. The contrast resolution of MRI is useful in identifying the anatomic location and soft tissue extent of all spinal tumors. Management and treatment of these tumors is highly dependent on the clinical presentation, tumor location, and histology. In this chapter we will review the epidemiology, clinical presentation, management, pathophysiology, and imaging findings of the most common spinal tumors.
Intramedullary Spinal Cord Tumors
Ependymoma
Epidemiology.
Spinal ependymomas account for 1.8% of all central nervous system (CNS) neoplasms in adults. Ependymoma is the most common primary spinal cord tumor in adults (60%) and second most common in children. Most ependymomas are low-grade tumors. Approximately 50% of CNS ependymomas occur in the spinal cord, and those arising in the conus medullaris/cauda equina are generally of the myxopapillary type. Ependymomas are usually sporadic but can be associated with neurofibromatosis type 2 (NF2). Approximately 33% to 53% of patients with NF2 have spinal cord ependymomas, which can be multiple in up to 58% of patients.
Presentation and Natural History.
The peak incidence for presentation for ependymomas is in the fourth to fifth decade of life. There is a slight male predominance for the intramedullary type. The cervical spinal cord is the most common location, followed by the thoracic and the conus medullaris. Patients commonly present with neck/back pain (95%) and have variable degrees of myelopathy with bilateral motor and sensory deficits for an average of 2 to 3 years prior to the time of diagnosis. The signs and symptoms usually spare the head and face. A significant number of patients with spinal cord ependymomas are asymptomatic, and surveillance with serial imaging and physical examination is advised when looking for disease progression. It is recommended that a safe surgical intervention be performed promptly in patients with a decline in neurologic function. Ependymomas usually have a plane of dissection, and gross total resection is possible and curative, with 5- and 10-year survival rates of 58% to 100%. Low-grade ependymomas have a low risk of local recurrence or metastatic disease. Residual tumor or rupture of the capsule during surgery increases the chances of local recurrence and development of metastases. Follow-up for ependymomas includes an immediate postoperative MRI and clinical examination, repeated at 6 and 12 months, and then annually for 10 years.
Pathophysiology.
Spinal cord ependymoma is a neoplasm that originates from the ependymal lining of the spinal cord central canal (see Fig. 30-2 ). The majority of ependymomas are of the cellular type, World Health Organization (WHO) grade II with low tendency to infiltrate the normal surrounding tissues. Generally there is a distinct plane between the tumor and adjacent normal cord, and a thin capsule may be present. The myxopapillary variant is a WHO grade I tumor and is found only at the conus medullaris (intramedullary) and filum terminale/cauda equina (extramedullary-intradural) ( Fig. 30-3 ).

Imaging.
The most common imaging finding on CT and radiographs is scoliosis and nonaggressive bone remodeling. This is more often seen in ependymomas of the lower spinal canal and filum. CT and CT myelograms should be reserved only for patients who have contraindications for MRI. MRI is the most appropriate imaging modality for evaluating any patient suspected of spinal cord pathology. The MRI examination should include a combination of sagittal T1- and T2-weighted imaging, short tau inversion recovery (STIR), susceptibility-weighted imaging (SWI), diffusion-weighted imaging (DWI); axial T1, T2, and SWI; and postgadolinium sagittal and axial T1 with fat suppression. Additional advanced imaging such as diffusion tensor imaging (DTI), magnetic resonance spectroscopy (MRS), and magnetic resonance perfusion (MRP) can help better characterize the lesions.
Most ependymomas are well circumscribed and originate from the centrally located ependymal cells and grow centrifugally, with symmetric expansion of the cord (see Fig. 30-2 ). They generally span an average of four vertebral segments, but accompanying cord edema extends beyond the tumor margins. Ependymomas are iso- to hypointense on T1-weighted images and hyperintense on T2 sequences. About 90% of ependymomas enhance after contrast administration and show well-defined margins with a homogeneous pattern (70%-80%); rarely they will have little or no contrast enhancement. Most ependymomas do not restrict on DWI, and the apparent diffusion coefficient (ADC) is similar or higher compared to normal tissue. Ependymomas frequently present with hemorrhage (20%-60%) easily seen on T2* gradient echo and even more conspicuous on SWI images as signal loss from blood products within the tumor or in its rostral and caudal margins, which is known as the cap sign. About 60% to 90% of ependymomas have associated cysts, which are classified as tumoral or nontumoral. Tumoral cysts are usually located within the substance of the tumor and reflect necrosis-hemorrhage that shows inhomogeneous signal intensity and peripheral contrast enhancement on MRI. Nontumoral cysts are nonenhancing; their signal is cerebrospinal fluid (CSF) equivalent and extends either rostrally or caudally beyond the tumor margins ( Fig. 30-4 ). Nontumoral cysts are not removed during surgery but just aspirated, drained, or shunted, which allows for a smaller laminectomy needed to only resect the solid tumor portions.

Other techniques such as DTI and its derived fractional anisotropy (FA) can be used in the evaluation of ependymomas. DTI can help depict the location, orientation, and anisotropy of white matter tracts adjacent to the tumor. Ependymomas tend to displace rather than destroy or infiltrate white matter tracts. In ependymomas there is a nonspecific tumoral and peritumoral reduction in FA values (FA = 0.48 ± 0.04), which is indicative of local extracellular edema and/or decrease in number of white matter fibers, with increased extracellular space ( Fig. 30-5 ). On MRP the relative cerebral blood volume (rCBV) may be elevated in ependymomas. MRS shows elevated choline, which correlates with cell proliferation and thus tumor malignancy, and lipids, which are associated with hypoxia, apoptosis, and necrosis.

Astrocytoma
Epidemiology.
Astrocytomas are the most common intramedullary tumors in the pediatric population and young adults (60%) and the second most common intramedullary tumor in adults (30%). There is roughly similar male-to-female predominance. Astrocytomas are more commonly located in the cervicothoracic or thoracic segments.
Presentation and Natural History.
In adults the average age of onset is 30 years, which is earlier compared to ependymomas. The average duration of symptoms at the time of diagnosis is about 9 months but can be as long as 3 years. A shorter duration of symptoms is associated with higher tumor grades and poorer survival rates. The clinical presentation often consists of back pain and weakness. Torticollis and scoliosis are usually seen in younger children. Insidious myelopathy in children should prompt a spinal MRI study. Low-grade astrocytomas have an 80% 5-year survival rate compared to 30% for high-grade astrocytomas. There is an association of spinal cord astrocytomas with neurofibromatosis type 1 (NF1). Pilocytic astrocytoma tends to have a more benign biological behavior when it occurs in patients with NF1. Benign well-circumscribed pilocytic astrocytoma has a plane of dissection, and gross total resection can be attempted. However, WHO grade II, III, and IV astrocytomas are infiltrative, and total resection without injuring the normal tissue is seldom accomplished; therefore conservative decompression, partial tumor removal, cyst decompression, and tissue diagnosis is commonly performed. Radiotherapy and chemotherapy are recommended for infiltrative residual or recurrent high-grade tumors.
Pathophysiology.
Astrocytoma arises from astrocytic glial cells of the cord, with an affinity for the white matter tracts located in the periphery of the cord (see Fig. 30-2 ). Most are low-grade astrocytomas (70%-90%), either pilocytic astrocytoma (15% WHO grade I) or more commonly fibrillary astrocytoma (75% WHO grade II). On histologic evaluation, fibrillary astrocytoma shows widespread parenchymal infiltration, whereas pilocytic astrocytoma displaces rather than infiltrates the cord. High-grade anaplastic astrocytoma (WHO grade III) and glioblastoma (WHO grade IV) are rare, accounting for about 10% to 30% of spinal cord astrocytomas. High-grade astrocytomas characteristically show mitotic activity and nuclear atypia. High-grade astrocytomas have a poor survival with higher recurrence and metastatic dissemination through the neuroaxis.
Imaging.
MRI is the most appropriate imaging modality, and CT/CT myelograms should be reserved for patients with contraindications for MRI. Astrocytomas are infiltrating poorly defined neoplasms and tend to be eccentrically located with asymmetric and fusiform cord expansion (see Fig. 30-2 ). Astrocytomas span about four or fewer vertebral segments at the time of presentation. Holocord involvement is rare and usually seen in pilocytic astrocytoma, mainly in children and adolescents. Astrocytomas are hypo- to isointense on T1 and hyperintense on T2 and STIR. Spinal astrocytomas usually enhance inhomogeneously in a nodular or patchy manner, and the enhancing tumor does not define the true tumor margins ( Fig. 30-6 ). Approximately 18% to 30% of astrocytomas do not enhance. Most astrocytomas do not restrict on DWI, and their ADC values are not significantly decreased. They may have tumoral cysts with peripheral contrast enhancement, as well as nonenhancing nontumoral polar cysts and syrinxes. Hemorrhage is uncommon compared to ependymomas, and surrounding edema is variable ( Fig. 30-7 ).

On DTI astrocytomas show diffuse infiltration of the cord or disrupted white matter tracts from tumor invasion (see Fig. 30-7 ). There is a reduction in FA values in astrocytomas, similar to the ones seen in ependymomas (0.48 ± 0.2). MRP shows low to moderate rCBV and increased vascular permeability on derived permeability maps, and one glioblastoma with increased rCBV has been reported. MRS obtained in the solid component of pilocytic astrocytoma demonstrates elevated choline/ N -acetylaspartate (NAA) ratio, ranging from 1.80 to 3.40 compared with 0.53 to 0.75 for normal tissue. This finding implies hypercellularity.
Hemangioblastoma
Epidemiology.
Hemangioblastoma (HB) is the third most common tumor, accounting for 2% to 8% of all IMSCTs. It occurs sporadically in 70% of patients, but in 30% is associated with von Hippel-Lindau (VHL) disease. VHL patients have 3p chromosomal mutations in the VHL gene. Multiple and usually small (<1 cm) HBs raise suspicion for VHL syndrome and require contrast-enhanced MRI of the entire neuraxis to evaluate for cerebellar and/or spinal HBs.
Presentation and Natural History.
HBs usually present in the third or fourth decade of life; those in VHL patients usually present a decade earlier. There is a male predominance. HBs are slow-growing tumors with a long clinical course (mean duration of symptoms, 38 months), and sensory disturbances occur more commonly than motor dysfunction and pain. In patients with small tumors (<1 cm) symptoms are attributed to an accompanying syrinx, and in larger tumors are due to the tumor itself and/or a syrinx. HBs almost never cause subarachnoid hemorrhage or hematomyelia. The treatment of choice in symptomatic patients is microsurgical en bloc resection, which is curative. Once the tumor is removed, the syrinx resolves as well. Preoperative endovascular embolization reduces arterial flow and shrinks the draining veins, which decreases the risk of intraoperative bleeding. Radiosurgery and gamma knife are alternative treatment options for patients with medical comorbidities that preclude surgery and in patients with recurrent or unresectable tumors. In patients with VHL, serial MRIs are recommended to evaluate for recurrent and de novo lesions.
Pathophysiology.
HBs are benign WHO grade I neoplasms. They are nonglial mesenchymal-, capillary-, and venous-rich tumors with foamy stromal cells. On gross pathologic examination they appear as well-circumscribed and encapsulated masses with dilated and tortuous vessels on their surface. Most are intramedullary (60%-75%), but they can be combined intra- and extramedullary (10%-15%), purely extramedullary, or even extradural in location.
Imaging.
On MRI the solid portions of HBs are seen as well-demarcated hyperenhancing nodular masses. Small HBs (<1 cm) are isointense on T1, hyperintense on T2, and enhance intensely and homogeneously after contrast administration. They are usually located subpially in the dorsal surface of the thoracic more common than cervical spinal cord (70%) ( Fig. 30-8 ; see Fig. 30-2 ). A disproportionately large syrinx as compared to the size of the tumor is seen in up to 64% of them. Larger HBs are hypointense on T1, heterogeneous on T2 (from intratumoral hemorrhage), with heterogeneous hyperenhancement after contrast administration. HBs that are larger than 2.5 cm always have vascular flow voids on T1 and T2 arising from dilated feeding arteries and draining veins containing fast-flowing arterialized blood ( Fig. 30-9 ). MRI underestimates the presence of these dilated vessels in lesions smaller than 1.5 cm. A cystic lesion with an enhancing mural nodule is characteristic, but it is a less common presentation ( Fig. 30-10A ). Superficial enhancement of the cord adjacent to the lesion may be present and may correspond to perimedullary veins. FA values are decreased (0.59) but less than in other spinal cord tumors. On DTI the white matter fibers are wrapped around the tumor without being infiltrated or destroyed.


Computed tomography angiography (CTA) and magnetic resonance angiography (MRA) have sufficient spatial resolution to demonstrate the abnormal vessels and even the arterial pedicles; however, they are unable to distinguish arterial feeders from draining veins and usually depict both simultaneously. Time-resolved CTA and MRA may help in this regard. As such, Dyna CT provides superior spatial and time resolution to distinguish the tumor and the feeding artery from draining veins, compared to three-dimensional (3D)-CTA with intravenous injection ( Fig. 30-11 ). This is essential in planning surgical treatment. Dyna-CT angiography is performed with iodine contrast injected directly to an intercostal artery. At surgery arterial devascularization should be performed before coagulating the draining vein; otherwise cord damage from venous hypertension may develop. Conventional or 3D rotational digital subtraction angiography is also useful for diagnosis and surgical planning and shows a prominent dilated supplying artery, intense and prolonged vascular blush, and a dilated draining vein with early venous opacification if a shunt is present (see Fig. 30-10A and B ). These abnormal vessels will be seen even in small tumors that do not demonstrate abnormal vasculature on MRI.

Ganglioglioma
Epidemiology.
Gangliogliomas are very rare tumors in adults, representing only about 1% of all spinal cord tumors, but they account for up to 15% of intramedullary neoplasms in the pediatric population. In a case series of 56 patients, a male predominance was reported ; in a recent smaller group of patients (18) a slight female predominance was found. The cervicothoracic segment is the most common location, followed in order of decreasing frequency by the thoracic, cervicomedullary, cervical, and conus.
Presentation and Natural History.
Symptoms include paraparesis, segmental pain, radiculopathy, and focal sensory or motor deficit. The mean duration of symptoms is 12 months (range, 2 weeks to 84 months). Gross total surgical excision is the treatment of choice. After resection, there is a 5- and 10-year survival rate of 89% and 80%, respectively. Tumor recurrence after surgery occurs in about 30% of patients; close follow-up with serial semiannual or annual MRI scan is advised.
Pathophysiology.
Gangliogliomas are composed of a combination of neoplastic ganglion cells and glial elements. They are slow growing, mostly benign, WHO grade I or II tumors.
Imaging.
On imaging, scoliosis and bone remodeling are common but not specific. On MRI the findings are very variable; however, the patient’s young age together with some MRI characteristic features help suggest the diagnosis. These findings are long tumor length (>four levels, extending over an average of eight vertebral bodies, or up to the whole cord), tumoral cysts, absence of edema, mixed signal intensity on T1 (due to dual cellular composition of the tumor), eccentric location within the cord, patchy tumor enhancement, and pial surface enhancement ( Fig. 30-12A and B ). Hemorrhage and calcifications are rare.

Spinal Cord Lymphoma
Epidemiology.
Primary CNS lymphoma (CNSL) is rare and accounts for approximately 1% to 5% of all CNS tumors. Secondary involvement by systemic lymphoma is more commonly seen (via hematogenous or direct extension), and the incidence varies between 2% and 27% for non-Hodgkin’s lymphoma and less than 0.5% for Hodgkin’s lymphoma. Intramedullary lymphoma occurs in 1% to 3% of all primary CNSLs and usually carries a poor prognosis.
Ninety percent of primary intramedullary lymphomas are large B-cell lymphomas, as are most CNS ones. Patients with acquired immunodeficiency disorders such as post–organ transplant treatment or human immunodeficiency virus (HIV) are at a higher risk to develop primary CNSL, which is linked to Epstein-Barr virus infections. In the immunocompromised patient the onset of disease is at an earlier age (30-40 years) than for the immunocompetent population (60 years). Treatment with highly active antiretroviral therapy (HAART) has decreased the incidence of CNSL in HIV patients.
Presentation and Natural History.
Patients present with back pain and progressive spinal neuropathy and radiculopathy. Treatment generally involves administration of corticosteroids, methotrexate, and radiation because CNSLs are sensitive to chemotherapy and external radiation therapy, with remission seen in approximately 80% of cases. However, long-term survival is poor (≈36% in 2 years), with a high frequency of recurrence within the first 2 years after diagnosis (50%-60%). Surgery is limited to tissue sampling, preferably with stereotactic biopsy.
Pathophysiology.
Lymphomas are lymphoreticular neoplasms of specific cellular differentiation. Primary CNSL has an angiocentric growth pattern with perivascular tumor infiltration by multiple cell layers and late vascular invasion, which ultimately compresses the blood vessels, resulting in necrosis. On gross pathology it demonstrates an ill-defined infiltrating tumor. Patients with secondary CNSL present with leptomeningeal spread in two thirds of cases and parenchymal lesions in one third of patients.
Imaging.
Contrast MRI is the modality of choice for diagnosis while on treatment and after therapy. Primary CNSL presents as a poorly circumscribed parenchymal mass that is iso- to hypointense relative to the cord on T1, a hyperintense mass on T2, and has surrounding edema; most lesions enhance after contrast administration ( Fig. 30-13 ). The pattern of enhancement varies from homogeneous-intense to patchy, confluent, or infiltrating. There is leptomeningeal enhancement in 10% of primary CNSLs, which usually contacts a CSF-containing surface. CNSL can present as a single or multifocal persistently enhancing lesion(s).

The high tumor cellularity in lymphoma results in DWI hyperintensity and hypointensity on ADC maps, with a threshold value of 1.2 × 10 −3 mm 2 /sec. This may help differentiate lymphoma from other tumors in the brain. Positive response to treatment results in increasing ADC values, whereas decreasing ADC values suggest tumor progression. The ADC value of lymphoma is lower than that of toxoplasmosis in immunocompromised patients.
On DTI, increasing tumor cellularity in lymphomas has been correlated with decreasing FA and increasing mean diffusivity. Only a modest increase in rCBV is seen (compared to double or triple increases in high-grade gliomas), and it has been reported that when there is too much cellularity or intravascular tumor infiltration, rCBV will decrease. Lymphoma shows a nonspecific MRS pattern, similar to high-grade gliomas, with decreased NAA, decreased creatine, increase choline, and lipid-lactate peaks. On SWI, lymphomas do not show hemorrhage as high-grade astrocytomas and ependymomas often do.
Lymphomas are hypermetabolic fluorodeoxyglucose (FDG)-avid tumors on FDG positron emission tomography (PET), which has an 80% sensitivity in their diagnosis. Both PET and PET-CT can be used to stage and monitor treatment response. Single-photon emission CT (SPECT) with thallium 201 is useful to diagnose hypermetabolic lymphoma, as opposed to hypometabolic toxoplasmosis, in immunocompromised patients, with a sensitivity of 55% to 100% and specificity of 85% to 100%. These techniques can also distinguish hypermetabolic recurrent lymphoma from decreased or absent activity in treatment-induced necrosis.
Spinal Cord Metastases
Epidemiology.
Intramedullary spinal cord metastases (IMSCMs) are rare; their prevalence is 0.9% to 2.1% in postmortem series of patients with cancer. Lung cancer is the most common primary (close to 50%), followed by breast cancer (≈15%). Approximately 20% to 60% of these patients have additional neuraxis and other systemic metastases. Hematogenous dissemination is the most common route, either arterial or retrograde spread from the venous system. Less common paths are CSF dissemination through the spinal cord central canal or contiguous spread from carcinomatous meningitis.
Presentation and Natural History.
Patients with IMSCM present with rapid deterioration of motor and sensory symptoms (including hemicord syndromes) compared to the slower progression of symptoms in patients with primary cord neuroepithelial tumors. IMSCMs are usually associated with widespread systemic disease and imply an advanced stage and a dismal prognosis. The overall median survival is about 4 months in patients treated with chemotherapy and radiotherapy. Surgery in selected cases may improve symptoms and survival by 1 to 2 months. Entire neuraxis imaging should be performed when IMSCM is suspected.
Imaging.
MRI shows isointense lesion(s) on T1 and T2 hyperintense lesion(s) with disproportionate large T2/STIR hyperintense surrounding edema relative to the size of the lesion(s) ( Figs. 30-14 and 30-15 ). IMSCMs are usually small, single or multiple, well-circumscribed, rounded, homogeneously or ring-enhancing lesions with mild cord expansion. Syrinx, cyst, and hemorrhage are rare. A more intense thin rim of peripheral enhancement and an ill-defined flame-shaped region of enhancement at the superior/inferior lesion margins have been described as common and specific for IMSCM when compared to primary spinal cord masses (see Fig. 30-15 ). On DTI the FA values are similar to other tumors (≈0.46), and DTI shows a pattern of fiber infiltration or destruction similar to that of astrocytomas.


Extradural Spinal Tumors
Metastatic Disease
Epidemiology.
The spine is the third most common site for metastatic disease, following the lung and liver. In fact, spinal metastases are the most common spinal tumor—20 times more common than primary spinal neoplasms. Metastatic disease to the spine can involve the bone, epidural space, leptomeninges, and the spinal cord. Extradural metastatic disease, which can seed the epidural space or the vertebra, accounts for 95% of spinal metastases. Purely epidural metastases are rare. The most common primary malignancies are breast, prostate, and lung cancer. Spinal metastases have the highest incidence between age 40 and 65 years. The most common location is the thoracic spine (60%-80%), followed by the lumbar spine (15%-30%), and the cervical spine (<10%).
Presentation and Natural History.
Metastatic spinal tumor may be the first manifestation of malignancy in 10% or more of patients. Local neck or back pain is the major presenting symptom in the majority of patients. Progression of disease may later cause weakness, numbness, and sphincter dysfunction. Eventual progression to irreversible complete paralysis is inevitable unless the patient is treated.
Generally, the prognosis of patients presenting with bone metastases is poor. Radiotherapy and surgery are important in the treatment of spinal metastatic disease. Percutaneous vertebral body augmentation, such as vertebroplasty or kyphoplasty, can be performed to treat painful vertebral body metastasis without neurologic compromise and can be used in conjunction with radiation therapy or as an alternative to surgery. Chemotherapeutic agents are sometimes administered with or after radiotherapy and/or surgery.
Pathophysiology.
Metastases may spread arterially into the nourishing environment of the bone marrow. Metastases may be transmitted through the valveless venous channels of Batson’s venous plexus into the epidural space, generally via the canal for the basivertebral vein. Finally, paraspinal tumors may extend directly into the epidural space via venous channels or through the intervertebral foramen. When tumor cells invade bones, the normal balance of osteoblastic and osteoclastic activity is disturbed, which results in the osteolytic, sclerotic, or mixed appearance of bone metastases.
Imaging.
A mass requires a 1-cm minimum diameter and 50% bone mineral loss at minimum for detection by radiographs; thus, up to 40% of metastatic spinal lesions will be missed on plain films. Most metastatic spinal lesions manifest as osteolytic vertebral destruction. Breast, lung, kidney, thyroid, oropharyngeal, melanoma, adrenal, and uterine primaries usually produce osteolytic metastases. Prostate, bladder, nasopharyngeal, medulloblastoma, neuroblastoma, and carcinoid primaries often result in osteoblastic metastases. Mixed lytic-sclerotic lesions are seen in breast, lung, ovarian, testicular, and cervical primaries. The most common finding on radiographs is pedicle erosion, followed by vertebral body compression fracture. Paraspinal line displacement and pathologic dislocation are less common findings.
CT scans can recognize a bony metastatic lesion up to 6 months earlier than a radiograph. CT has excellent spatial resolution and can detect cortical destruction ( Fig. 30-16A ) and epidural soft tissue mass. Osteolytic metastases often involve the posterior vertebral cortex and pedicle. Osteoblastic metastases may present as nodular or mottled areas of sclerosis that also tend to erode the posterior vertebral body cortex and pedicle ( Fig. 30-17A ).


MRI is excellent in detecting the early bone marrow deposits of metastatic disease and is more sensitive than CT in detecting osseous spinal metastases. MRI is essential in identifying epidural mass and spinal cord or nerve root compression. Unfortunately, conventional MRI often cannot differentiate changes due to treatment, fracture, and tumor.
Spinal marrow signal that is hypointense to muscle or disks on T1-weighted images should be considered abnormal (see Figs. 30-16B and 30-17B ). Hematopoietic marrow, which has more water content than fatty marrow, is hypointense to fat but hyperintense to normal muscle on T1-weighted images. An understanding of the age-related dynamic appearance of normal bone marrow is essential to distinguish hematopoietic marrow from spinal metastatic disease. On unenhanced fat-saturated T1-weighted sequences, spinal metastases have mixed to high signal intensity, whereas nonneoplastic lesions have homogeneous low signal intensity. Postcontrast fat-suppressed T1 imaging is very helpful to identify enhancing tumor (see Fig. 30-16C ).
On T2-weighted images, vertebral metastases are usually hyperintense to bone marrow (see Fig. 30-17C ). Strong indicators of metastases include a rim of T2 hyperintensity and diffuse T2 hyperintensity. Conversely, a focus of T2 hyperintensity in the center of an osseous lesion has been shown to be a specific sign of normal hematopoietic marrow. Blastic metastases are hypointense on all MR sequences. STIR imaging increases the conspicuity of T2 hyperintense vertebral metastases, but also increases imaging time—a concern in patients with pain, who cannot hold still for long periods. Together, STIR and unenhanced T1-weighted sequences are most useful for detecting malignant bone marrow abnormalities.
Compression of the spinal cord or cauda equina are dreaded complications of metastatic spinal disease that occur secondary to pathologic compression fracture(s) or epidural mass(es). Symptomatic spinal cord compression is present in 10% to 20% of patients with metastatic spinal disease.
In general, benign and pathologic vertebral compression fractures both result in marrow edema that is hypointense on T1- and hyperintense on T2-weighted images. Findings suggestive of a pathologic fracture include paravertebral mass, signal abnormality in the posterior elements, convex posterior vertebral body border, epidural mass, and other spinal metastases (see Fig. 30-17C ). Pathologic compression fractures have been shown to be hyperintense to normal vertebral bodies on DWI sequences, whereas benign compression fractures were hypo- to isointense. Furthermore, lower ADCs in pathologic fractures have been demonstrated. MRI findings suggestive of osteoporotic compression fractures include a low signal band on T1- and T2-weighted images, normal marrow signal in the vertebral body, retropulsion of a posterior bone fragment, and multiple compression fractures. The MR fluid sign, a well-circumscribed intravertebral fluid collection, has also been described in avascular necrosis of the vertebral body (Kummel’s disease) and benign osteoporotic vertebral fractures. The intravertebral vacuum cleft sign, a gas-density cleft within a transverse separation of the vertebral body, has been described as a specific sign of vertebral osteonecrosis and not seen in other causes of pathologic fracture. Spinal perfusion MR studies show increased blood flow and volume in tumors.
Compression of neural structures also results from epidural metastatic disease. Bone destruction at the level of epidural tumor involvement is present in most cases. Contrast-enhanced T1-weighted imaging is essential in delineating the extent of epidural tumor and cord compression. Epidural metastatic lesions are usually T1 hypointense, T2 hyperintense, and avidly enhancing. The anterior epidural raphe is often spared, resulting in the “draped curtain” appearance as vertebral body tumor extends on its sides into the epidural space (see Fig. 30-16D ).
Understanding the posttreatment imaging changes of vertebral metastases is essential in the management of patients. Progressive sclerosis of a lytic metastasis generally indicates a positive response to treatment. Evaluating the response of sclerotic metastases is difficult because progression of disease with osteolytic conversion may appear similar to a positive response to treatment. Persistent low T1 signal in bone marrow after treatment may represent residual tumor or fibrosis. In difficult cases such as this, DWI may play a role in evaluating treatment response; DWI may show decreased signal intensity of vertebral metastatic disease with successful therapy.
Multiple Myeloma
Epidemiology.
Multiple myeloma is the most common primary malignancy of bone and primary vertebral tumor. It primarily occurs between the ages of 40 and 80 years. The lesions of multiple myeloma most frequently occur in the axial and proximal appendicular skeleton. One large series of patients showed that the thoracolumbar spine (15%), cervical spine (13%), and pelvis (12%) were most commonly affected.
Presentation and Natural History.
When multiple myeloma is symptomatic, it can be characterized by one or more clinical manifestations denoted by the acronym CRAB: calcium elevation, renal insufficiency related to multiple myeloma, anemia, and bone abnormalities such as lytic lesions and osteopenia. Multiple myeloma commonly presents with fatigue, back pain, or rib pain with associated fractures or infection. However, patients may be asymptomatic and only show anemia or hyperproteinemia. When multiple myeloma is suspected, a radiographic skeletal survey and bone marrow aspiration and biopsy are performed.
Other forms of multiple myeloma include POEMS syndrome, which is characterized by polyneuropathy, organomegaly, endocrinopathy, high M-protein levels, and skin changes. Solitary plasmacytoma, accounting for less than 5% to 10% of plasma cell neoplasms, is associated with a better prognosis and may be cured with radiation therapy alone.
Multiple myeloma patients are staged using the Durie-Salmon system, which estimates tumor burden. The system is based on amount of M protein, serum hemoglobin, serum calcium, renal function, and number of lytic lesions on imaging. Prognosis of multiple myeloma is dependent on stage, with survival ranging from a few months to more than 10 years. New developments in chemotherapy and autologous stem cell transplant have led to improvement of patient survival. Percutaneous vertebroplasty and kyphoplasty are sometimes used to treat pain associated with spinal fracture.
Pathophysiology.
Multiple myeloma is a low-grade proliferation of monoclonal malignant plasma cells that usually originate from bone marrow. These abnormal cells produce monoclonal protein (M protein), which can be detected in blood and urine. The exact cause of multiple myeloma is unknown; however, literature suggests that monoclonal malignant plasma cells arise from a late cell in B-cell maturation. Radiation exposure increases the risk of multiple myeloma.
Multiple myeloma is part of the spectrum of plasma cell dyscrasias. A plasmacytoma, a related entity, is a solitary plasma cell tumor without systemic spread. This solitary form mostly occurs in the vertebra and skull. When these malignant plasma cells invade bone marrow, they induce secretion of osteoclast-activating factors, leading to excessive bone resorption and decreased bone formation. The excessive osteoclastic activity promotes multiple myeloma clone proliferation, leading to a vicious cycle of tumor growth and bone destruction.
Imaging.
Four radiologic presentations of multiple myeloma skeletal involvement have been described: (1) the solitary lesion (plasmacytoma), (2) diffuse skeletal involvement (myelomatosis), (3) diffuse skeletal osteopenia, and (4) sclerosing myeloma. Plasmacytomas are typically lytic lesions that can be found in the spine, ribs, sternum, and proximal appendages. Sclerotic lesions can be seen in POEMS syndrome. Most patients with multiple myeloma will have a positive radiographic finding; however, many lesions can be missed by radiograph.
Multidetector CT (MDCT) is more sensitive than skeletal survey radiographs for evaluating the extent of bone disease. CT findings include punched-out lytic lesions, expansile lesions with soft tissue mass, diffuse osteopenia, fractures, and rarely osteosclerosis ( Figs. 30-18A and 30-19A ). The combination of MDCT and clinical follow-up is very useful in posttreatment evaluation. One major advantage of CT is distinct delineation of cortical bone to evaluate vertebral bodies at risk for pathologic fracture, which occurs in 55% to 75% of patients. A spinal lytic lesion with volume loss greater than 50% of the vertebral body is at risk for fracture (see Fig. 30-18A ).


MRI is more sensitive than radiographs in detecting multiple myeloma lesions in the spine and pelvis. STIR and T2-weighted imaging are the most sensitive MRI sequences for identifying marrow infiltration. Normal bone marrow signal is seen in 28% of cases, which corresponds to minimal plasma cell infiltration on histology (see Fig. 30-19B ). Focal myeloma infiltration, seen in 30% of cases, is characterized by circumscribed lesions that are hyperintense on T2-weighted sequences (see Fig. 30-18C ) but hypointense to intervertebral disks on T1-weighted images (see Fig. 30-19C ). Diffuse marrow infiltration can also be seen. Intermediate-grade marrow infiltration may be difficult to identify on noncontrast T1-weighted images alone; in these cases contrast enhanced T1-weighted images may be helpful—greater than 40% enhancement is considered pathologic (see Fig. 30-19D ). The same MRI criteria used to distinguish metastatic pathologic vertebral compression fractures from benign ones can also be applied to multiple myeloma.
After treatment, patients with complete remission can show resolution of marrow signal abnormality or persistent marrow signal abnormality without enhancement or with residual peripheral rim enhancement. On T2 and proton density weighted images, lesions may have uniform high signal intensity or only rimlike high signal intensity as healing occurs. In partial response to therapy, diffuse marrow abnormality decreases in amount and converts to a variegated or focal pattern with persistent enhancement. In general, marrow lesions that return to baseline signal intensity on fluid-sensitive images and have fat signal intensity on T1-weighted images should be considered to contain no active disease. However, it may take as long as 5 years for marrow signal to return to normal. Conversely a patient may still have residual disease in the absence of imaging findings. Poor response to treatment appears as no change or worsening of previously identified lesions. In disease progression, focal infiltration can change into diffuse infiltration, mainly in the spine and pelvis.
Primary Spinal Lymphoma
Epidemiology.
Spinal lymphoma is usually secondary to disseminated lymphoma. However, primary spinal lymphoma, which by definition occurs in the absence of extraspinal lymphomatous foci, is relatively rare. Osseous vertebral body and epidural lymphomas are the most common forms of spinal lymphoma, whereas intradural extramedullary and intramedullary deposits are less common. Primary vertebral lymphoma accounts for up to one third of all primary lymphomas of bone. Primary lymphoma of bone accounts for 5% of extranodal non-Hodgkin’s lymphoma and 7% of primary bone tumors. Primary spinal epidural lymphoma occurs in 0.9% to 6.5% of cases of non-Hodgkin’s lymphoma and accounts for 10% to 30% of epidural spinal tumors. Primary spinal epidural lymphoma accounts for 0.1% to 3.3% of all lymphomas.
Primary spinal epidural lymphoma predominantly affects patients with a median age of 55 to 65 years, but has also been described in pediatric patients. One series of 94 cases of spinal extradural lymphoma showed that the thoracic spine was most commonly involved (69%), followed by the lumbar spine (27%), and the cervical spine (4%).
Presentation and Natural History.
Signs and symptoms of spinal lymphoma include weakness, back or neck pain, sensory deficits, and incontinence. Cord compression can be seen in up to 7% of cases. The classic “B” symptoms of lymphoma (fever, weight loss, and night sweats) are less common in primary spinal lymphoma.
Primary spinal lymphoma has a potentially favorable prognosis if diagnosed and treated early, since the disease is very sensitive to radiation and chemotherapy. In fact, the prognosis of cord compression due to epidural lymphoma is far better than that of cord compression due to metastatic carcinoma. Combined modality treatment, including radiation therapy and chemotherapy, is the most efficient treatment for primary spinal epidural lymphoma, with reported rates of local control in 88% and 5-year overall survival in 69% of cases. The role of surgery has been reduced and limited to laminectomy or even biopsy only.
Pathophysiology.
Lymphoma is a lymphoid neoplasm classified into two broad groups based on pathology: Hodgkin’s disease and non-Hodgkin’s lymphoma. Non-Hodgkin’s lymphoma is eight times more common than Hodgkin’s lymphoma. Several theories describe how epidural lymphoma may arise. It may come from lymphoid tissue in the epidural venous plexus or “lymphoid rests” in the epidural space. Hematogenous or lymphatic spread to the epidural space from an unidentified source may occur. Epidural extension from the vertebral body lymphoid tissue through cortical vascular channels may occur.
Infiltrative growth through neural foramina and paravertebral extension are common growth patterns in spinal lymphoma. In fact, epidural infiltration rather than osseous disease is usually the cause of spinal cord compression. Infiltration of only the spinal epidural space, with multiple vertebral level involvement, is more frequent in lymphoma relative to metastatic disease. Knowledge of this tendency is helpful when characterizing epidural masses.
Imaging.
Radiographs are not sensitive in detecting vertebral and epidural lymphoma. Findings are nonspecific and include compression fractures and pedicle erosion. Vertebral body lesions may appear sclerotic, lytic, or mixed. Sclerosis (i.e., ivory vertebra) and mixed patterns are more common in Hodgkin’s disease. CT findings of spinal epidural lymphoma are nonspecific. A common finding on CT is epidural tumor with adjacent soft tissue or nodal mass. Epidural tumor is usually homogeneously hyperdense and enhances with intravenous contrast ( Fig. 30-20A ). Osseous involvement on CT is a relatively less common finding.

MRI findings of vertebral lymphoma are also nonspecific. On T1-weighted images, lymphomatous infiltration of marrow is usually heterogeneous and diffuse. Focal marrow lesions are less frequent ( Fig. 30-21A ). The abnormal marrow is hyperintense on T2-weighted images (see Fig. 30-21B ) and enhances on contrast-enhanced T1-weighted images. Lymphomatous epidural infiltration is homogenous on MRI. Lesion contrast is greatest on T1-weighted images, where epidural lymphoma is hypointense to fat but slightly hyperintense to muscle (see Fig. 30-20C ). On T2-weighted images, epidural lymphomas are iso- to hypointense to fat and hyperintense to muscle (see Fig. 30-20B ). This may help distinguish lymphoma from metastatic disease, since most metastatic lesions are hyperintense to fat on T2-weighted images. Contrast-enhanced T1-weighted images highlight extraosseous soft tissue mass, paravertebral infiltration, and levels of spinal cord compromise (see Fig. 30-20D ).

Chordoma
Epidemiology.
Excluding lymphoproliferative neoplasms, chordomas are the most common primary malignant bone tumor of the sacrum and mobile spine. In one series of benign and malignant primary spinal bone tumors, chordoma was the second most common tumor (multiple myeloma/plasmacytoma was most common), accounting for 22% of cases. The peak incidence is between ages 50 and 60. Men are affected twice as often as women.
Chordomas have an almost equal distribution in the sacrococcygeal region, sphenooccipital region, and in the vertebrae. However, some studies have shown that sacrococcygeal chordomas are most common, accounting for up to 60% of all chordomas. In fact, chordomas constitute over 50% of primary tumors of the sacrum. In the mobile spine, the lumbar spine is the most common site of involvement, followed by the cervical, and then thoracic spine. The vertebral body is most commonly involved.
Presentation and Natural History.
Chordomas are slow-growing tumors that are locally aggressive and invasive; thus, they are usually large when discovered. Vertebral or sacral chordomas usually present with pain, often radicular. Advanced disease can lead to incontinence. Cervical chordoma can cause airway obstruction or dysphagia. Sacral chordomas can invade pelvic structures anteriorly and cause symptoms such as constipation or tenesmus.
Median survival has been shown to be 6.3 years, with 5-year, 10-year, and 20-year survivals of 67.6%, 39.9%, and 13.1%, respectively. Up to 5% of chordomas have metastatic disease to the lungs, bone, skin, or brain at initial presentation. In advanced-stage chordomas, up to 65% of cases are metastatic. With current treatments, most chordomas will recur or progress. Recurrence is due to subtotal excision or violation of the tumor capsule with resultant seeding of the surgical wound. Thus, en bloc resection is the mainstay treatment. The role of radiation therapy is unclear. Chordomas are insensitive to conventional chemotherapies.
Pathophysiology.
In 1857, Virchow first described the physaliferous cells—cells with cytoplasm replaced by bubble-like vacuoles—that are characteristic of chordoma. Strong evidence suggests that chordomas arise from notochordal remnants located in vertebral bodies and throughout the axial skeleton. Chordomas have three histologic variants: classical (conventional), chondroid, or dedifferentiated. Distinguishing chondroid chordomas from chondrosarcomas histologically can sometimes be difficult.
Imaging.
Chordomas are usually midline expansile lesions with osseous destruction and soft tissue mass ( Fig. 30-22 ). The vertebral body is most commonly involved in spinal chordomas. Radiographic findings include calcifications (30%-70%), osteosclerosis (43%-62%), invasion of adjacent intervertebral disks and vertebrae (11%-14%), and vertebral collapse.